All reagents and chemicals were purchased from commercial suppliers. Poly (2,7-(9,9s and bis (thiophen-2-yl) benzo-2,1,3-thiadiazole) (PFODBT), poly (styrene-co-maleic anhydride).
(PSMA) (Mw = 1600) and Pluronic F-127 were purchased from Sigma‒Aldrich. Tetrahydrofuran (THF) and bis (2,4,5-trichloro-6 (pentyloxycarbonyl)phenyl) oxalate (CPPO) were purchased from Macklin. 1,2-Dimyristoyl-sn-glycero-3-phosphoethanolamine-N-[methoxy (polyethylene glycol) (DSPE-PEG, Mw = 2000) was purchased from Shanghai Tuo Yang Biotechnology Co. Ltd. Caerulein was purchased from APEXBIO.
Transmission electron microscopy (TEM) images were obtained with a JEM-2100 F instrument (JEOL). Dynamic light scattering (DLS) was performed on a Malvern Zetasizer Nano ZS90 (Malvern). Absorbance values were recorded by ultraviolet‒visible absorption spectroscopy (UV-1800, Shimadzu) or microplate reader (SpectraMax iD3). Fluorescence spectra were recorded by fluorescence spectrophotometer (F-7000, HITACHI).
The fluorescent images were collected by a VILBER FUSION-FX7. EDGE V0.70with an exposure time of 5 s. All CL images were collected by an IVIS spectrum imaging system (Lumina XR) under bioluminescence modes with an open filter. CL images were analysed by ROI analysis using Living Image 4.0 software. The imaging parameters were as follows: bioluminescence modes open filter exposure time of 10 or 30 s, field of view of C.
All mice were purchased from Hunan SJA Laboratory Animal Co., Ltd. All animal experiments were carried out in accordance with the relevant laws and approved by the Institutional Animal Care and Use Committee of Hunan Provincial People’s Hospital (The First Affiliated Hospital of Hunan Normal University).
Synthesis of various semiconducting polymer nanoparticles
We used nanoprecipitation to assemble hydrophobic organic molecules into nanoparticles through the hydrophobic ends of amphiphilic surfactants, and the hydrophilic ends were exposed to enhance dispersion in water.
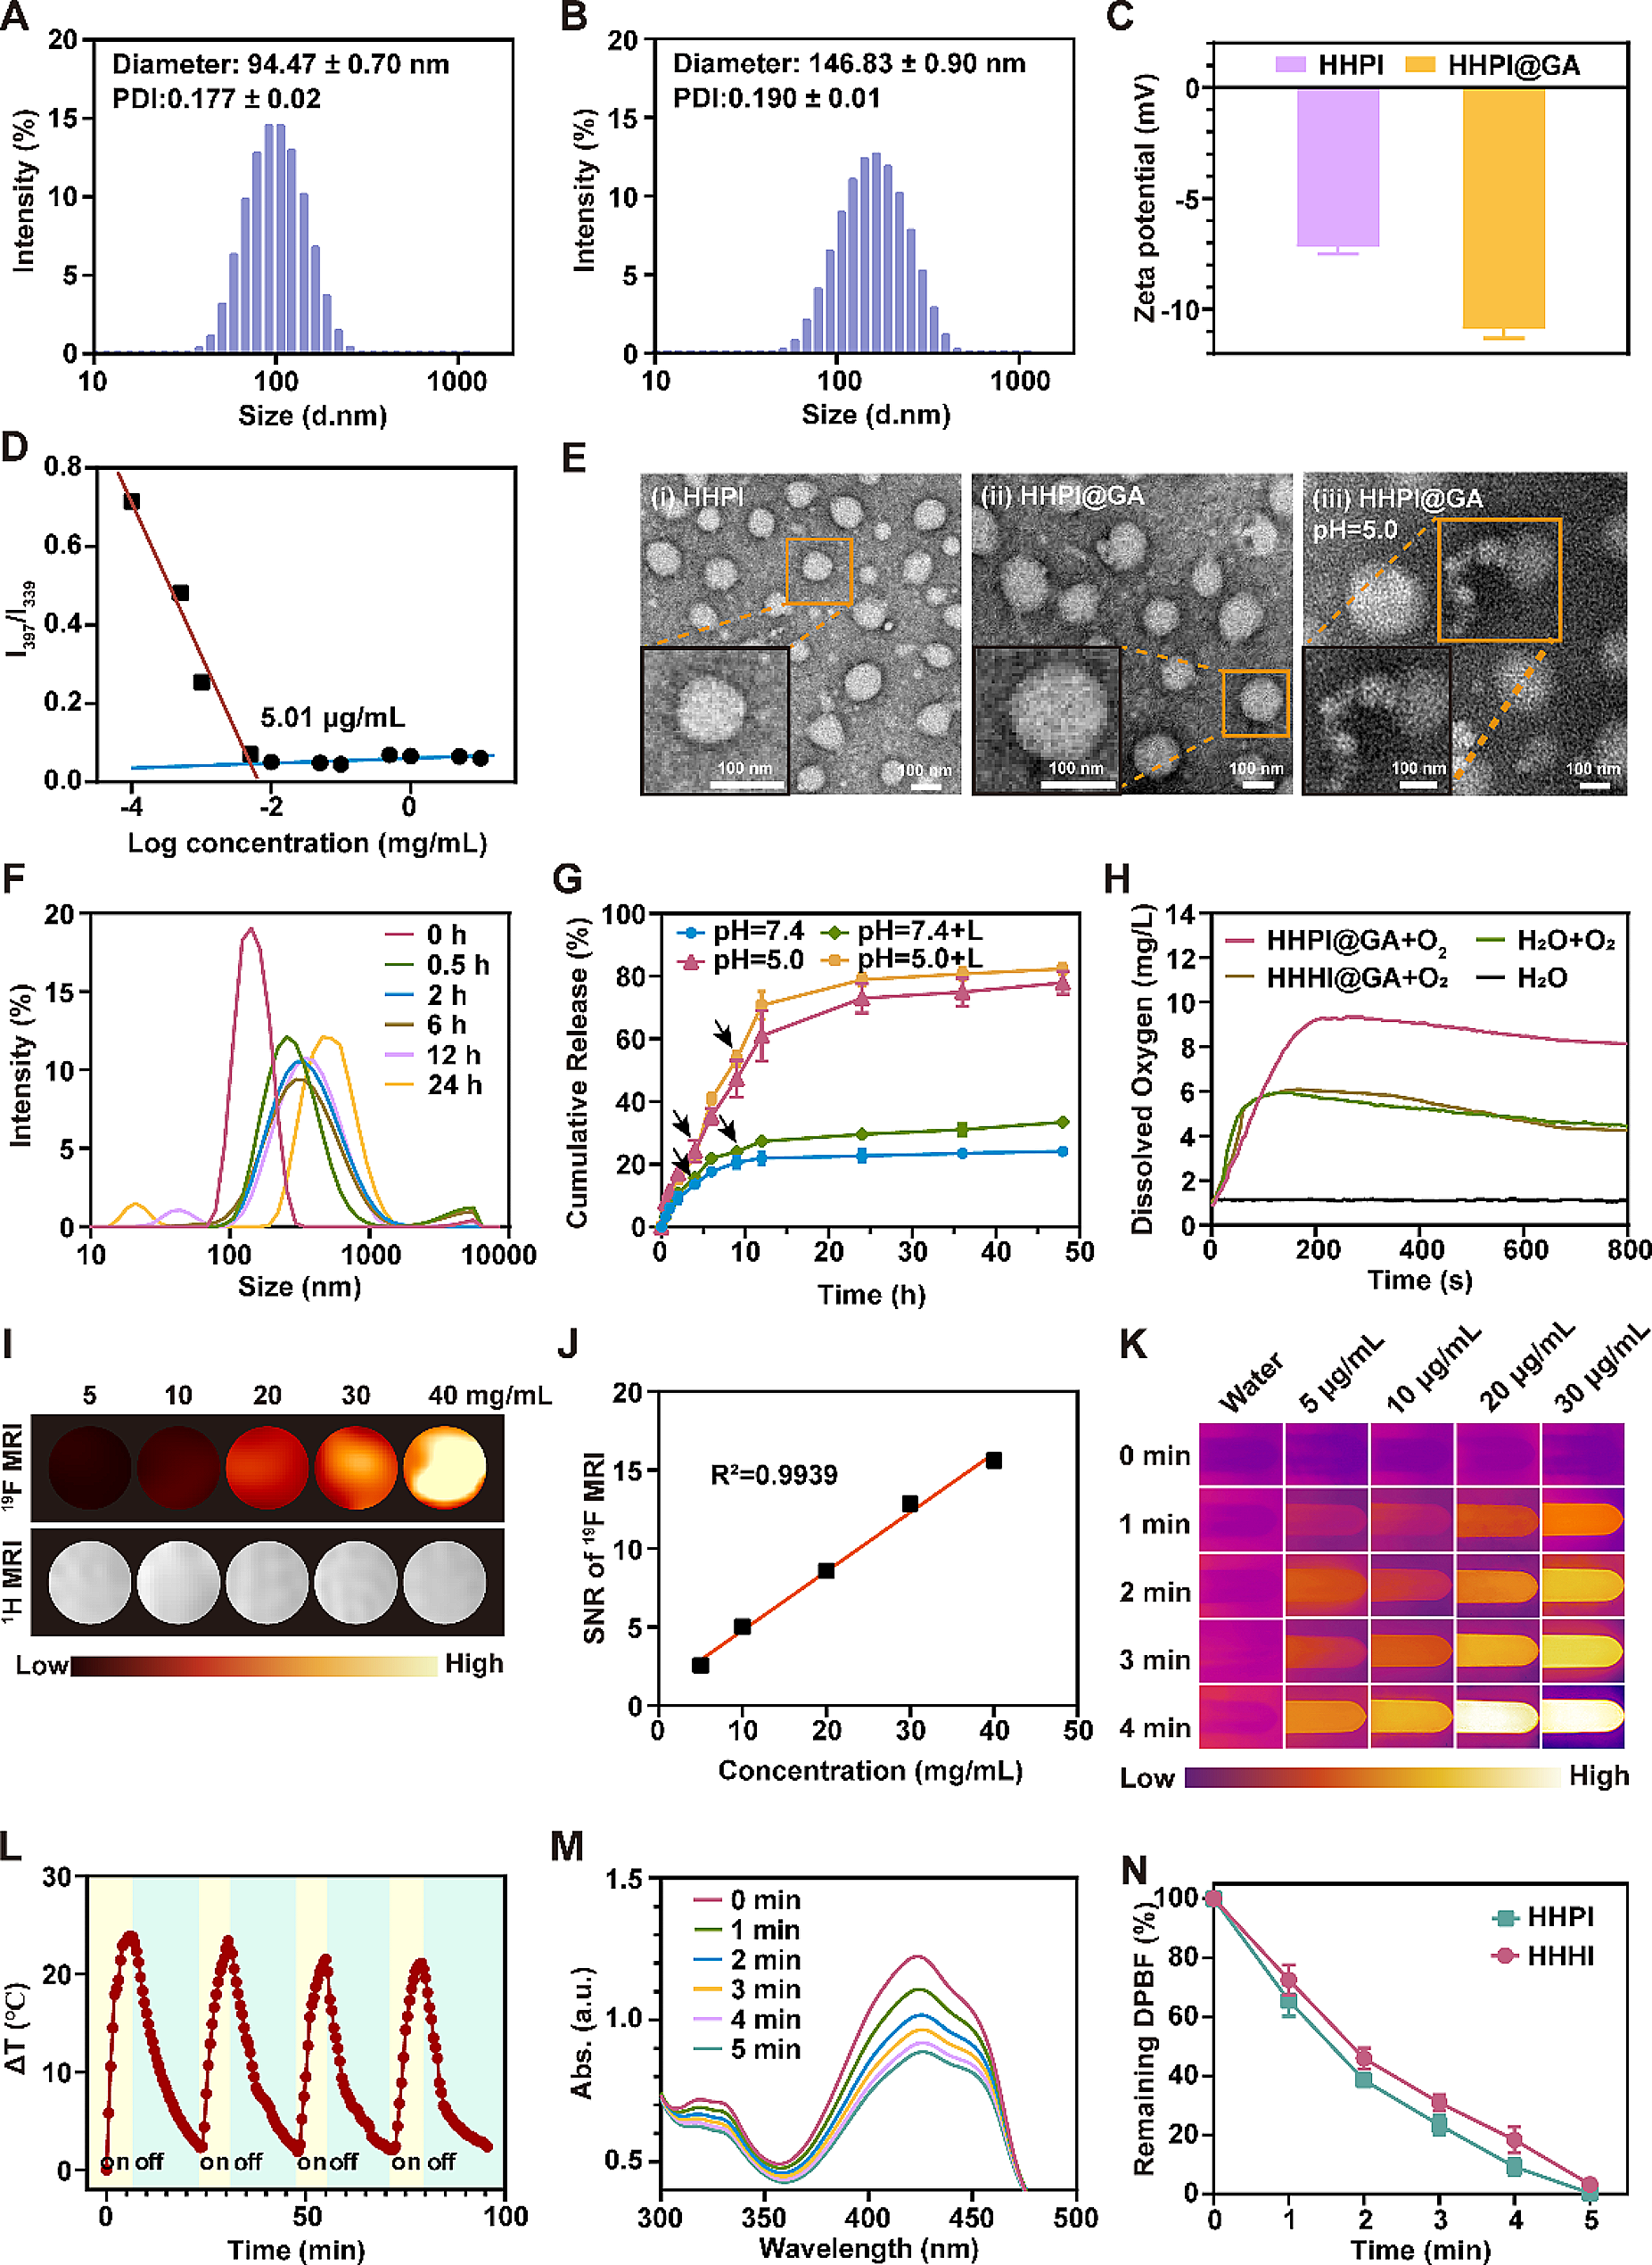
First, a mixed solution was prepared by dissolving various masses of PFODBT, CPPO and surfactant (DSPE-PEG, F127, or PSMA) into 1 mL of THF, by sonication. Second, the above solution was rapidly injected into water (9 mL) under continuous sonication for 10 min. The THF was evaporated after 15 min of rotary evaporation. The resulting nanoparticles were washed with water three times using a 100 K centrifugal filter tube and used immediately after synthesis.
For the synthesis of CPPO@PFO nanoparticles (CPPO/PFO = 40; 0.25 mg/mL PFO), a mixed solution was prepared by dissolving 0.25 mg of PFODBT, 10 mg of CPPO, and 10 mg of DSPE-PEG in 1 mL of THF.
CL imaging in vitro
To investigate selectivity, 50 µL of CPPO@PFO (CPPO/PFO = 40, 0.25 mg/mL of PFO) was mixed with 50 µL of different substances (1 µmol/mL) such as GSH, H2O2, ClO−, O2·− and ·OH, which were prepared by directly diluting commercially available GSH, H2O2, NaOCl, KO2 and KOH solution with water (1 µmol/mL).
For CL imaging in solution, 50 µL of H2O2 (200 µmol/mL) was mixed with 50 µL of CPPO@PFO (CPPO/PFO = 40; 0.25 mg/mL PFO) with different surfactants (DSPE-PEG, F127, and PSMA; the concentrations of surfactants were 10 mg/mL). For CL imaging of different proportions of CPPO@PFO (CPPO/PFO = 5,10,20,40 and 60), 50 µL of CPPO@PFO (0.25 mg/mL PFO) was mixed with H2O2 (200 µmol/mL). Then, for CL imaging of different concentrations of PFODBT (0.05 mg, 0.1 mg, 0.25 mg, 0.5 mg and 1 mg), 50 µL of CPPO@PFO (CPPO/PFO = 40) was mixed with H2O2 (200 µmol/mL). Finally, 50 µL of the optimal proportion of CPPO@PFO (CPPO/PFO = 40; 0.25 mg/mL PFO),was mixed with H2O2 (25 µmol/mL, 50 µmol/mL, 100 µmol/mL, 200 µmol/mL and 400 µmol/mL). Immediately after addition, CL images were collected using an acquisition time of 10 s.
Correlation between CPPO@PFO and cytotoxicity in vitro
Mouse-derived pancreatic exocrine cells (AR42J) were cultured in Ham’s F-12 K, medium containing 20% FBS and 1% P/S. The cells were cultured in T-25 flasks for cell inheritance at 37 °C under 5% CO2 in a constant temperature incubator. For CPPO@PFO experiments, AR42J cells preinoculated into 96-well plates were incubated with 190 µL of fresh Ham’s F-12 K containing CPPO@PFO (0.05 mg, 0.1 mg, 0.25 mg, 0.5 mg, or 1 mg). After coculture for approximately 24 h, the cells were examined to determine viability by the CCK-8 assay.
Correlation between CPPO@PFO and blood compatibility in vitro
Two milliliters -of blood were drawn from healthy people and centrifuged at 2000 r/min for 5 min, the upper serum was discarded, and the blood cells were washed three times with PBS. Finally, 1 ml of red blood cell suspension was obtained. Then, 0.1 mL of red blood cells (concentration: 109/ml) were cultured in different solutions (H2O, NaCl, DMEM, RPMI- 1640, PBS, and CPPO@PFO). After coculture for approximately 4 h, the haemolysis of the red blood cells in the different groups was observed.
Correlation between CPPO@PFO and biosafety in vivo
Two groups (control and CPPO@PFO) of mice (ICR, female, 6–8 weeks) received treatment with NaCl or CPPO@PFO (CPPO/PFO = 40; 0.25 mg/mL PFO). After intravenous (i.v.) injections, the mouse body weights were continuously recorded for 30 days. The serum of the mice was collected and stored at -80 °C. The main organs (heart, liver, kidney, lung, and pancreas) of the mice from each group were harvested. These tissues were fixed in 4% formalin for haematoxylin and eosin (H&E) staining.
Correlation between CL imaging and severity of acute pancreatitis in vivo
Female ICR mice received intraperitoneal injections of caerulein (50 µg/kg/h) 7 or 12 times. One hour after the last injection, three groups of mice (control, MAP and SAP groups) received CPPO@PFO treatment (CPPO/PFO = 40; 0.25 mg/mL PFO). After i.v. injection, CL images were obtained at different points in time using 30 s of acquisition. The mouse body weights were continuously recorded for 24 h. The serum of the mice was collected and stored at -80 °C. The main organs (heart, liver, kidney, lung, and pancreas) from mice from each group were harvested 30 min after treatment. These tissues were fixed in 4% formalin for H&E staining.
Blood indicator measurements
ELISAs were conducted using commercial kits to measure blood indicators. The mouse serum collected before was used and the ELISA assay was performed according to the manufacturer’s protocol.
Data statistics and analysis
All data in this study are expressed as the mean ± standard deviation (SD). GRAPHPAD software was used to compare the experimental data. p values equal to or less than 0.05 were considered statistically significant. Standard symbols are presented as *P < 0.05, **P < 0.01, ***P < 0.001, and ns, not significant.


留言 (0)