
記住我

Ethanol and sodium alginate were purchased from Aladdin Reagents (China). Gluconolactone was purchased from Chembee (China). Bortezomib was purchased from D& (China). Nano-hydroxyapatite was purchased from RHAWN (China). Trizol, Radio immunoprecipitation assay (RIPA) lysis buffer, BCIP/NBT alkaline phosphatase chromogenic Kit, Alizarin Red S Staining Kit, Calcium Colorimetric Assay Kit, and Dexamethasone (≥ 99%, Reagent grade) were purchased from Beyotime Biotechnology (China). Sodium β-glycerophosphate was purchased from Macklin (China). l-ascorbic acid was purchased from Sigma (China). Calcein AM & propidium iodide (PI) probes were purchased from Life Technologies (China). Reverse Transcription Kit, SYBR Green Detection System Kit, and ECL Chemiluminescent Substrate Kit were purchased from Servicebio (China). PVDF was purchased from Millipore (USA).
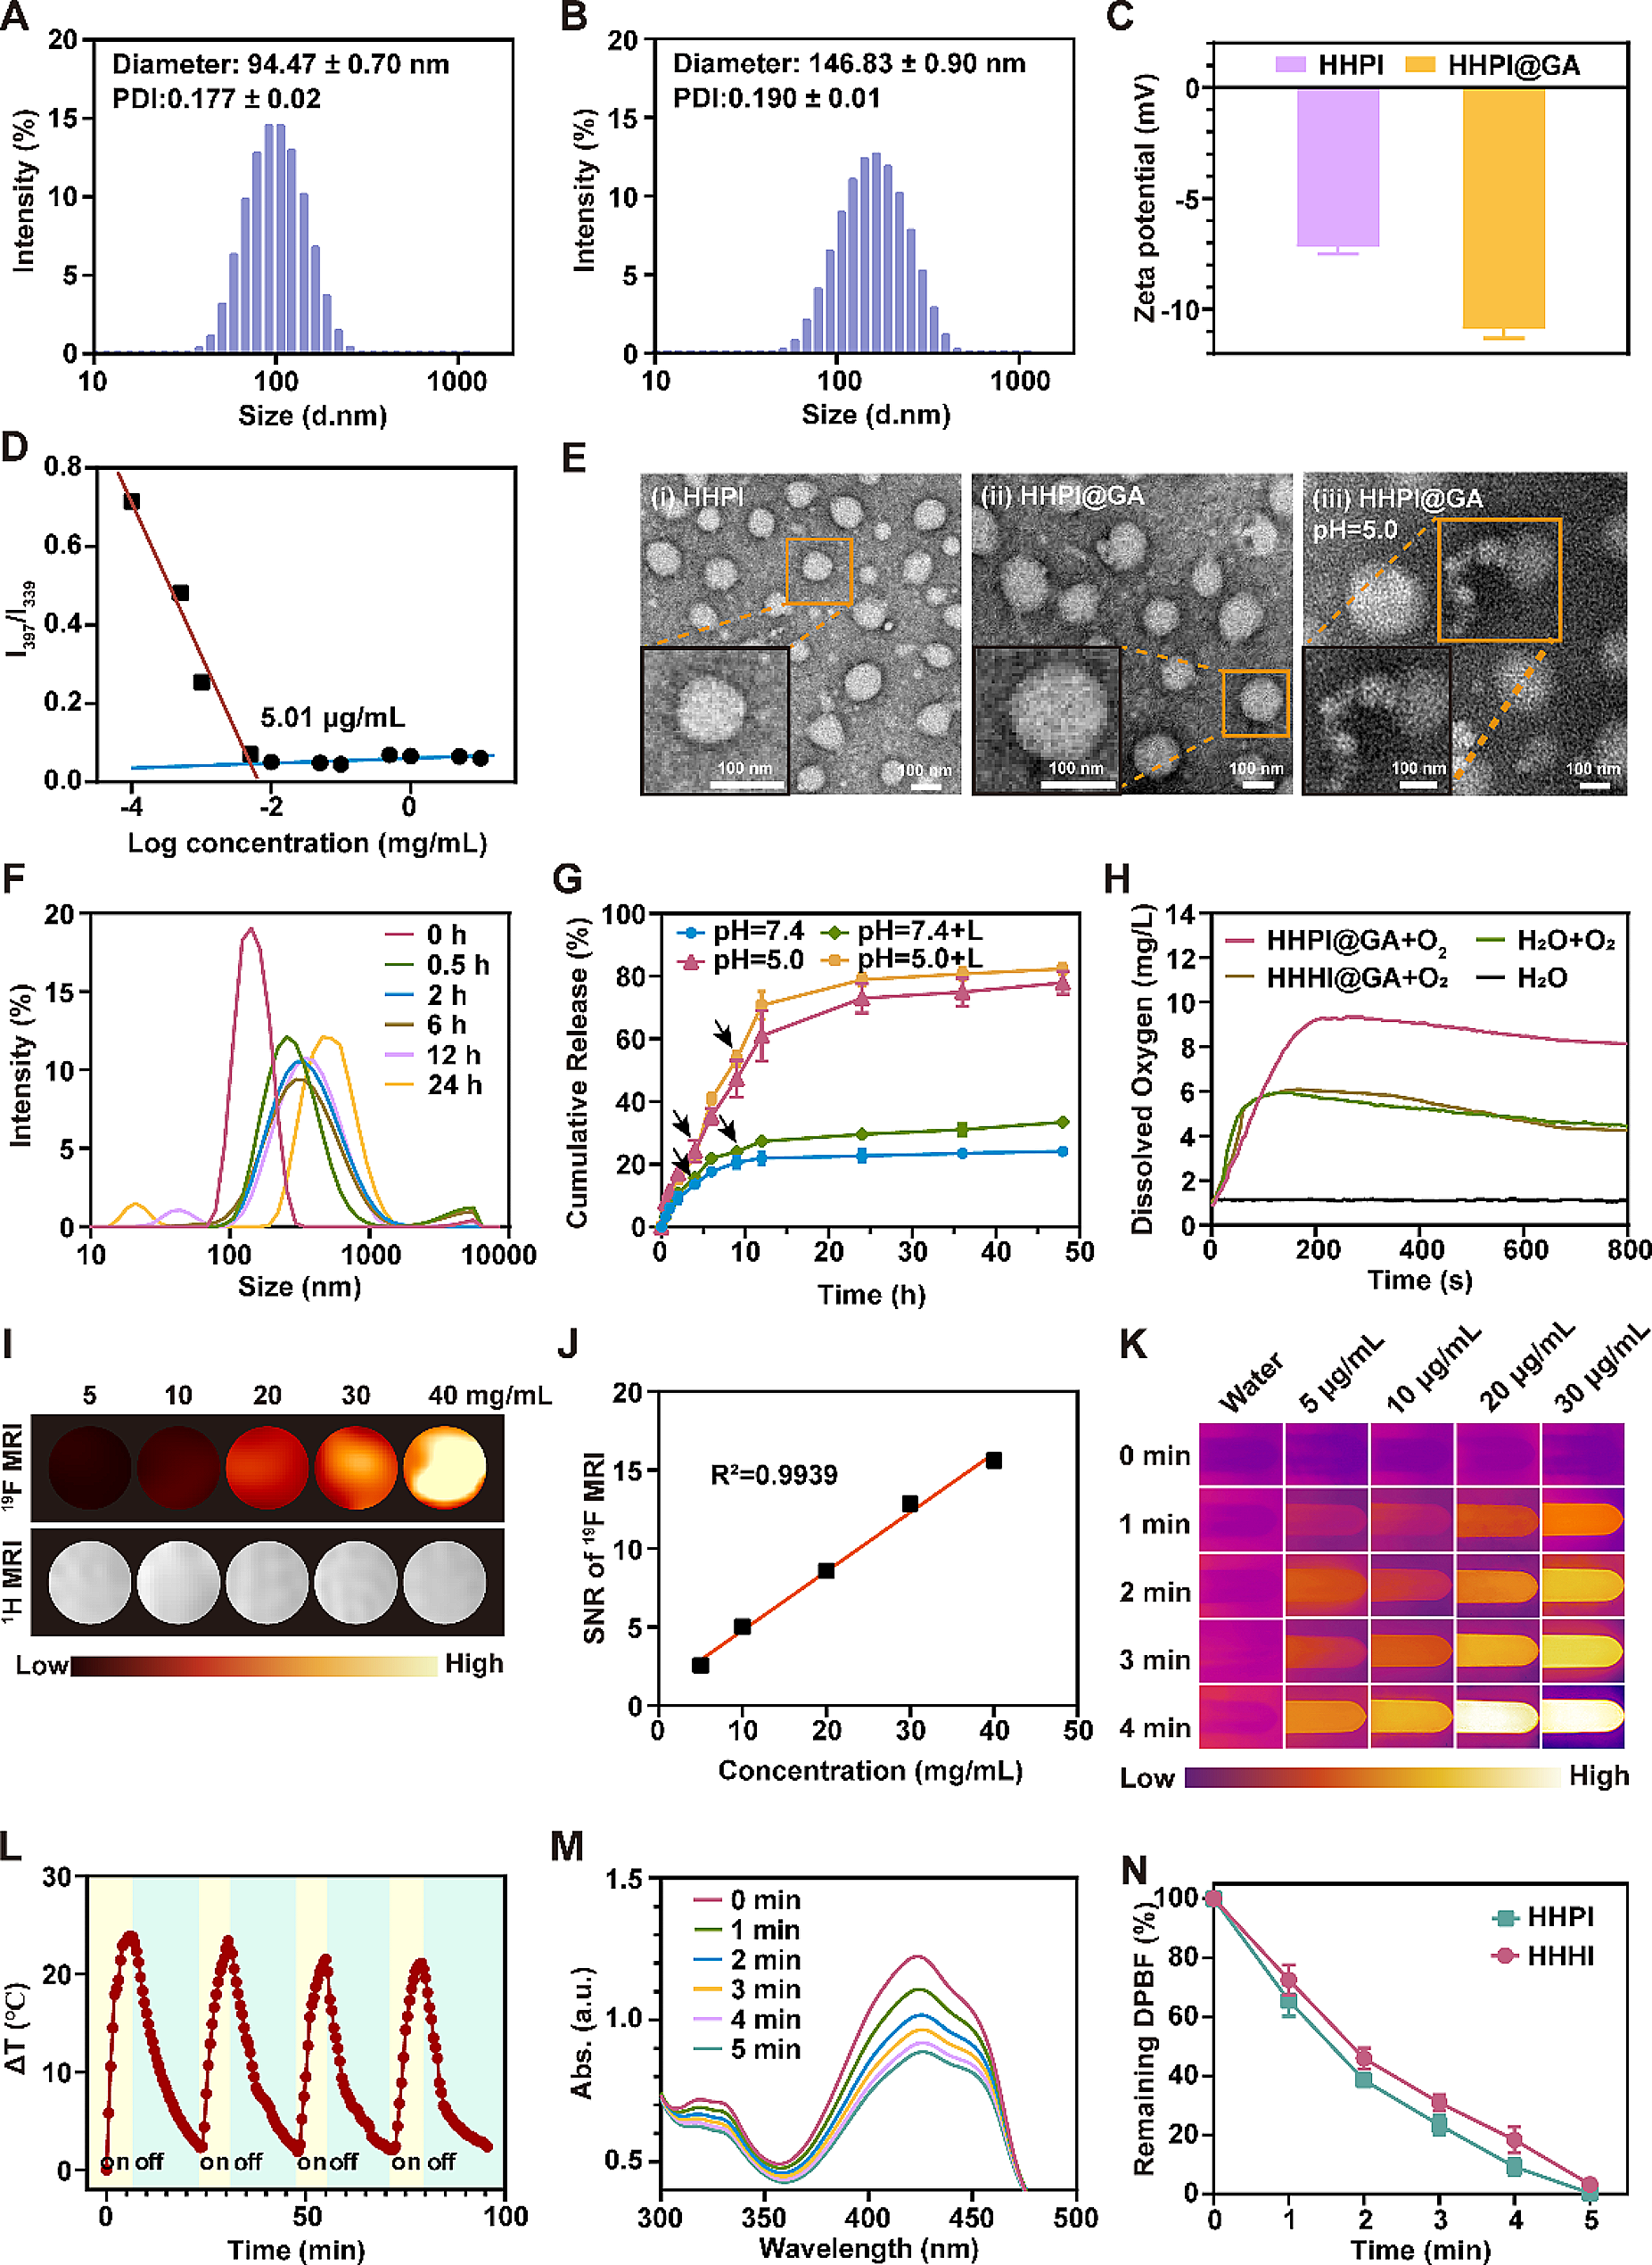
Synthesis of nHA@SA system and BTZ/nHA@SA scaffoldsFor the preparation of nHA@SA hybrid system, the 2.5% (w/v) SA was dissolved in distilled water (DW) and stirred at 1000 rpm at room temperature. nHA powder at a designed ratio (WnHA/WSA = 1) based on a previous study [47] was gradually added to the SA solution, stirred and mixed continuously until a homogenous suspension was obtained. Then, nHA@SA hydrogel composite samples were prepared by casting the composite suspension into discs, cylinders, and films for in vitro and in vivo studies, which were sterilized using an ultraviolet (UV) irradiation (253.7 nm) for 1 h before testing.
To prepare the BTZ/nHA@SA scaffold, BTZ was dissolved in DMSO first to make a 1 M stock solution. To load the drug, the calculated amounts of BTZ (0.4, 0.8, 0.12, 0.2, and 0.24 μg) were added into 100 mg nHA@SA hydrogel mixture, stirred at 200 rpm for 24 h at room temperature. Then 0.5% GDL was added, further stirred at 37 °C and 500 rpm for 5 min to ensure a slow and gradual release of Ca2+ from nHA, thus leading to an overall homogeneous cross-linking of SA. Finally, the resultant mixture was transferred into a 24-well plate and left in quiescence at room temperature for 6 h to form solid gels.
Afterward, hydrogel samples were frozen at − 20 °C for 2 h, followed by − 80 °C for 4 h, and then freeze-dried in a Freeze-dryer (FD-250101, FTFDS) at − 50 °C for 48 h to obtain porous scaffold. The samples were sterilized under UV irradiation for 2 one-hour cycles before the biological testing.
Structural characterizationThe microstructure of BTZ/nHA@SA scaffold was examined using a field-emission scanning electron microscope (FESEM, Apreo 2S, Thermo Scientific, USA). A small piece of freeze-dried scaffold material was painted with a conductive adhesive and sputter coated with gold. The elemental mapping was obtained by Energy-Dispersive Spectrometry with SEM (EDS, QUANTAX, Brucker, GER). The phase identification analysis of freeze-dried scaffold samples was characterized using an X-ray diffractometer (XRD, X’pert PRO MPD, Netherlands), with Cu Kα radiation (λ = 0.154 nm) and operating at 40 kV and 40 mA, scanning 2θ from 10° to 80°
Swelling testEach nHA@SA freeze-dried scaffold sample was weighed and recorded as W0, then placed in a 10 mL of phosphate buffer solution (PBS) at the pH values of 6.5 and 7.4, respectively, in a 15 ml centrifuge tube. The tubes were kept at 37 °C for various time points (1, 2, 3, 6, 12, 24, 36, and 48 h). At each time point, the hydrogel sample was removed from the tube, drained with filter paper, then weighed and recorded as Wt. The swelling ratio of the scaffolds was calculated using the following equation:
$$} = \left( }_} - }_0 } \right)/}_0 \times 00\% .$$
Degradation testEach nHA@SA scaffold was weighted and recorded as W0. Then the scaffolds were placed into the PBS solutions with pH values of 6.5 and 7.4 for 2 h on a shaking incubator at 37 °C and 100 rpm. The PBS solutions were refreshed every day. At the time point of 2, 4, 6, 8, 10, 12, 14, 16, 20, and 24 days, the scaffold samples were collected, washed with DW (2 times), and then stored in a − 20 °C refrigerator. Finally, the collected scaffolds were freeze-dried, then weighed and recorded as Wt accordingly. The degradation rate of nHA@SA scaffold was calculated according to the formula:
$$} = \left( }_0 - }_} } \right)/}_0 \times 00\% .$$
Mechanical testingThe SA scaffold and nHA@SA scaffold were made in the 10 mm height and 10 mm diameter molds. The compressive tests of the materials were determined by an Electronic Universal Testing Machine (INSTRON 5982, UK), for which the compressive speed was set at 1 mm/min and no preload was applied at room temperature. During the experiment, the stress–strain curve and the highest compressive stress were recorded.
Ca2+ releasing testTo assay the release of Ca2+ in vitro, 30 mg nHA@SA scaffolds were dispersed in 2 ml PBS solutions with pH values of 6.5 and 7.4 on a shaking incubator at 37 °C and 100 rpm. At every predetermined time (0, 6, 12, 24, 36, 48, 72, and 96 h), 500 μl supernatant was collected for analysis, and an equal fresh buffer was added to keep the constant volume. Finally, the ionic concentrations of Ca2+ in the graded extracts were investigated by Calcium Colorimetric Assay Kit.
BTZ loading and releasing testThe characteristic absorption peaks of the nHA@SA scaffold and BTZ/nHA@SA scaffold and BTZ standard solutions (0, 5, 10 15, 25, and 30 nM) were analyzed by a UV–Vis spectrophotometer (UV-2600, Shimadzu, Japan). BTZ/nHA@SA scaffold was immersed in DI water on a shaking incubator (37 °C, 100 rpm). Subsequently, 3 ml of supernatant was taken and replaced with 3 ml of fresh DI water. The cumulative release of BTZ released was measured with a UV–Vis spectrophotometer, and the encapsulation rate of BTZ in BTZ/nHA@SA scaffold was calculated. Scaffolds were immersed in PBS solutions of different pH values (6.5 and 7.4). At pre-determined time intervals (2, 4, 6, 8, 10, 12, 14, 24, 36, 48, and 60 h), aliquots (3 ml) were withdrawn and replaced with fresh medium. The absorption peaks at 270.5 nm of the supernatant was measured. The drug release amount at each time point was calculated according to the drug standard curve.
In vitro cell cultureMouse breast cancer cells (4T1) and mouse embryonic osteoblast cells (MC3T3) were cultured with RPMI-1640 and DMEM respectively, both were supplemented with 10% fetal bovine serum (FBS) and 1% penicillin and streptomycin.
Osteogenic differentiation induction (ODI) medium composed of α-MEM medium, 10% FBS, 1% penicillin/streptomycin, 10 mM β-glycerophosphate, 50 mg/ml l-ascorbic acid, and 100 nM dexamethasone, was used for the induction of MC3T3 cells osteogenic differentiation.
The extract medium from BTZ/nHA@SA scaffold was obtained by immersing 5 mg scaffolds with various drug loading (0, 0.02, 0.04, 0.06, 0.1, and 0.12 μg) in 10 ml culture medium for 24 h, the drug released levels were correspondent to the concentrations of BTZ standard solution (0, 5, 10, 15, 25, and 30 nM).
In vitro anti-tumor experiment4T1 cells (1 × 10⁴ cells per well) were cultured with various concentrations of BTZ (0, 5, 10 15, 25 and 30 nM) and the extract medium from test scaffolds at 37 °C with 5% CO2. Cell Counting Kit-8 assay was used to measure the cell viabilities. The absorbance at 450 nm was measured by a microplate reader (Epoch, Biotek).
Live and dead staining assay was also performed after 24 h culture. The 4T1 cells were washed with PBS, and incubated with 100 μl Calcein/PI dilutions at room temperature for 30 min in the dark, then the viability of the cells in each group was observed using an inverted fluorescent microscope (Ts2R-FL, Nikon, Japan).
In vitro biocompatibility of osteoblast cellsMC3T3 cells (1 × 10⁴ cells per well) were cultured with various concentrations of BTZ and were tested first. MC3T3 cells were cultured in the scaffold extracts medium at 37 °C with 5% CO2 for 24 h. CCK-8 and live-dead staining assays (as described in “BTZ loading and releasing test” section) were performed.
To further evaluate the biocompatibility of BTZ/nHA@SA scaffold, MC3T3 cells were seeded directly on the scaffolds and cultured for 1, 2, and 3 days. The viability of cells on the scaffold was determined by live-dead staining with Calcein/PI.
At each time point, MC3T3 cells cultured on BTZ/nHA@SA scaffold were fixed with 2.5% glutaraldehyde in PBS overnight, and post-fixed with 1% Osmium tetroxide (OsO4) in PBS for 2.5 h. Subsequently, samples were orderly dehydrated using a graded series of ethanol (30%, 50%, 70%, 80%, 90%, 95%, 100%) for 20 min, and dried with a critical point dryer (HCP-2, Hitachi, Holland). After Au coating, the cell morphology on the scaffold was observed under a FESEM.
In vitro osteogenic differentiation and mineralizationThe effects of BTZ released from the scaffolds on the differentiation and mineralization of MC3T3 cells were investigated using alkaline phosphatase (ALP), Alizarin red staining, and gene expression.
ALP staining was performed with a BCIP/NBT alkaline phosphatase chromogenic Kit. 1 × 10⁵ MC3T3 cells were cultured with the extract medium and ODI medium in 24-well plates for 7 days. Then the cells were fixed with 4% paraformaldehyde (PFA) for 30 min, and stained with ALP staining solution. After washing with distilled water, the ALP-stained cells were photographed.
ARS staining was performed with Alizarin Red S Staining Kit. 1 × 10⁵ MC3T3 cells were cultured with the extract medium in 24-well plates for 14 days. MC3T3 cells were fixed with 4% PFA for 15 min, and stained with Alizarin Red for 20 min at room temperature. After rinsing with distilled water, the images of ARS-stained cells were recorded.
Gene expression of osteogenic differentiation markers, such as ALP and the transcription factor Osterix (Sp7) were determined by real-time quantitative Polymerase Chain Reaction (qPCR). 1 × 10⁵ MC3T3 cells were cultured with the extract and ODI medium. After 3, 5, and 7 days of culture, MC3T3 cells were collected in Trizol and the total RNA was extracted. cDNA was generated using a Reverse Transcription Kit. qPCR was performed using the SYBR Green Detection System kit (n = 3). The primers were listed in Additional file 1: Table S1.
In addition, a western blot analysis of RUNX2, COL1, and GAPDH was carried out. 1 × 10⁵ MC3T3 cells in 24-well plates were cultured with the extract medium for 7 days, then the cells were collected and lysed by WB/IP lysis buffer at 4 °C for 10 min. Subsequently, 40 μg protein of each sample was loaded onto the 10% SDS-PAGE at 80 V for 1.5 h, then the proteins were transferred onto the PVDF membrane. After blocking with 5% milk for 2 h, the PVDF membrane was incubated with primary antibodies at 4 °C for 12 h. Primary antibodies against the following proteins were used: RUNX2 (Mouse, 1:750), COL1 (Mouse, 1:750), and GADPH (Mouse, 1:45,000). Then the secondary antibodies (Mouse, 1:3000) were utilized to incubate with the membrane at room temperature for 2 h. The bands were visualized using an ECL Chemiluminescent Substrate Kit, followed by quantification analysis using the Image J software.
In vivo studyAll animal experiments were carried out according to the guidelines for the use and care of laboratory animals approved by the ethics committee of the Biological Resource Centre of the Agency for Science, Technology and Research, Zhejiang University. Female Balb/c mice (4 weeks old) were purchased from Shanghai SLAC Laboratory Animal Co. Ltd. The 8-week-old male rabbits were purchased from the Zhejiang Academy of Medical Sciences animal center. All animals were humanely treated during the experiments.
In vivo anti-tumor experimentRPMI-1640 medium with 10% FBS was used to cultivate 4T1 cells. After acclimation for 5 days, 4-week-old mice had their axilla debrided, and the 4T1 tumor cells (2 × 10⁶) were implanted into their axillae. Anti-tumor experiments were started when the tumor volume reached 100 mm3.
Mice were divided randomly into five groups (n = 5): (I) Ctrl, sham operation; (II) nHA@SA scaffold implantation; (III) injection of BTZ; (IV) BTZ injection + nHA@SA scaffold implantation; and (V) BTZ/nHA@SA scaffold implantation. The tumor volume and weight of mice were assessed and recorded every two days. The tumor volume (V) was calculated using the following formula: volume = (tumor length) × (tumor width)2 × 0.5 [48]. The relative volume of the tumor was calculated as the tumor volume at a specific day over the tumor volume at day 0. Blood from the mouse ocular vein was collected on the 14th day following the standard serum collection procedure.
At the end of the experiments, the tumor and main organs (heart, liver, spleen, lung, and kidney) were collected and treated with a 10% formalin solution. Cancer tissue and viscera were embedded in paraffin first, and 4 μm sections were obtained using an Ultra-Thin Semiautomatic Microtome (RM2016, Leica). The sections were stained with haematoxylin/eosin (H&E) and examined using an inverted fluorescence microscope.
In vivo osteogenesis experimentA critical-size femoral defect model [49] was used in the osteogenesis study. The bone defect (6 mm in diameter × 9 mm in depth) was made at the right distal femur of 8 weeks old male rabbit. The rabbits were randomly divided into three groups (n = 3): (a) BTZ only (no implantation); (b) nHA@SA scaffold implantation; (c) BTZ/nHA@SA scaffold implantation. After 12 weeks, the rabbits were sacrificed by an intraperitoneal injection of 10% chloral hydrate. The femur was collected, fixed in 4% paraformaldehyde at 4 °C for 48 h, and then kept in 75% alcohol in a specimen container. The femur samples were analysed by using micro-CT scanning (SCANCO μCT 100, Scanco Medical, Switzerland; source voltage: 70 kVp, power: 200 μA, exposure time: 300 ms, and voxel size: 30 microns) to determine the bone formation in the defect site. The raw scanned data were reconstructed using the scan Evaluation. A 3D analysis of bone formation was carried out in scan Evaluation, such as bone volume/total bone volume (BV/TV), local bone density (BMD), and trabecular number (Tb.N), trabecular thickness (Tb.Th), trabecular separation (Tb.Sp), and cortical bone thickness (Ct.Th). The osteogenic capacity of the implanted scaffolds in the bone defects was compared.
In addition to micro-CT imaging, the defect sections of rabbit femurs were extracted, fixed in 4% paraformaldehyde at 4 °C for 48 h, and dehydrated with a series of gradient alcohols in a dehydrator (Danotello, DIAPATH). The bone samples were dipped in wax, embedded in paraffin, and kept in the − 20 °C freezer (JB-L5). 4 μm slices were sectioned using an Ultra-Thin Semiautomatic Microtome (RM2016, Leica), then stained with H&E, and analysed using an inverted fluorescence microscope.
To further quantify the new bone formation in the defect site, images of bone sections in the defect site were recorded with a positive white light photography microscope (Eclipse Ci-L, Nikon, Japan). The trabecular bone area (mm2) within a defined region of interest (ROI) was measured. The proportion of trabecular bone area was calculated according to the formula: the percentage of the trabecular bone area (%) = trabecular bone area/ROI area * 100% (Fig. 1).
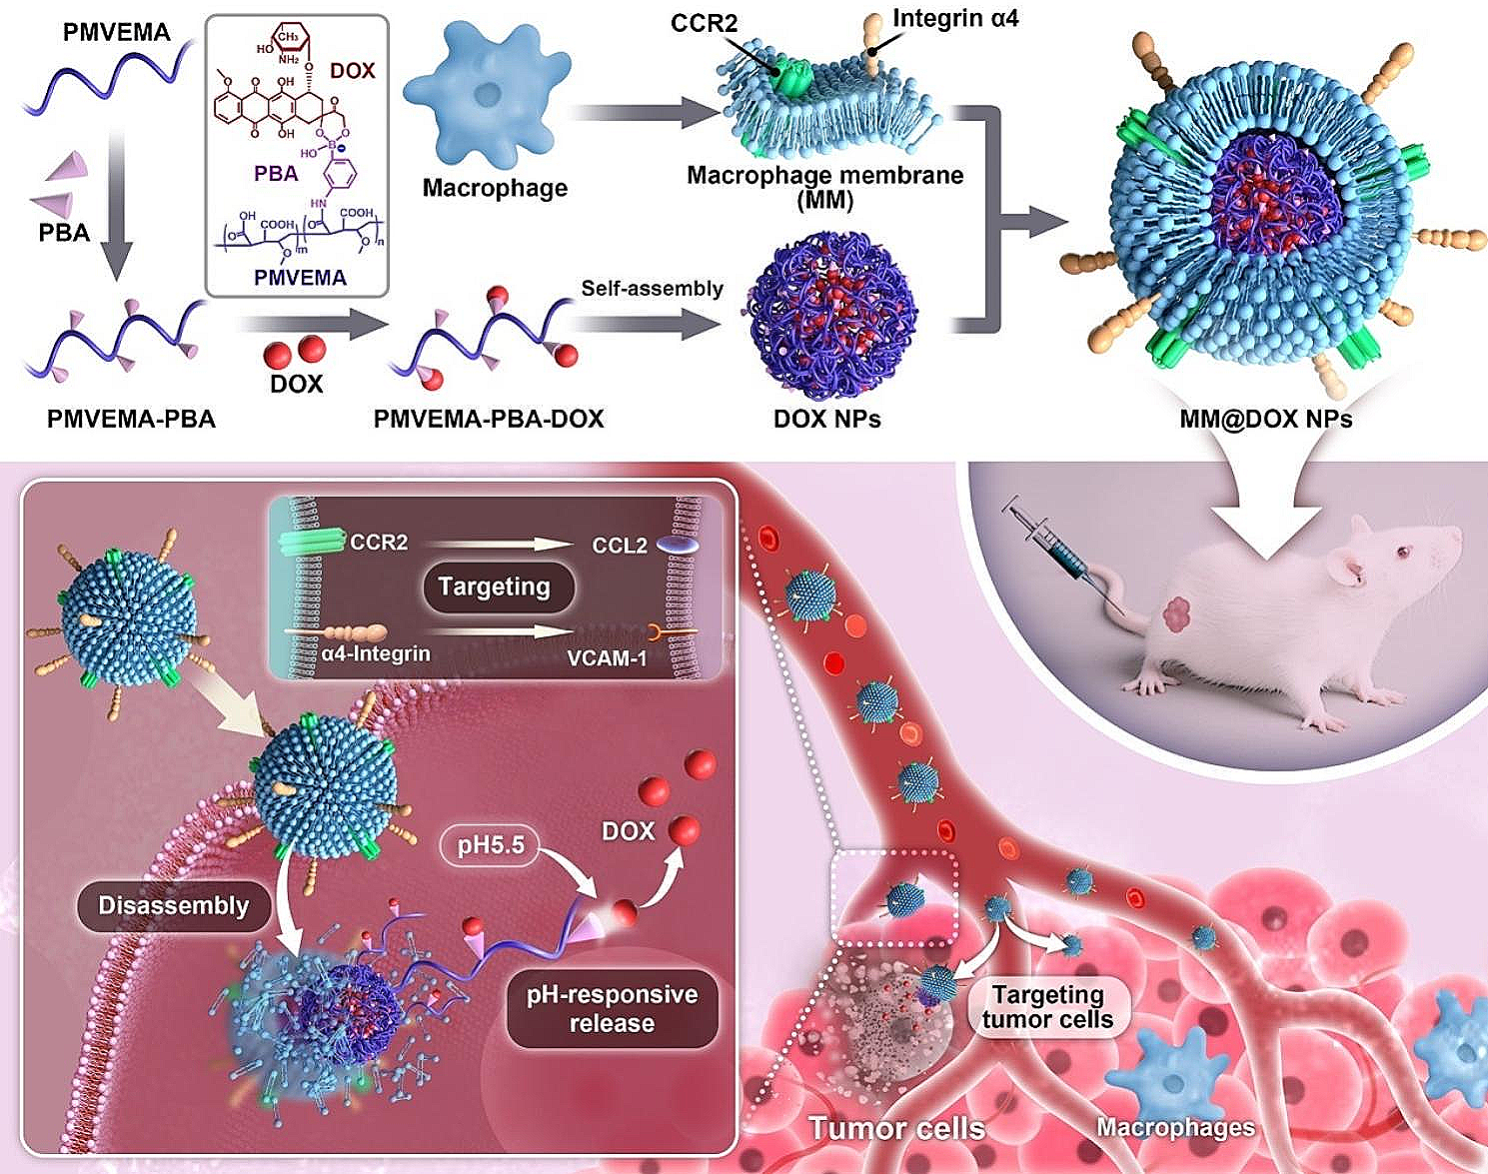
Fig. 1
Schematic illustration of BTZ/nHA@SA scaffold for simultaneous tumor inhibition with bone regeneration
Statistical analysisAll data were expressed as mean values (± standard deviation) and analysed by GraphPad Prism 8.0. The homogeneity of variances and the linearity of the relationship between dependent and independent variables were verified. The significance level was set at 0.05. Comparisons and significance analysis of multiple groups were conducted through a one-way analysis of variance (ANOVA). p < 0.05 was considered statistically significant.
留言 (0)