
記住我


In 2010, the American Heart Association (AHA) set an ideal cardiovascular health (CVH) goal to improve the CVH of all Americans by 20% while reducing mortality from cardiovascular disease (CVD) by 20% over the next decade (1). In 2022, AHA updated and strengthened the concept of CVH to encourage individuals and populations to further improve CVH and proposed a new method for defining and quantifying CVH metrics known as “Life’s Essential 8” (LE8). In this method, sleep health was added as a new component of CVH (2).
Poor baseline CVH scores and low CVH score trajectories, defined by the old Life’s Simple 7 (LS7), have previously been associated with increased burden from hypertension, CVD, and subclinical atherosclerosis (3–5). Carotid intima-media thickness (cIMT) measured by carotid ultrasonography has been shown to more accurately identify populations at high risk of CVD than using major risk factors (6). More evidence has further supported an association between CVH and cIMT, whether baseline CVH or CVH trajectories that were defined by previous LS7 metrics (7, 8). However, the association between baseline LE8 and cIMT has not yet been studied. Furthermore, several previous studies have found that CVH components may be influenced by many factors and change over time. As a result, describing the longitudinal pattern of the CVH score using CVH score trajectories provides a more reliable result.
As a result, we used data from the Kailuan study to investigate the association between baseline CVH scores defined by new LE8 metrics and cIMT, and we further explored the association between new LE8 score trajectories and cIMT.
MethodsStudy population and designThe Kailuan study is an ongoing prospective cohort study conducted among a functional community population in Tangshan, China, since 2006. All participants are followed up every 2 years, with a total of six follow-ups completed so far. The details of the Kailuan study have been described previously (9, 10). The participants were randomly chosen from the participants who were enrolled in the first physical examinations, and they completed the assessment of cIMT by ultrasonography from the third to seventh physical examinations (11).
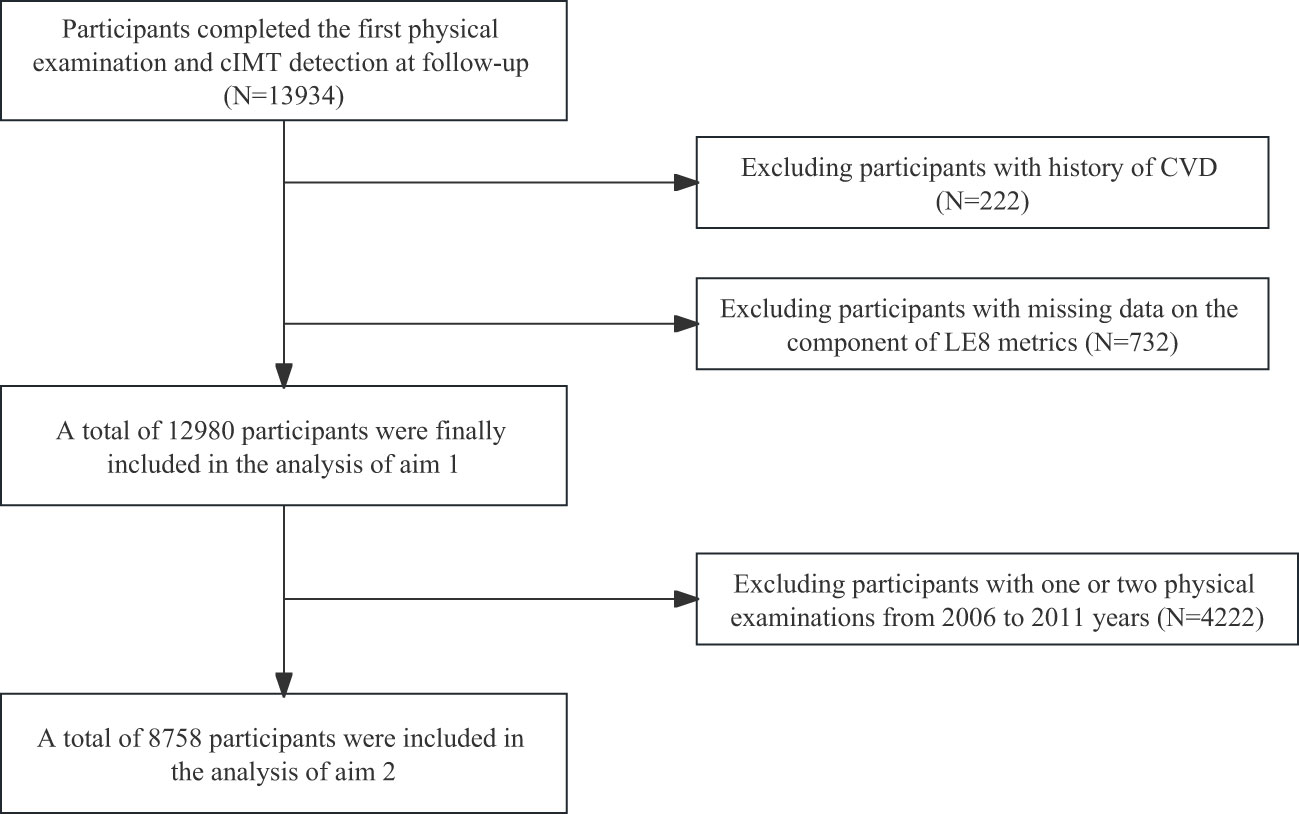
Briefly, 13,934 participants completed the first physical examination and cIMT detection at follow-up. We excluded 954 participants who could meet the following criteria: (1) 222 participants with a history of CVD; and (2) 732 participants with missing data on the component of LE8 metrics. Therefore, a total of 12,980 participants were finally included in the analysis.
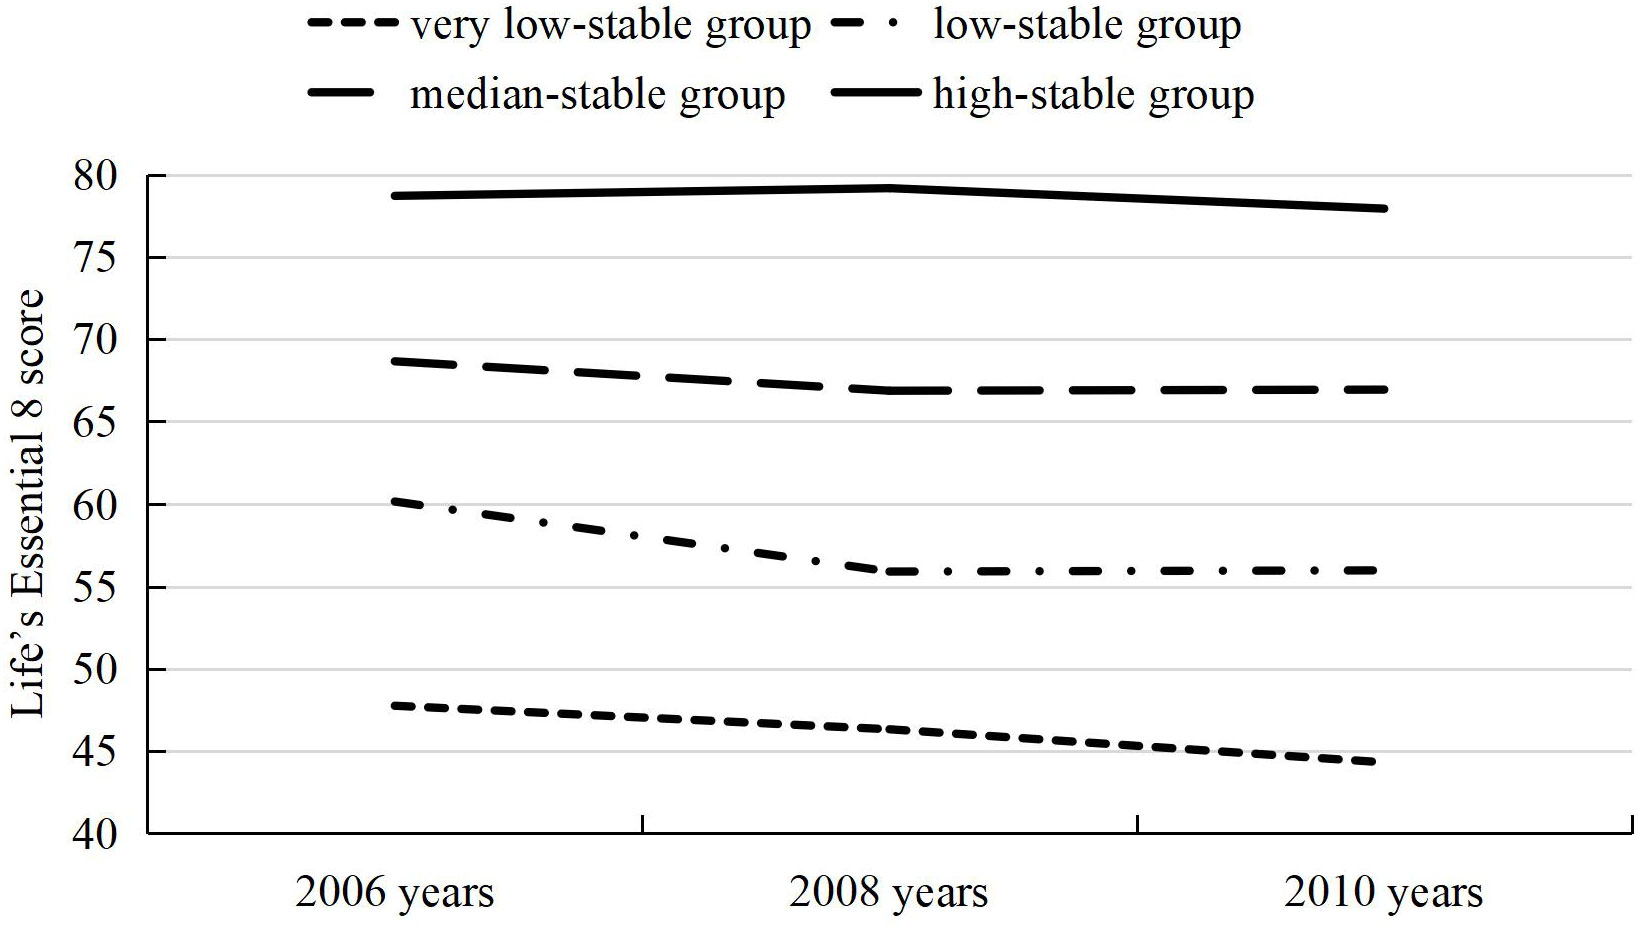
Aim 1 of this study was to investigate the associations between baseline LE8 score and continuous cIMT/high cIMT. Aim 2 of this study was to investigate the association between LE8 trajectories and continuous cIMT/high cIMT. In addition, the LE8 score trajectories were developed from the first physical examinations to the third physical examinations (8,758 participants met the criteria). The participants were divided into four trajectory patterns according to LE8 scores (very low-stable group, low-stable group, median-stable group, and high-stable group). Figure 1 shows the flow chart of inclusion and exclusion criteria. Figure 2 shows the four trajectory groups in the present study.
Figure 1 Flow chart of the current study.
Figure 2 Life’s Essential 8 trajectories.
The Declaration of Helsinki was followed in this study. This study was approved by the ethics committee of Kailuan General Hospital. All participants signed an informed consent form.
LE8 metricsInformation on demographic characteristics, medical history, and lifestyle factors, including tobacco exposure, physical activity, salt intake, sleep duration, drinking status, education status, marital status, income status, and so on, was collected by trained staff through standardized questionnaires, as described previously (12).
After participants had fasted for at least 8 h, 5 ml of blood was drawn to measure biochemical indexes such as total cholesterol (TC), low-density lipoprotein cholesterol (LDL-C), high-density lipoprotein cholesterol (HDL-C), high-sensitive C-reactive protein (Hs-CRP), and fasting blood glucose (FBG). All biochemical analyses were performed using an auto-analyzer (Hitachi 747; Hitachi, Tokyo, Japan). non-HDL-C = TC − HDL-C. Blood pressure was measured on the day of the physical examination between 7:00 and 9:00 a.m., without smoking or tea/coffee consumption allowed 30 min before measurement, and after participants had remained in a seated position for at least 5 min. The measurement was repeated three times with an interval of 1–2 min, and the mean value was taken. Blood pressure and blood samples were measured by trained staff through standardized methods, as described previously (13). Body mass index (BMI) was calculated as weight (kg)/height (m)2.
DietOwing to the lack of detailed dietary data and taking into account the influence of consumption of salt intake, tea, and high-fat foods on CVD risks among the Chinese population, salt intake, tea consumption, and high-fat foods intake based on a questionnaire were used as a surrogate measure for diet quality, as previously described (14–17).
Fasting blood glucoseOwing to the lack of hemoglobin A1c and the close relationship between hemoglobin A1c and mean FBG, A1C was replaced by FBG as blood glucose metrics. FBG (mg/dl) = 28.7 * A1C − 46.7 (18).
According to the updated and enhanced approach to assess CVH, definition and scoring for the components of LE8, including four health behaviors (diet, physical activity, smoking status, and sleep health) and four health factors (BMI, non-HDL-C, FBG, and blood pressure), were shown in Supplementary Table S1 (Additional file 1) (2). Each component of LE8 was scored on a scale of 0 to 100 points. The overall LE8 score was calculated by summing the scores for each of the eight metrics together and dividing the total by 8, to provide a LE8 score ranging from 0 to 100. Participants were categorized into five groups (Q1 [<57.29], Q2 [57.29~64.79], Q3 [64.79~69.79], Q4 [69.79~76.25], and Q5 [≥76.25]) according to quintiles of LE8 score, and the lowest quintile (Q1) was used as the reference group.
CovariatesIn recent years, alcohol consumption was defined as the daily consumption of at least 100 ml of beverages (or liquors) containing alcohol of ≥ 50% alcohol/day (19). Education status was categorized as high school or above and junior high school or below. Marital status was categorized as in married vs. not married. Income status was categorized into ≤ 1,000 and > 1,000 RMB/month (20).
cIMTThe cIMT was measured using a Philips HD-15 color ultrasonic diagnostic instrument (with a probe frequency of 5–12 MHz). The participants assumed the supine position, and the cIMT of the bilateral carotid arteries, including the common carotid artery, carotid bifurcation, and internal and external carotid arteries, were measured. Two professional physicians completed the measure: one operated on and another recorded. The examination results were then reviewed by two independent operators, and discrepancies between their evaluations were resolved by consensus. The mean of the maximum cIMT readings of three right and three left far walls for common, bifurcation, and internal segments were used. The standardized methods have been previously described (21). In this study, the definition and measurements of cIMT followed the Mannheim Carotid Intima-Media Thickness and Plaque Consensus (2004–2006–2011) (22). In addition to the continuous cIMT measurement, an age- (5 years) and sex-specific 90th percentile cut point determined high cIMT (23). High cIMT was defined as a cIMT value equal to or greater than the given cut point. The cut points for current analyses are shown in Supplementary Table S2 (Additional file 1).
Statistical analysisContinuous, normally distributed variables were presented as the mean ± standard deviation (SD), and groups were compared using one-way ANOVA. Category variables were presented by number and percentage (%), with comparisons between groups by Chi-square test. In the primary analysis for aim 2, participants with LE8 scores in 2006, 2008, and 2010 were included in trajectory modeling using the SAS procedure Proc Traj. The best model fit was assessed using the Bayesian information criterion and the number of participants in each trajectory (> 5% of the overall population) (13, 24). Finally, the participants were divided into four trajectory patterns according to both baseline LE8 scores and LE8 scores over time (very low-stable group, low-stable group, median-stable group, and high-stable group).
To address aims 1 and 2, the association between baseline/trajectory groups and continuous cIMT/high cIMT was assessed by using SAS proc genmod to calculate β, relative risk (RR), and 95% confidence intervals (CI). Models were sequentially adjusted for age, sex, current drinker, education status, income status, and marital status. Models of association between trajectory groups and continuous cIMT/high cIMT were further adjusted for either baseline or proximal LE8 score because of the correlation between baseline and proximal scores.
To verify the robustness of the results, several sensitivity analyses were performed (male participants, participants without hypertension, participants without diabetes, participants without lipid-lowering drugs/antihypertensive drugs/hypoglycemic drugs, and participants in junior high school or below).
All statistical analyses were conducted using SAS 9.4 (SAS Institute, Inc., Cary, NC, USA), and a two-tailed p < 0.05 was considered statistically significant.
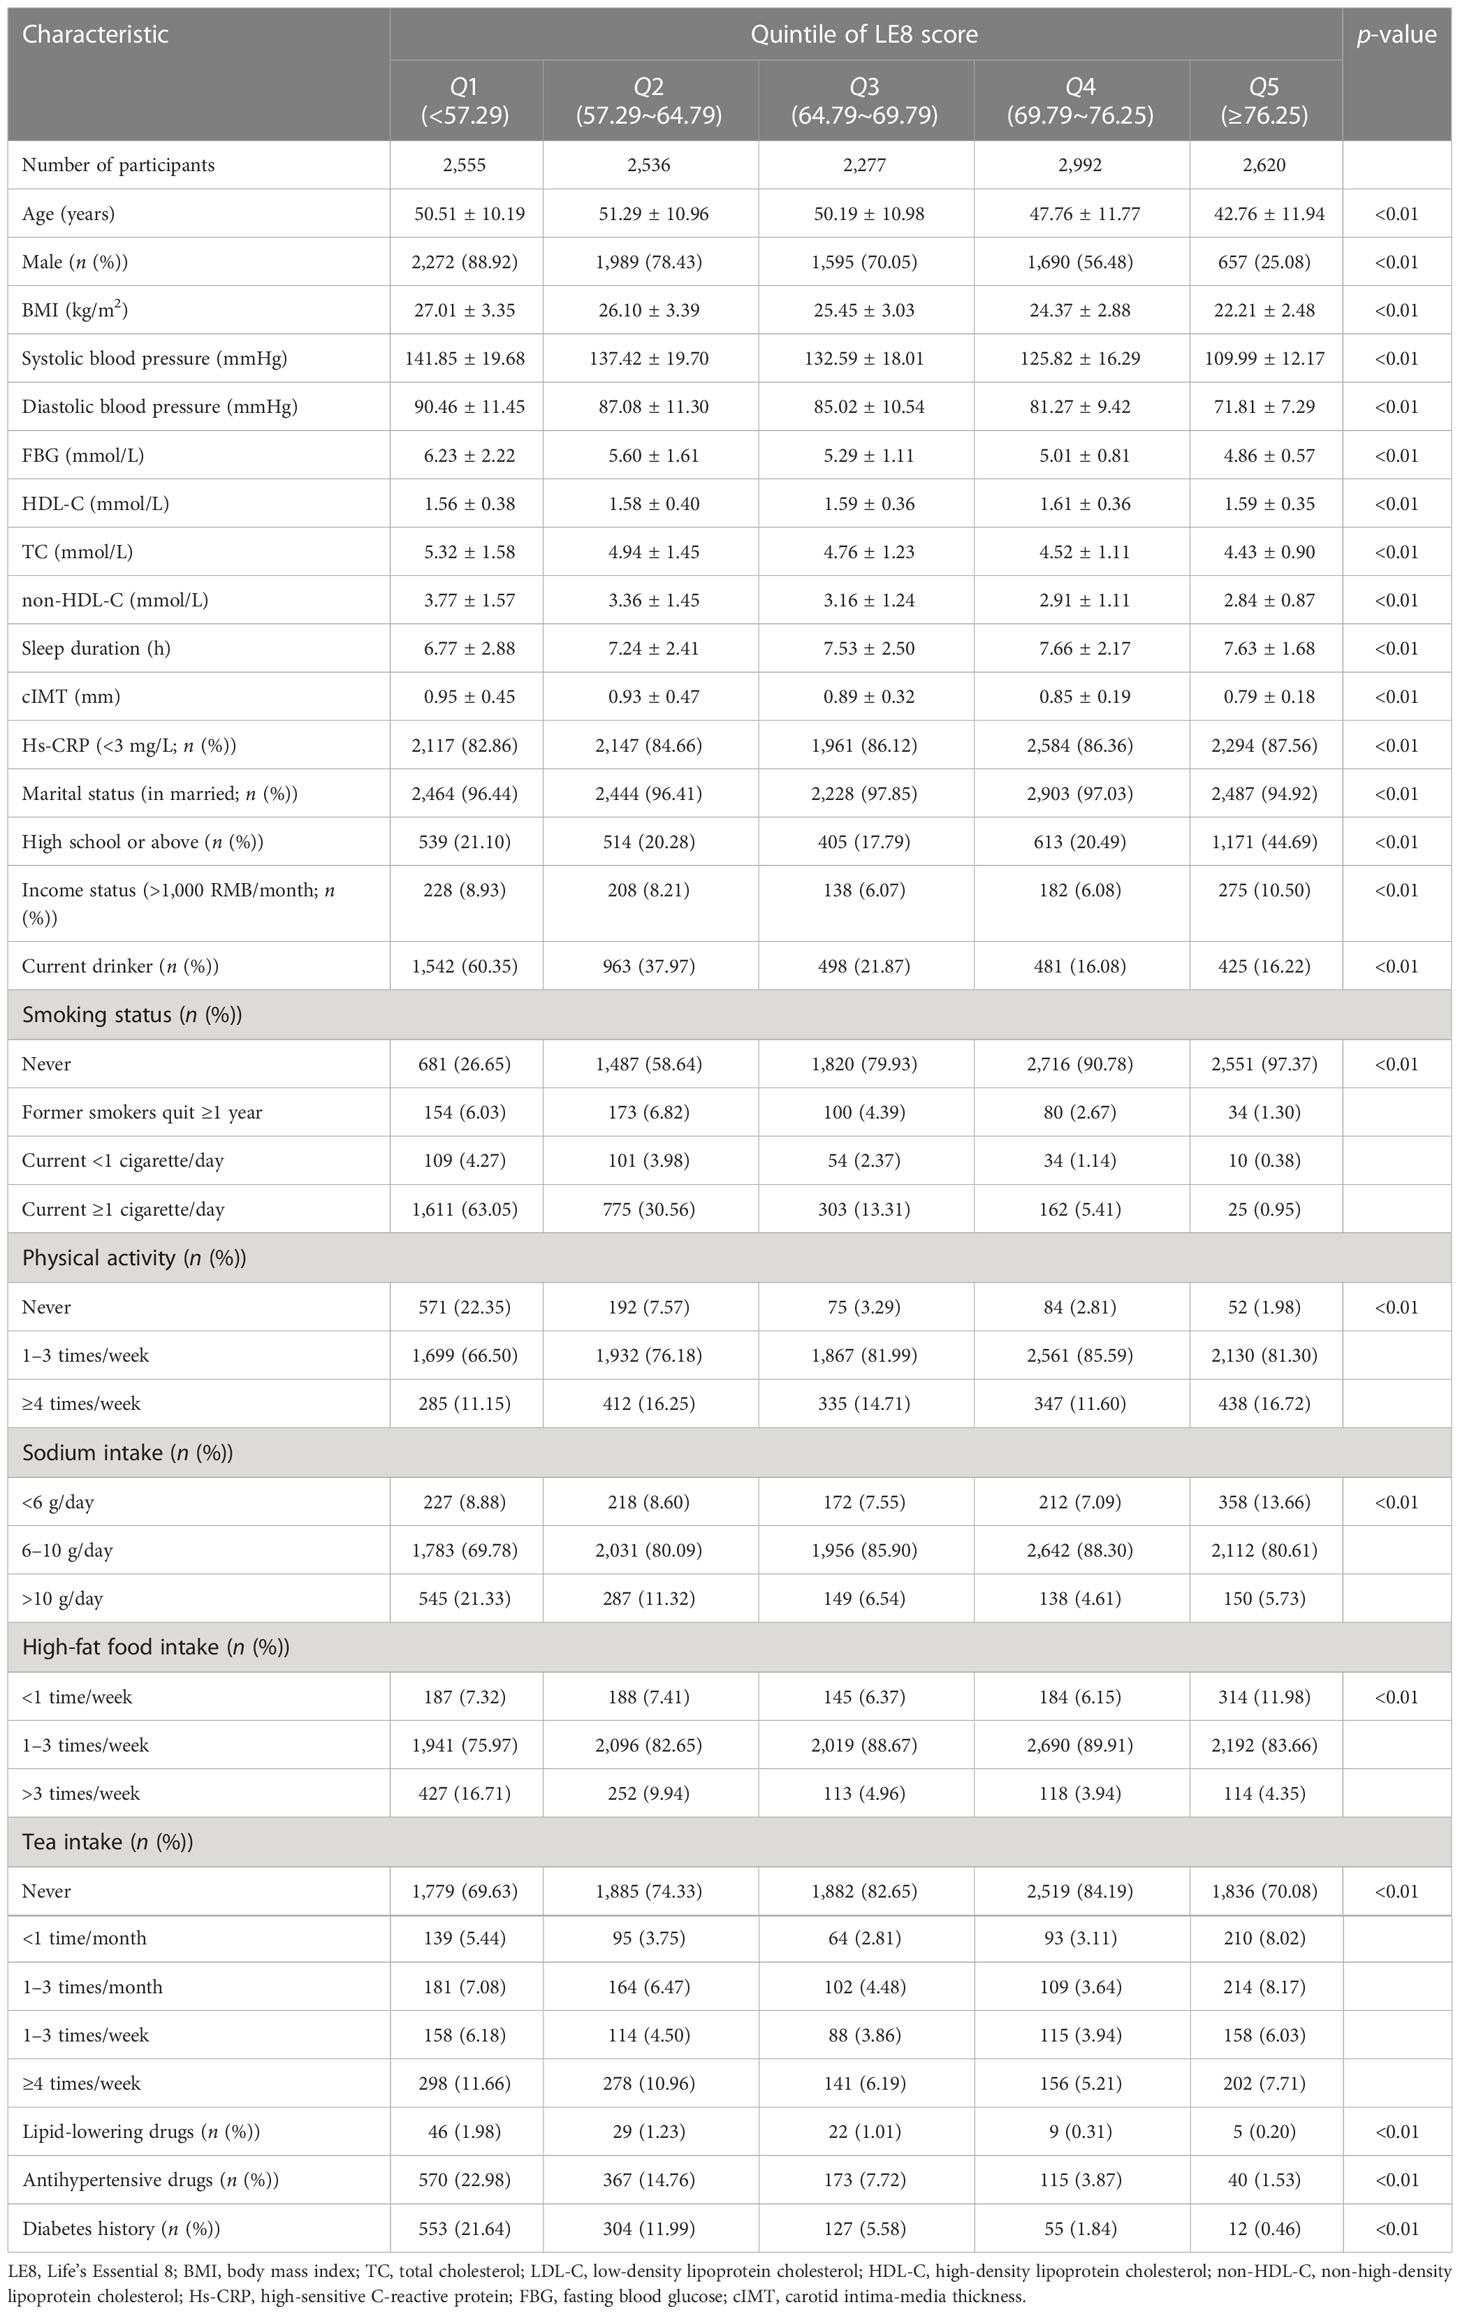
ResultsBaseline characteristicsAmong 12,980 participants examined at baseline, 8,203 (63.20%) were men, and the mean age of the study participants was (48.41 ± 11.63) years. The baseline characteristics of participants according to the quintiles of LE8 score are presented in Table 1. The baseline characteristics of participants according to sex are presented in Supplementary Table S3 (Additional file 1). There is an increasing trend of the percentage with high school or above and greater than 1,000 RMB/month and a decreasing trend of the age, cIMT, and percentage with current drinkers from the Q1 to Q5 group. Analysis of aim 2 included 8,758 participants who met the inclusion criteria. We identified four different trajectories, including high-stable group (1,903 [21.73%]), median-stable group (3,249 [37.10%]), low-stable group (2,944 [33.61%]), and very low-stable group (662 [7.56%]). There is an increasing trend in the percentage of high school or above and a decreasing trend in the percentage of current drinkers from the very low-stable group to the high-stable group [Supplementary Table S4 (Additional file 1)].
Table 1 Baseline characteristics of participants according to the quintiles of LE8 score in 2006.
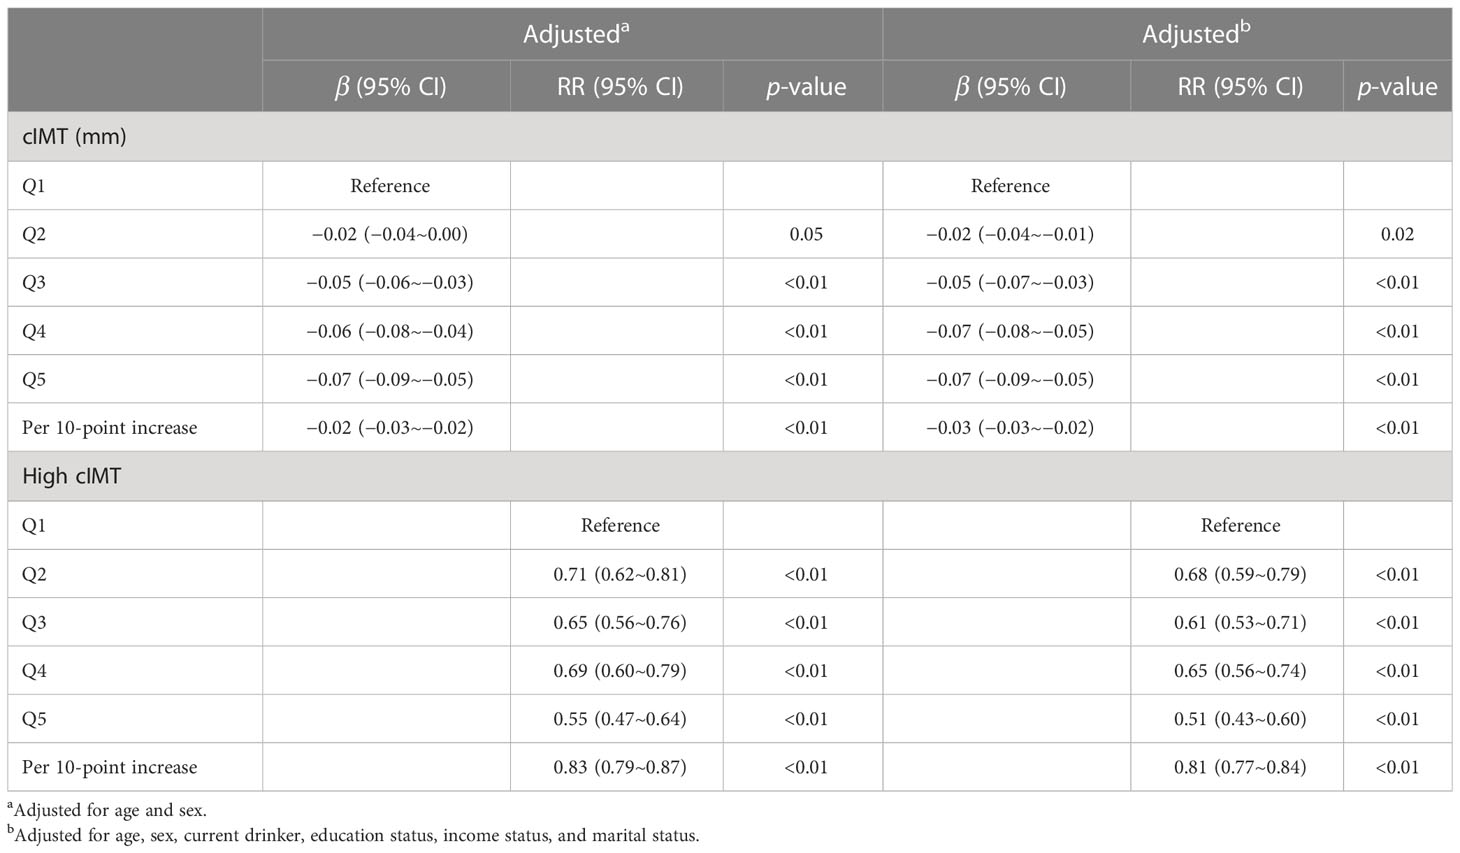
Association between baseline LE8 score with continuous cIMT/high cIMTThe quintiles of LE8 score were associated with continuous cIMT and high cIMT (Table 2). After adjustment for age, sex, current drinker, education status, income status, and marital status, compared with Q1 group, the cIMT for Q2, Q3, Q4, and Q5 groups were thinner (−0.02 mm [95% CI −0.04~−0.01 mm], −0.05 mm [95% CI −0.07~−0.03 mm], −0.07 mm [95% CI −0.08~−0.05 mm], −0.07 mm [95% CI −0.09~−0.05 mm]). Compared with the Q1 group, the other groups had a lower risk of high cIMT; the RR (95% CI) for high cIMT was 0.68 (0.59~0.79) in the Q2 group, 0.61 (0.53~0.71) in the Q3 group, 0.65 (0.56~0.74) in the Q4 group, and 0.51 (0.43~0.60) in the Q5 group.
Table 2 Association between baseline LE8 score with continuous cIMT/high cIMT.
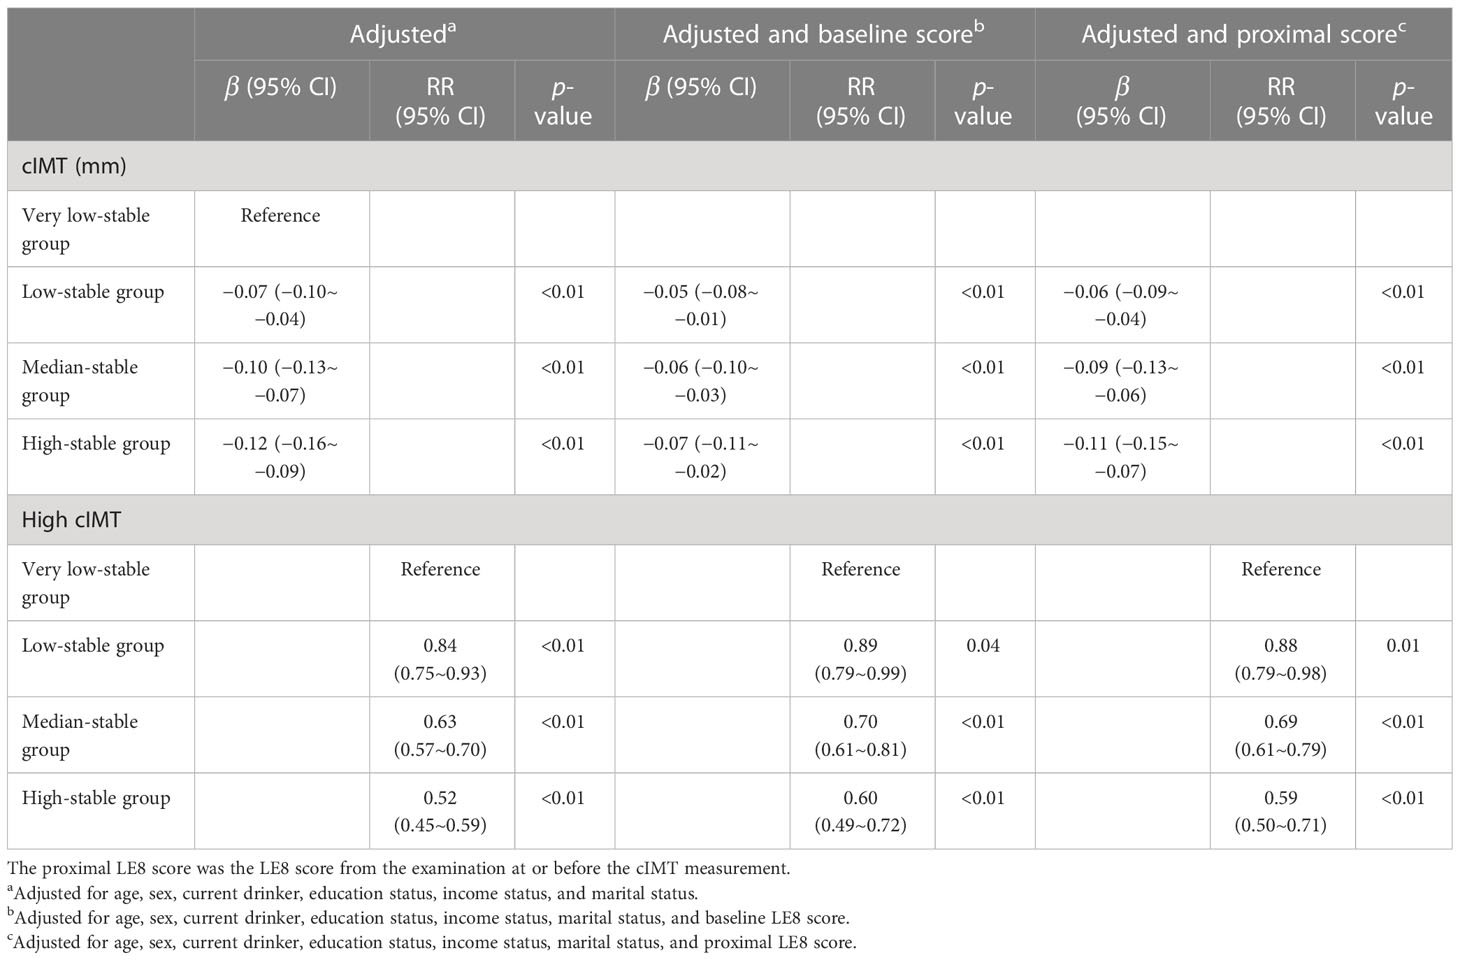
Association between LE8 score trajectories with continuous cIMT/high cIMTThe LE8 score trajectories were also associated with continuous cIMT and high cIMT (Table 3). After adjustment for age, sex, current drinker, education status, income status, and marital status, compared with a very low-stable group, the cIMT for a low-stable group, median-stable group, and high-stable group were thinner (−0.07 mm [95% CI −0.10~−0.04 mm], −0.10 mm [95% CI −0.13~−0.07 mm], −0.12 mm [95% CI −0.16~−0.09mm]). Compared with the very low-stable group, the other groups had a lower risk of high cIMT; the RR (95% CI) for high cIMT was 0.84 (0.75~0.93) in the low-stable group, 0.63 (0.57~0.70) in the median-stable group, and 0.52 (0.45~0.59) in the high-stable group. These patterns remained consistent even after adjustment for the baseline or proximal LE8 score.
Table 3 Association between LE8 score trajectory groups with continuous cIMT/high cIMT.
Sensitivity analysisSupplementary Tables S5, S6 (Additional file 1) show the results of sensitivity analysis. The baseline quintiles of LE8 score were significantly associated with continuous cIMT/high cIMT among male and female participants, participants without hypertension, participants without diabetes, participants without lipid-lowering drugs/antihypertensive drugs/hypoglycemic drugs, and participants in junior high school or below. We found similar results in the analysis of the association between LE8 score trajectories with continuous cIMT/high cIMT, except for female participants.
DiscussionA significant finding of this study was that a high baseline LE8 score and keeping a high LE8 score were associated with lower continuous cIMT and attenuated risk of high cIMT in the study. Furthermore, the association between LE8 score trajectories and continuous cIMT/risk of high cIMT was found to be independent of baseline or proximal LE8 scores.
Since LS7 was proposed in 2010, the LS7 score has been widely used to measure CVH, and numerous studies have found that it is associated with decreased risk of cIMT, hypertension, CVD, and other related conditions. At present, there remains a lack of studies that have looked into the association between LE8 score and continuous cIMT/high cIMT since the new conception was first introduced. It is worth noting that our findings measured by new LE8 metrics were consistent with the results measured by the old LS7 metrics. The H3Africa AWI-Gen study, including 9,011 apparently healthy sub-Saharan African populations with a mean age of 51 years, demonstrated that poor CVH was associated with subclinical atherosclerosis measured by cIMT (25). Another study, consisting of 1,285 adults with a mean age of 29.7 years, found that ideal CVH metrics were related to positive CVH and a higher CVH score was associated with decreased cIMT (8). While there is a strong correlation between LS7 and LE8, LE8 has redefined and updated the components of LS7 to better address individual differences and changes. Due to the role of sleep health in cardiometabolic health and health outcomes, sleep health was added as a new component of LE8 (26, 27).
Furthermore, since the components of the LE8 metrics dynamic varied with time and environment, relying solely on the observation of the LE8 score has its limitations. Utilizing LE8 score trajectories to describe longitudinal changes can provide a more stable outcome. Our findings demonstrated that higher quartile groups of LE8 score trajectories led to a lower risk of high cIMT or continuous cIMT. This association was found to be independent of the baseline or proximal LE8 score. The previous studies about the association between LS7 trajectories and continuous cIMT/high cIMT were in keeping with this study’s results. A study including participants from five prospective cohorts indicated clinical CVH score trajectories were significantly associated with the level of subclinical atherosclerosis in middle adults, and independent of CVH at baseline and the time of cIMT measurement (28). Therefore, it is crucial for us to utilize appropriate preventive measures to maintain the long-term ideal status of each component of CVH to prevent and delay the progression of cIMT. By implementing lifestyle intervention and preventing risk factors, CVD could be prevented.
In a sensitivity analysis including non-hypertensive participants, a diminished reduction in cIMT was observed in participants with high baseline LE8 scores and LE8 score trajectories. Therefore, it is essential to maintain other components of LE8 metrics at an ideal level, even if blood pressure levels are well maintained. Additionally, we found that the association between the LE8 score and cIMT was stronger in participants in junior high school or below. The results suggest that participants with lower education levels may have poorer lifestyles, resulting in lower LE8 scores than those with higher education levels (29). This implies that individuals with low education levels could potentially benefit more from maintaining great CVH than those with higher education.
There are mounting studies showing that cumulative risk factors are associated with the risk of CVD. Even if blood pressure is controlled within the normal range, individuals with taking antihypertensive drugs have a higher risk of CVD compared with those not taking antihypertensive drugs. It is significant for individuals with risk factors to be treated; aggressively intervening in the progression of CVD risk factors may be an effective measurement to reduce the burden of CVD. Individuals could maintain an ideal CVH through timely and effective interventions and prevent incidents and the development of CVD. This is also supported by our study.
The strengths of the present study included the assessment of CVH using updated and enhanced LE8 metrics and the collection of multiple measurement data. Additionally, we described the longitudinal pattern of the LE8 score with trajectories and represented changes trends in the LE8 score. Nevertheless, there are certain limitations in this study. First of all, this study is a cross-sectional study, which cannot verify causality. Secondly, we did not observe the cIMT progression because we used only one data from the ultrasound scan. Thirdly, the participants in our study were all from the Kailuan study, and the findings have not been validated in other populations. Finally, taking drugs, education differences, hypertension, and diabetes may have some impact on results, but consistent results were obtained by sensitivity analysis.
ConclusionsOur findings from our study suggested that the great CVH defined by the new LE8 metric at baseline and trajectories is associated with lower continuous cIMT and an attenuated risk of high cIMT. These findings suggested early aggressive intervention and maintaining high levels of CVH may be helpful in lowering cIMT.
Data availability statementThe raw data supporting the conclusions of this article will be made available by the authors, without undue reservation.
Ethics statementThis study was approved by the Ethics Committee of Kailuan General Hospital. All participants signed an informed consent form.
Author contributionsQL, HC, SW, and WH designed this research. QL and HC conducted research. SC and DZ provided and monitored databases. QL, HC, and SC performed the statistical analysis. QL and HC wrote the manuscript. QL, HC, SC, DZ, SW, and WH made critical revisions to the manuscript. SW and WH had primary responsibility for the final content. All authors contributed to the article and approved the submitted version.
AcknowledgmentsThe authors thank all the members of the Kailuan study team for their contributions and the participants who contributed their data.
Conflict of interestThe authors declare that the research was conducted in the absence of any commercial or financial relationships that could be construed as a potential conflict of interest.
Publisher’s noteAll claims expressed in this article are solely those of the authors and do not necessarily represent those of their affiliated organizations, or those of the publisher, the editors and the reviewers. Any product that may be evaluated in this article, or claim that may be made by its manufacturer, is not guaranteed or endorsed by the publisher.
Supplementary materialThe Supplementary Material for this article can be found online at: https://www.frontiersin.org/articles/10.3389/fendo.2023.1186880/full#supplementary-material
AbbreviationsCVH, cardiovascular health; LS7, Life’s Simple 7; LE8, Life’s Essential 8; cIMT, carotid intima-media thickness; RR, relative risk; CI, confidence intervals; AHA, the American Heart Association; CVD, cardiovascular disease; TC, total cholesterol; LDL-C, low-density lipoprotein cholesterol; HDL-C, high-density lipoprotein cholesterol; Hs-CRP, high sensitive C-reactive protein; FBG, fasting blood glucose; BMI, body mass index; SD, standard deviation.
References1. Lloyd-Jones DM, Hong Y, Labarthe D, Mozaffarian D, Appel LJ, Van Horn L, et al. Defining and setting national goals for cardiovascular health promotion and disease reduction: the American heart association's strategic impact goal through 2020 and beyond. Circulation (2010) 121(4):586–613. doi: 10.1161/CIRCULATIONAHA.109.192703
PubMed Abstract | CrossRef Full Text | Google Scholar
2. Lloyd-Jones DM, Allen NB, Anderson CAM, Black T, Brewer LC, Foraker RE, et al. Life's essential 8: updating and enhancing the American heart association's construct of cardiovascular health: a Presidential advisory from the American heart association. Circulation (2022) 146(5):e18–43. doi: 10.1161/CIR.0000000000001078
PubMed Abstract | CrossRef Full Text | Google Scholar
3. Booth JN 3rd, Abdalla M, Tanner RM, Diaz KM, Bromfield SG, Tajeu GS, et al. Cardiovascular health and incident hypertension in blacks: JHS (The Jackson heart study). Hypertension (2017) 70(2):285–92. doi: 10.1161/HYPERTENSIONAHA.117.09278
PubMed Abstract | CrossRef Full Text | Google Scholar
4. Wang L, Song L, Li D, Zhou Z, Chen S, Yang Y, et al. Ideal cardiovascular health metric and its change with lifetime risk of cardiovascular diseases: a prospective cohort study. J Am Heart Assoc (2021) 10(22):e022502. doi: 10.1161/JAHA.121.022502
PubMed Abstract | CrossRef Full Text | Google Scholar
5. Laitinen TT, Pahkala K, Magnussen CG, Oikonen M, Viikari JS, Sabin MA, et al. Lifetime measures of ideal cardiovascular health and their association with subclinical atherosclerosis: the cardiovascular risk in young finns study. Int J Cardiol (2015) 185:186–91. doi: 10.1016/j.ijcard.2015.03.051
PubMed Abstract | CrossRef Full Text | Google Scholar
6. Stein JH, Korcarz CE, Hurst RT, Lonn E, Kendall CB, Mohler ER, et al. Use of carotid ultrasound to identify subclinical vascular disease and evaluate cardiovascular disease risk: a consensus statement from the American society of echocardiography carotid intima-media thickness task force. endorsed by the society for vascular medicine. J Am Soc Echocardiogr (2008) 21(2):93–111. doi: 10.1016/j.echo.2007.11.011
PubMed Abstract | CrossRef Full Text | Google Scholar
7. Oikonen M, Laitinen TT, Magnussen CG, Steinberger J, Sinaiko AR, Dwyer T, et al. Ideal cardiovascular health in young adult populations from the united states, Finland, and Australia and its association with cIMT: the international childhood cardiovascular cohort consortium. J Am Heart Assoc (2013) 2(3):e000244. doi: 10.1161/JAHA.113.000244
PubMed Abstract | CrossRef Full Text | Google Scholar
8. Chavoshi V, Barzin M, Ebadinejad A, Dehghan P, Momeni Moghaddam A, Mahdavi M, et al. Association of ideal cardiovascular health with carotid intima-media thickness (cIMT) in a young adult population. Sci Rep (2022) 12(1):10056. doi: 10.1038/s41598-022-13994-5
PubMed Abstract | CrossRef Full Text | Google Scholar
9. Wu S, Huang Z, Yang X, Zhou Y, Wang A, Chen L, et al. Prevalence of ideal cardiovascular health and its relationship with the 4-year cardiovascular events in a northern Chinese industrial city. Circ Cardiovasc Qual Outcomes (2012) 5(4):487–93. doi: 10.1161/CIRCOUTCOMES.111.963694
PubMed Abstract | CrossRef Full Text | Google Scholar
10. Zheng X, Zhang R, Liu X, Zhao H, Liu H, Gao J, et al. Association between cumulative exposure to ideal cardiovascular health and arterial stiffness. Atherosclerosis (2017) 260:56–62. doi: 10.1016/j.atherosclerosis.2017.03.018
PubMed Abstract | CrossRef Full Text | Google Scholar
11. Wang A, Huang X, Liu X, Su Z, Wu J, Chen S, et al. No association between high-sensitivity c-reactive protein and carotid intima-media progression: the APAC study. J Stroke Cerebrovasc Dis (2017) 26(2):252–9. doi: 10.1016/j.jstrokecerebrovasdis.2016.09.013
PubMed Abstract | CrossRef Full Text | Google Scholar
12. Wu S, An S, Li W, Lichtenstein AH, Gao J, Kris-Etherton PM, et al. Association of trajectory of cardiovascular health score and incident cardiovascular disease. JAMA Netw Open (2019) 2(5):e194758. doi: 10.1001/jamanetworkopen.2019.4758
PubMed Abstract | CrossRef Full Text | Google Scholar
13. Jin C, Chen S, Vaidya A, Wu Y, Wu Z, Hu FB, et al. Longitudinal change in fasting blood glucose and myocardial infarction risk in a population without diabetes. Diabetes Care (2017) 40(11):1565–72. doi: 10.2337/dc17-0610
PubMed Abstract | CrossRef Full Text | Google Scholar
14. Li Y, Huang Z, Jin C, Xing A, Liu Y, Huangfu C, et al. Longitudinal change of perceived salt intake and stroke risk in a Chinese population. Stroke (2018) 49(6):1332–9. doi: 10.1161/STROKEAHA.117.020277
PubMed Abstract | CrossRef Full Text | Google Scholar
15. Zhang Q, Zhou Y, Gao X, Wang C, Zhang S, Wang A, et al. Ideal cardiovascular health metrics and the risks of ischemic and intracerebral hemorrhagic stroke. Stroke (2013) 44(9):2451–6. doi: 10.1161/STROKEAHA.113.678839
PubMed Abstract | CrossRef Full Text | Google Scholar
16. Huang S, Li J, Wu Y, Ranjbar S, Xing A, Zhao H, et al. Tea consumption and longitudinal change in high-density lipoprotein cholesterol concentration in Chinese adults. J Am Heart Assoc (2018) 7(13):e008814. doi: 10.1161/JAHA.118.008814
PubMed Abstract | CrossRef Full Text | Google Scholar
17. Wang X, Liu F, Li J, Yang X, Chen J, Cao J, et al. Tea consumption and the risk of atherosclerotic cardiovascular disease and all-cause mortality: the China-PAR project. Eur J Prev Cardiol (2020) 27(18):1956–63. doi: 10.1177/2047487319894685
PubMed Abstract | CrossRef Full Text | Google Scholar
18. Nathan DM, Kuenen J, Borg R, Zheng H, Schoenfeld D, Heine RJ. A1c-derived average glucose study group. translating the A1C assay into estimated average glucose values. Diabetes Care (2008) 31(8):1473–8. doi: 10.2337/dc08-0545
PubMed Abstract | CrossRef Full Text | Google Scholar
19. Huang S, Li J, Shearer GC, Lichtenstein AH, Zheng X, Wu Y, et al. Longitudinal study of alcohol consumption and HDL concentrations: a community-based study. Am J Clin Nutr (2017) 105(4):905–12. doi: 10.3945/ajcn.116.144832
PubMed Abstract | CrossRef Full Text | Google Scholar
20. Zhang X, Wu Y, Na M, Lichtenstein AH, Xing A, Chen S, et al. Habitual night eating was positively associated with progress of arterial stiffness in Chinese adults. J Am Heart Assoc (2020) 9(19):e016455. doi: 10.1161/JAHA.120.016455
PubMed Abstract | CrossRef Full Text | Google Scholar
21. Zhou Y, Wang D, Yang X, Wang A, Gao X, Guo Y, et al.. Effect of menopausal status on carotid intima-media thickness and presence of carotid plaque in Chinese women generation population. Sci Rep (2015) 5:8076. doi: 10.1038/srep08076
PubMed Abstract | CrossRef Full Text | Google Scholar
22. Touboul PJ, Hennerici MG, Meairs S, Adams H, Amarenco P, Bornstein N, et al. Mannheim Carotid intima-media thickness and plaque consensus (2004-2006-2011). an update on behalf of the advisory board of the 3rd, 4th and 5th watching the risk symposia, at the 13th, 15th and 20th European stroke conferences, Mannheim, Germany, 2004, Brussels, Belgium, 2006, and Hamburg, Germany, 2011. Cerebrovasc Dis (2012) 34(4):290–6. doi: 10.1159/000343145
PubMed Abstract | CrossRef Full Text | Google Scholar
23. Magnussen CG, Venn A, Thomson R, Juonala M, Srinivasan SR, Viikari JS, et al. The association of pediatric low- and high-density lipoprotein cholesterol dyslipidemia classifications and change in dyslipidemia status with carotid intima-media thickness in adulthood evidence from the cardiovascular risk in young finns study, the bogalusa heart study, and the CDAH (Childhood determinants of adult health) study. J Am Coll Cardiol (2009) 53(10):860–9. doi: 10.1016/j.jacc.2008.09.061
PubMed Abstract | CrossRef Full Text | Google Scholar
24. Chen S, Li W, Jin C, Vaidya A, Gao J, Yang H, et al. Resting heart rate trajectory pattern predicts arterial stiffness in a community-based Chinese cohort. Arterioscler Thromb Vasc Biol (2017) 37(2):359–64. doi: 10.1161/ATVBAHA.116.308674
PubMed Abstract | CrossRef Full Text | Google Scholar
25. Nonterah EA, Crowther NJ, Oduro A, Agongo G, Micklesfield LK, Boua PR, et al. Poor cardiovascular health is associated with subclinical atherosclerosis in apparently healthy sub-Saharan African populations: an H3Africa AWI-gen study. BMC Med (2021) 19(1):30. doi: 10.1186/s12916-021-01909-6
PubMed Abstract | CrossRef Full Text | Google Scholar
26. Tubbs AS, Ghani SB, Valencia D, Jean-Louis G, Killgore WDS, Fernandez F-X, et al. Racial/ethnic minorities have greater declines in sleep duration with higher risk of cardiometabolic disease: an analysis of the U.S. national health interview survey. Sleep Epidemiol (2022) 2:100022. doi: 10.1016/j.sleepe.2022.100022
CrossRef Full Text | Google Scholar
27. Huang BH, Duncan MJ, Cistulli PA, Nassar N, Hamer M, Stamatakis E. Sleep and physical activity in relation to all-cause, cardiovascular disease and cancer mortality risk. Br J Sports Med (2022) 56(13):718–24. doi: 10.1136/bjsports-2021-104046
PubMed Abstract | CrossRef Full Text | Google Scholar
28. Allen NB, Krefman AE, Labarthe D, Greenland P, Juonala M, Kähönen M, et al. Cardiovascular health trajectories from childhood through middle age and their association with subclinical atherosclerosis. JAMA Cardiol (2020) 5(5):557–66. doi: 10.1001/jamacardio.2020.0140
PubMed Abstract | CrossRef Full Text | Google Scholar
29. Janković S, Stojisavljević D, Janković J, Erić M, Marinković J. Association of socioeconomic status measured by education, and cardiovascular health: a population-based cross-sectional study. BMJ Open (2014) 4(7):e005222. doi: 10.1136/bmjopen-2014-005222
留言 (0)