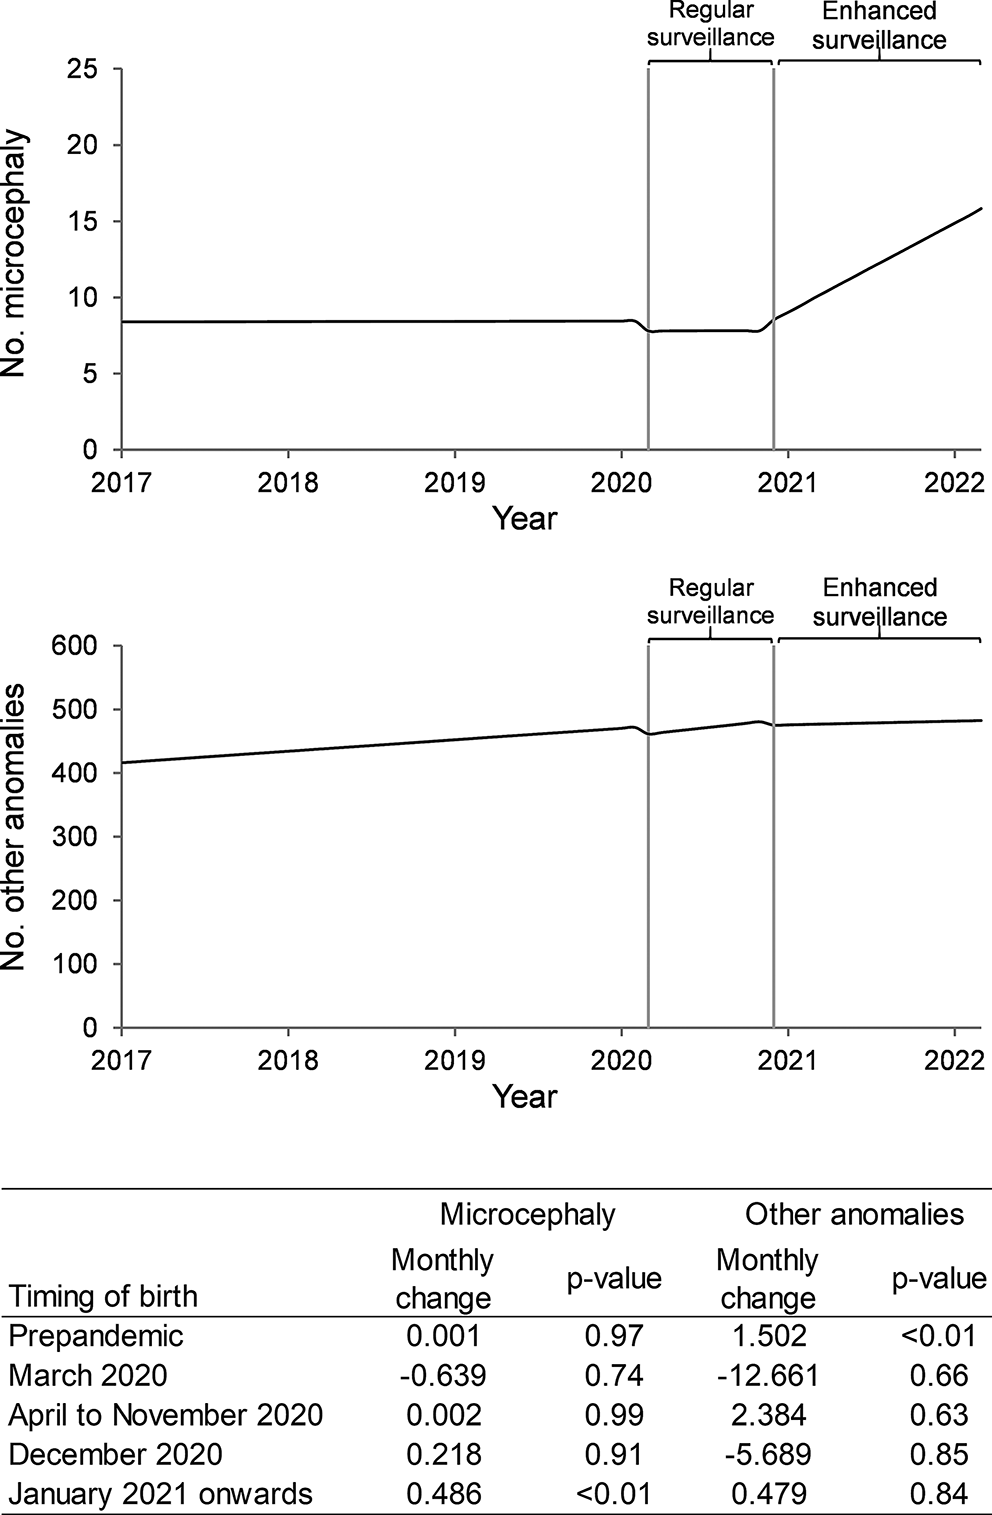
Study design
The UK Biobank is a large prospective study of 502,648 adults, aged 40–69, recruited from across the United Kingdom between 2006 and 2010. Details of the cohort, including recruitment, assessment procedures, and quality control have been described in detail elsewhere [9, 10]. The UK Biobank received ethical approval from the National Health Service North West Multi-centre Research Ethics Committee (Research Ethics Committee reference: 11/NW/0382) and all participants provided written, informed consent. For each exposure under study, we restricted the eligible population to individuals with complete data on that exposure, the outcome of coronary artery disease, and that exposure’s proposed genetic instruments, resulting in sample sizes between 424,978 and 486,195 individuals (see Supplementary Information: S4). While this complete case analysis may result in selection bias [11], it is consistent with some common approaches used in MR studies within the UK Biobank.
Exposures
We selected 6 exposures whose relationships to cardiovascular disease have been previously studied using MR: vitamin D concentration, alcohol consumption, CRP, triglycerides, HDL-cholesterol, and LDL-cholesterol [12,13,14,15,16,17,18,19,20,21,22,23,24,25,26,27].
Vitamin D, triglyceride, CRP, HDL-, and LDL-cholesterol levels were measured in blood samples collected at either the initial assessment visit or a repeat assessment visit conducted between 2012 and 2013. Details of biomarker measurements and assay performance in UK Biobank have been described in detail elsewhere [28]. Briefly, vitamin D concentration was assessed based on total 25-hydroxyvitamin D (25(OH)D) levels measured using the Diasorin Liason, a chemiluminescent immunoassay. CRP levels were measured using an immunoturbidimetric assay in a Beckman Coulter analyzer (AU5800 Analyzer, Beckman Coulter, CA). Triglyceride concentrations were measured using an enzymatic analysis on said Beckman Coulter analyzer. HDL-cholesterol levels were measured by enzyme inhibition analysis, and LDL-cholesterol levels were measured using enzymatic protective selection analysis on said Beckman Coulter analyzer. Because the instrumental inequalities can only be used with categorical exposures [4, 5], all these exposures were categorized into deciles. Frequency of alcohol consumption was assessed based on self-report questionnaire. Participants were asked “About how often do you drink alcohol?” with response options “Never”, “Special occasions only”, “1 to 3 times a month”, “Once or twice a week”, “3 to 4 times a week”, or “Daily or almost daily”. If participants felt the answer varied, they were instructed to give an average over the past year. This exposure was categorized using these response categories.
Outcome
Participant electronic health records, including International Classification of Disease (ICD-10) diagnosis codes and Office of Population and Censuses Surveys (OPCS-4) procedure codes, have been integrated into UK Biobank [29]. Additionally, patients were asked to report diagnoses of cardiovascular disease using questionnaires, which were subsequently checked during a verbal interview with a trained nurse. Participants were considered to have coronary artery disease if they had experienced angina pectoris, acute or subsequent myocardial infarction or other acute or chronic ischemic heart disease (ICD-10 I20X, I21X, I123X, I24X, I25.5, I25.6, I25.8, I25.9) or if they previously underwent coronary procedure (OPCS-4 K40, K41, K43, K46, K49, K75, K45, K50.1-3) (see Supplementary Information: S2 and S3).
Genetic variants
In order to identify genetic variants that had previously been used in MR studies of these specific exposures within the UK Biobank, we conducted a systematic review of PubMed and the UK Biobank archive using the search term “Mendelian random*”, and each of the six exposures. Studies were eligible for inclusion in the review if they explicitly reported using an MR approach, studied either vitamin D, alcohol use, triglyceride levels, CRP, LDL-, or HDL-cholesterol as an exposure, and conducted the analysis using a UK Biobank sample. This resulted in 30 articles, of which 12 were rejected based on full text review. After review, 9 articles on vitamin D concentration, 3 articles on alcohol use, 2 articles on CRP, and 4 articles on lipoproteins (LDL-cholesterol, HDL-cholesterol, or triglycerides) met the criteria and were included in the review (see Supplementary Information: S1).
From these articles, we proposed single nucleotide polymorphisms (SNPs) as instruments for one of the six exposures if they had been proposed as instruments in at least one previous study. SNPs were not included if previous studies indicated that they were associated with another phenotype on a possibly pleiotropic pathway. In total, we proposed 1077 SNPs as instruments, including 15 SNPs as instruments for vitamin D concentration, 28 SNPs as instruments for alcohol consumption, 528 SNP as an instrument for CRP, 22 SNPs as instruments for triglyceride levels, 82 SNPs as instruments for HDL-cholesterol, and 402 SNPs as instruments for LDL-cholesterol (see Supplementary Information for an overview of the proposed instruments). We also constructed an unweighted categorical allele score for each exposure.
Analysis
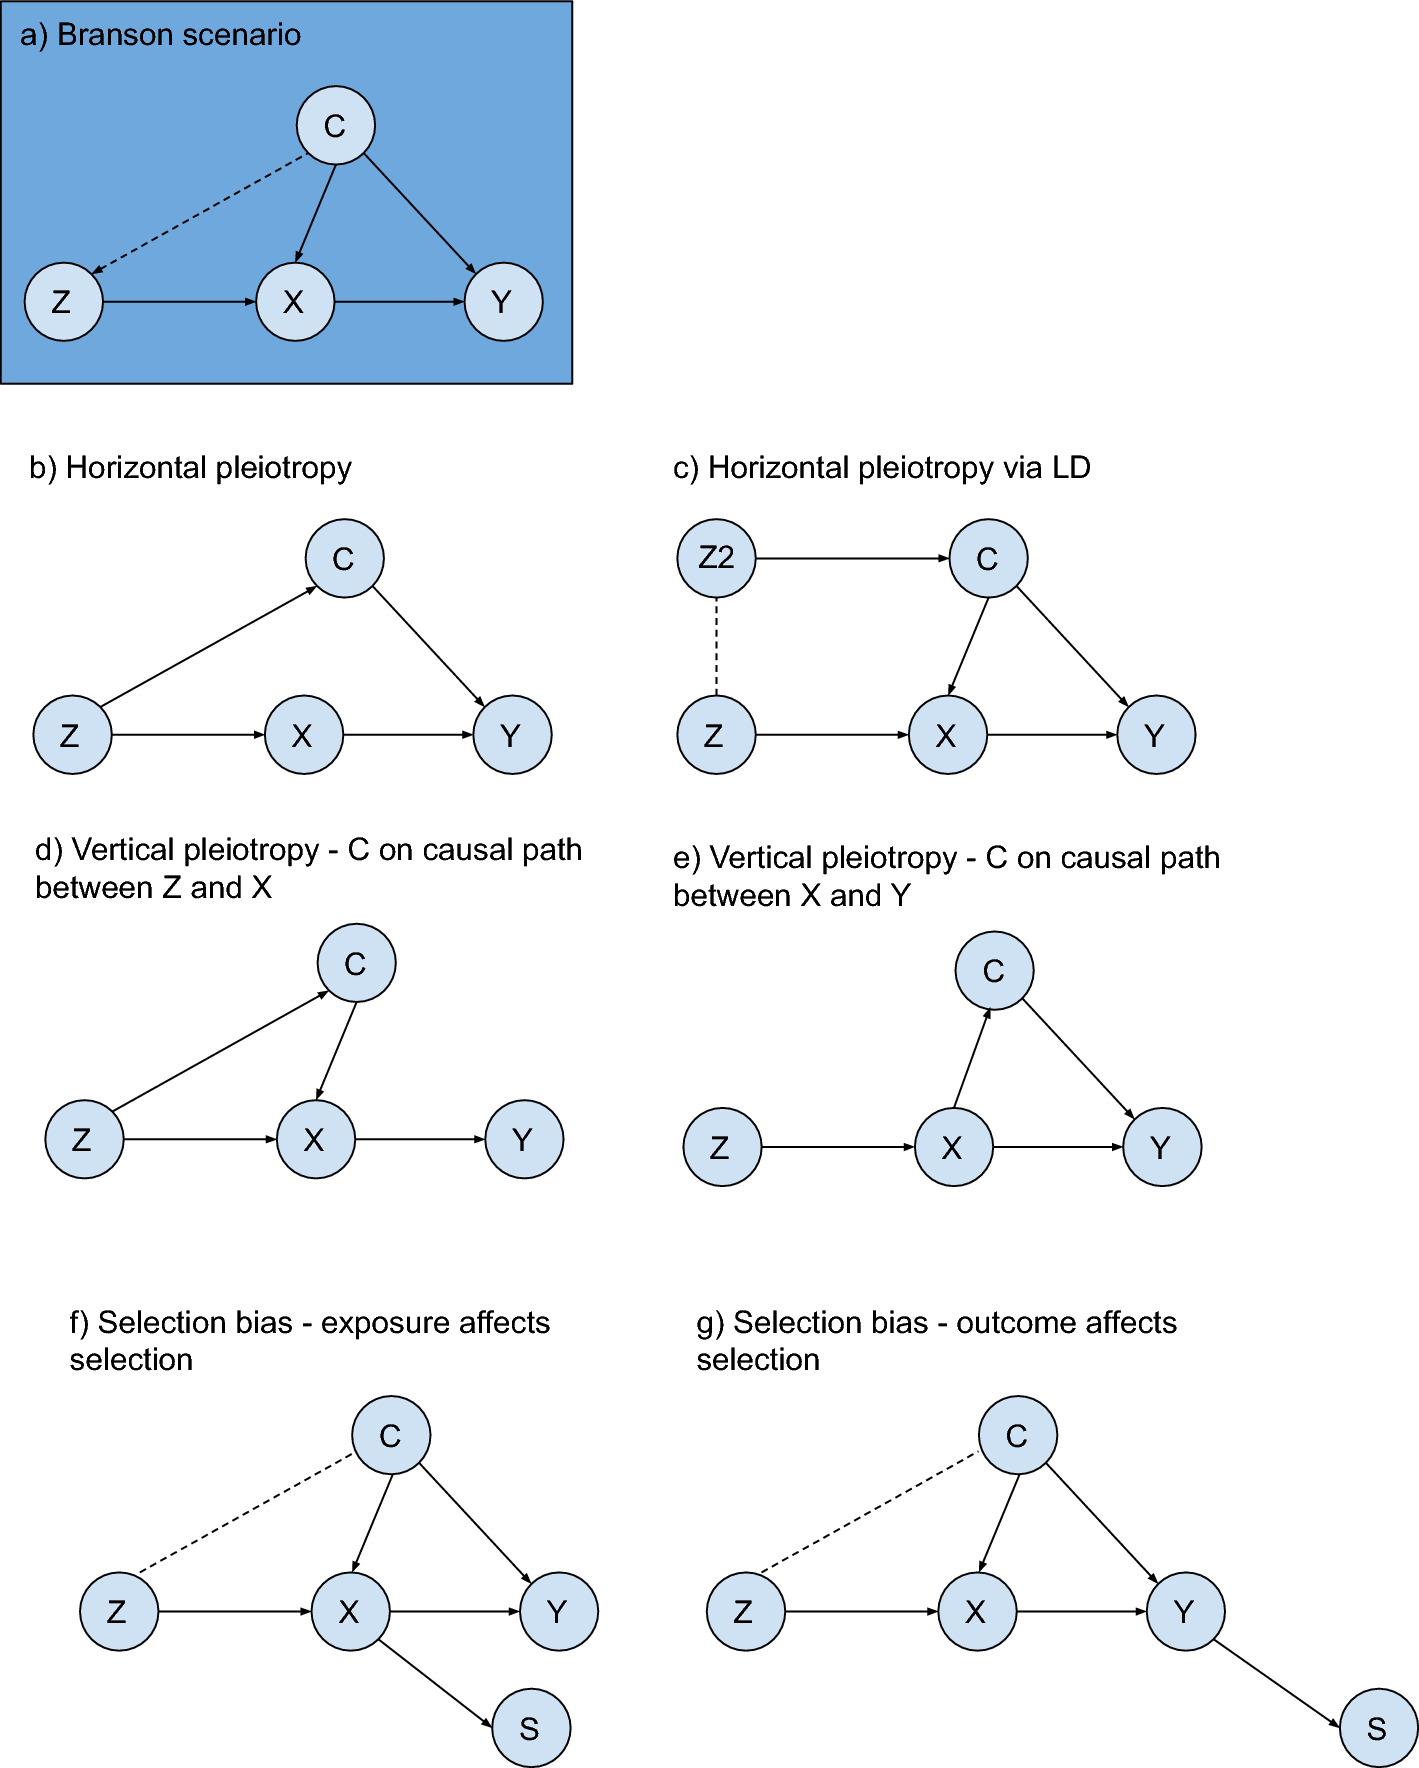
The properties and use of the instrumental inequalities have been described in detail in publications by Pearl, 1995 [4], Glymour et al., 2012 [30] and Diemer et al., 2020 [8]. Intuitively, by using an instrumental variable model, investigators are assuming that the observed data and unobserved counterfactuals from a population follow certain constraints (i.e., a particular ‘shape’). One way for investigators to check whether the instrumental variable assumptions hold would be to check whether the observed data fits within the ‘shape’ assumed by the instrumental variable model. The instrumental inequalities are simply a means of conducting this check, by evaluating whether a particular dataset conforms to these constraints.
More specifically, the instrumental inequalities are a set of mathematical equations derived from the instrumental conditions by Pearl, 1995 [4]:
$$\mathop }}\limits_x \mathop }}\limits_z P\left( \right) \le 1$$
where Z is the proposed instrument (or proposed instrument set), X is the exposure, and Y is the outcome. These equations evaluate whether proportions of certain combinations of the proposed instruments, exposure, and outcome sum to equal or less than one. If one or more of these inequalities do not hold, meaning that the sum of the observed probabilities is greater than one, it implies that at least one of the instrumental conditions is violated within the dataset. However, if the instrumental inequalities do hold, it does not constitute evidence for or against the instrumental conditions. Such a result does not imply that the instrumental conditions are satisfied within the specific dataset, only that we are unable to prove the instrumental conditions are violated in that dataset. Thus, the instrumental inequalities can be used to falsify (but not verify) an MR model. Moreover, the instrumental inequalities cannot show why the instrumental conditions are violated, only that they are violated. For MR studies, such violations can result from a number of different bias structures, including pleiotropy, selection bias, population stratification, and assortative mating [8, 31]. One key limitation of the instrumental inequalities is that they cannot be applied to continuous exposures [5]. While it is computationally easy to resolve this by discretizing the continuous exposures of interest, the instrumental conditions can then be violated by the measurement error induced by this categorization (sometimes known as coarsening) [31]. A simplified example demonstrating the application of the instrumental inequalities and the corresponding R code can be found in the Supplemental Information (see Supplemental Information: S6 and S11).
When multiple SNPs are proposed as instruments in MR, we can also apply the instrumental inequalities to sets of SNPs jointly [8]. For each exposure-outcome combination, we applied the instrumental inequalities to models proposing each SNP as an instrument individually and to a model proposing unweighted allele score deciles as an instrument, using R code developed in Diemer et al., 2020 [8] (see Supplementary Information: S12). As a sensitivity analysis to understand how results are impacted by residual population stratification, we also calculated the instrumental inequalities using inverse probability weights to adjust for 10 principal components (see Supplementary Information: S7). All analyses were conducted in R version 3.2.6 [32].
Comparison to other falsification strategies: MR-Egger and MR-PRESSO
We also compared the results of the instrumental inequalities to the results of a MR-Egger intercept test and a MR Pleiotropy RESidual Sum and Outlier (PRESSO) global test. Both are commonly used falsification strategies in MR [33,34,35]. The MR-Egger method conducts an inverse variance weighted linear regression of the instrument-outcome association on the instrument-exposure association. If a test of the estimated intercept of this regression rejects the null hypothesis that the intercept is zero, then one often concludes that the instrumental conditions do not hold. The MR-PRESSO global test conducts multiple inverse variance weighed regressions to compute a residual sum of squares for each instrument in a set of proposed instruments, omitting one candidate instrument in each computation. It evaluates whether any of the proposed instruments are driving a difference between the total residual sum of squares and the simulated expected residual sum of squares. If the total residual sum of squares is inconsistent with what is expected by chance, the test rejects the null hypothesis of no horizontal pleiotropy; suggesting that the instrumental conditions are violated.
Unlike the instrumental inequalities, the MR-Egger and MR-PRESSO tests do not require us to coarsen continuous exposures. However, in addition to the instrumental conditions, they also evaluate whether linearity and homogeneity assumptions are satisfied [33,34,35,36]. A comparison of these falsification strategies’ assumptions, interpretation, and practical considerations are reviewed in Table 1. To compare the instrumental inequalities to the MR-Egger intercept test and MR-PRESSO, we applied both falsification methods to models proposing SNPs jointly as instruments for vitamin D concentration, alcohol consumption, CRP, triglyceride levels, HDL-cholesterol, and LDL-cholesterol.
Table 1 Overview of key assumptions, interpretations, and practical considerations of the instrumental inequalities, MR-Egger intercept test and MR-PRESSO global test


留言 (0)