
記住我
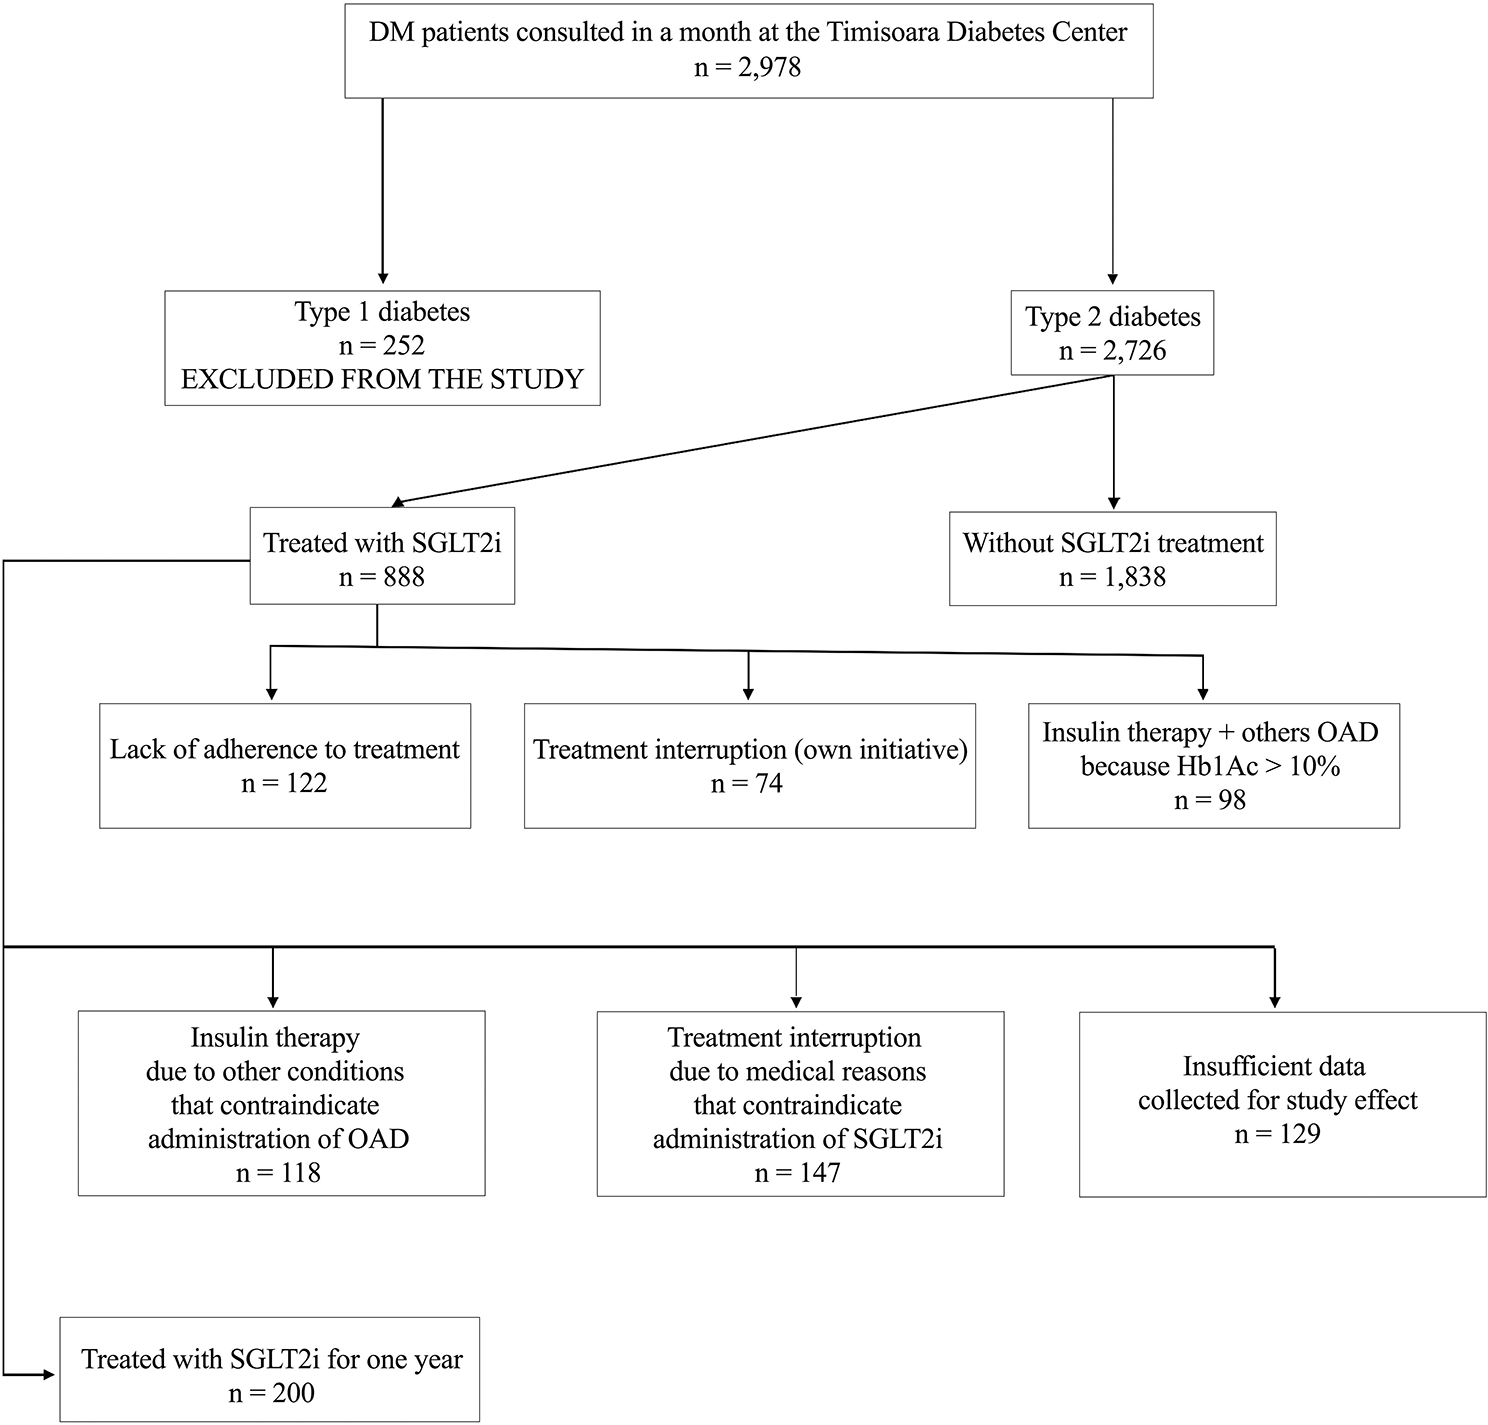
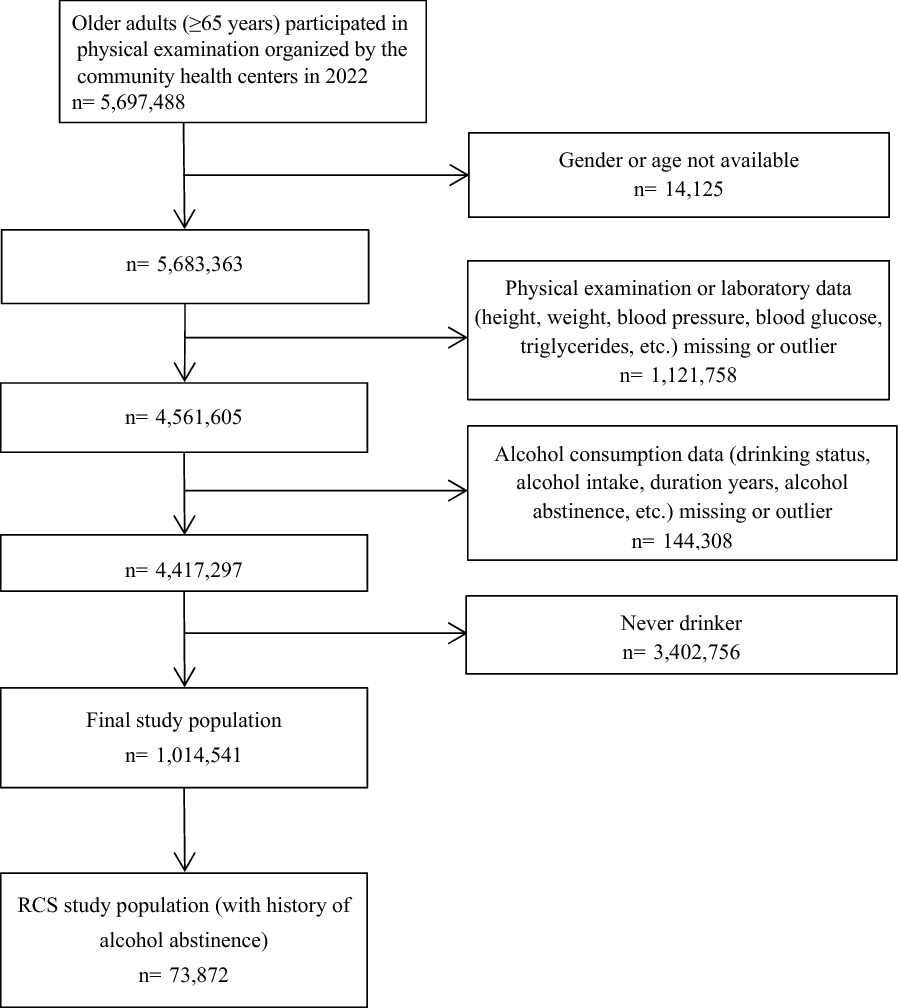
The initial search revealed 331 relevant articles; 203 duplicate articles were excluded, and the remaining 128 were screened based on the title and abstract. After preliminary screening, 25 articles had to be evaluated based on the full text. Finally, 18 RCTs were included. The flow chart of study selection is shown in Fig. 1.
Fig. 1
Among the 18 RCTs (n = 1063 patients), 16 reported VAT [19,20,21,22,23,24,25,26,27,28,29,30,31,32,33,34], 9 reported SAT [20,21,22,23,24, 30, 32,33,34], 3 reported EAT [19, 35, 36], and 5 reported liver fat [19, 23, 24, 31, 34]. Table 1 summarizes data of the main features of the included RCTs. All studies were published during 2017–2022. All participants had a clinical diagnosis of T2DM, and 7 articles assessed participants with NAFLD [23, 24, 28, 29, 31, 33, 34]. The duration of the RCTs ranged from 8 to 48 weeks. Interventions of SGLT-2 inhibitors included dapagliflozin [21, 22, 24, 29, 30, 34, 35], empagliflozin [19, 27, 28, 31, 36], ipragliflozin [20, 23, 25, 32, 33] and canagliflozin [26]. Nine RCTs compared SGLT-2 inhibitors with placebo and 9 studies compared the inhibitors with other antidiabetic drugs, namely, sitagliptin, semaglutide, pioglitazone, glimepiride, or metformin.
Table 1 Characteristics of included RCTsRisk of bias in included studiesFigure 2 show the quality assessment of the included studies. In most trials, computer-generated random numbers were used for random assignment, and all trials evaluated the study results in a blinded manner. Because of the lack of blinding among the participants and examining personnel, many studies were rated as having medium risk. Other sources of bias included individual studies unclear methods on allocation concealment and reports with incomplete outcome data.
Fig. 2
Methodological quality graph. A Methodological quality graph; B methodological quality summary
Meta-analysisEfficacy of SGLT-2 inhibitors on VAT reductionA total of 16 RCTs involving 937 participants estimated VAT. Compared with the control group, VAT was significantly lower in the SGLT-2 inhibitor group (SMD = − 1.42; 95% CI [− 2.02, − 0.82]; I2 = 94%; p < 0.0001; Fig. 3). Owing to the high heterogeneity in the results, we performed subgroup analyses based on intervention duration, baseline BMI (obesity: BMI > 28 kg/m2; overweight: BMI 24–28 kg/m2), average age of patients, and whether or not to merge NAFLD with T2DM to analyse the sources of heterogeneity.
Fig. 3
SGLT-2 inhibitors compared to control on VAT levels
Subgroup analysis based on intervention duration showed that SGLT-2 inhibitors reduced VAT when they were administered between 16 to 40 weeks (SMD = − 2.29; 95% CI [− 3.51, − 1.08]; I2 = 96%; p = 0.0002) or more (SMD = − 0.82; 95% CI [− 1.32, − 0.31]; I2 = 65%; p = 0.001). However, when the administration time was 16 to 40 weeks, the SAT decreased more significantly. When they were administered with an intervention duration of < 16 weeks, they did not reduce VAT (SMD = − 0.38; 95% CI [− 0.76, 0.00]; I2 = 50%; p = 0.05; Fig. 4A).
Fig. 4
Subgroup analyses of SGLT-2 inhibitors efficacy on VAT. A Subgroup analysis of VAT based on the duration of the intervention; B subgroup analysis of VAT based on BMI; C subgroup analysis of VAT based on the age; D subgroup analysis of VAT based on T2DM with or without NAFLD
Subgroup analyses based on baseline BMI showed that reduction in VAT due to the SGLT-2 inhibitor was significant for the obesity group (SMD = − 1.93; 95% CI [− 2.86, − 1.01]; I2 = 96%; p < 0.0001), as compared with the overweight group (SMD = − 0.68; 95% CI [− 1.22, − 0.15]; I2 = 78%; p = 0.01; Fig. 4B).
Subgroup analyses according to the mean age of patients included in the study showed that the SGLT-2 inhibitors significantly reduced VAT when the mean age was less than 60 years (SMD = − 1.71; 95% CI [− 2.54, − 0.89]; I2 = 95%; p < 0.0001) as compared with age more than 60 years (SMD = − 0.89; 95% CI [− 1.53, − 0.26]; I2 = 78%; p = 0.006; Fig. 4C).
Subgroup analysis based on whether or not NAFLD was merged with T2DM showed that the SGLT-2 inhibitor significantly reduced VAT in patients with NAFLD in T2DM (SMD = − 2.73; 95% CI [− 4.33, − 1.13]; I2 = 97%; p = 0.0008) compared with that in patients without NAFLD in T2DM (SMD = − 0.60; 95% CI [− 0.94, − 0.27]; I2 = 70%; p = 0.0004; Fig. 4D).
Efficacy of SGLT-2 inhibitors on SAT reductionA total of 16 RCTs involving 937 participants estimated VAT. Compared with the control group, SAT was significantly lower in the SGLT-2 inhibitor group (SMD = − 1.21; 95% CI [− 1.99, − 0.42]; I2 = 93%; p = 0.003; Fig. 5). Similarly, because of the high heterogeneity in the results, we conducted relevant subgroup analysis.
Fig. 5
Effect of SGLT-2 inhibitors compared to control on SAT levels
Subgroup analysis based on intervention duration showed that SGLT-2 inhibitors reduced SAT when they were administered between 16 and 40 weeks (SMD = − 1.87; 95% CI [− 3.29, − 0.44]; I2 = 96%; p = 0.01) or more (SMD = − 1.00; 95% CI [− 1.55, − 0.44]). However, when the administration time was 16 to 40 weeks, the SAT decreased more significantly. When the intervention duration was < 16 weeks (SMD = − 0.32; 95% CI [− 1.09, 0.44]; I2 = 77%; p = 0.41), SGLT-2 inhibitors did not reduce SAT (Fig. 6A).
Fig. 6
Subgroup analyses of SGLT-2 inhibitors efficacy on SAT. A Subgroup analysis of SAT based on the duration of the intervention; B subgroup analysis of SAT based on BMI; C subgroup analysis of SAT based on the age; D subgroup analysis of SAT based on T2DM with or without NAFLD
Subgroup analyses based on baseline BMI showed that SGLT-2 inhibitors showed a significant reduction in SAT only in the obesity group (SMD = − 1.47; 95% CI [− 2.68, − 0.26]; I2 = 95%; p = 0.02; Fig. 6B).
Subgroup analyses according to mean patient age showed that the SGLT-2 inhibitors significantly reduced SAT only when the mean age was below 60 years (SMD = − 1.62; 95% CI [− 2.96, − 0.28]; I2 = 95%; p = 0.02; Fig. 6C).
Subgroup analysis based on whether or not NAFLD was merged with T2DM showed that SGLT-2 inhibitors significantly reduced SAT in patients with NAFLD in T2DM (SMD = − 2.05; 95% CI [− 3.92, − 0.17]; I2 = 96%; p = 0.03) compared with that in patients without NAFLD in T2DM (SMD = − 0.65; 95% CI [− 1.27, − 0.03]; I2 = 81%; p = 0.04; Fig. 6D).
Efficacy of SGLT-2 inhibitors on ectopic fatFive studies involving 262 participants evaluated the effects of SGLT-2 inhibitors on liver fat and compared with placebo or other antihyperglycemic drugs; the results showed that SGLT-2 inhibitors significantly decreased liver fat (SMD = − 0.70; 95% CI [− 1.20, − 0.20]; I2 = 73%; p = 0.006; Fig. 7).
Fig. 7
Effect of SGLT-2 inhibitors compared to control on liver fat levels
Subgroup analysis based on intervention duration showed that SGLT-2 inhibitors reduced liver fat only when they were administered between 16 and 40 weeks (SMD = − 0.91; 95% CI [− 1.75, − 0.07]; I2 = 84%; p = 0.03) as compared with < 16 weeks (SMD = − 0.40; 95% CI [− 0.82, 0.02]; I2 = 0%; p = 0.06; Additional file 1: Fig. S1A and Table S1).
Subgroup analyses based on baseline BMI showed that reduction in liver fat due to the SGLT-2 inhibitor was significant for only on the obesity group (SMD = − 0.76; 95% CI [− 1.42, − 0.10]; I2 = 80%; p = 0.02), as compared with the overweight group (SMD = − 0.52; 95% CI [− 1.05, 0.02]; p = 0.06; Additional file 1: Fig. S1B and Table S1).
Subgroup analyses according to mean patient age showed that the SGLT-2 inhibitors significantly reduced liver fat only when the mean age was below 60 years (SMD = − 0.73; 95% CI [− 1.36, − 0.11]; I2 = 80%; p = 0.02; Additional file 1: Fig. S1C and Table S1).
Subgroup analysis based on whether or not NAFLD was merged with T2DM showed that SGLT-2 inhibitors significantly reduced liver fat only in patients with NAFLD in T2DM (SMD = − 0.82; 95% CI [− 1.43, − 0.21]; I2 = 77%; p = 0.008) compared with that in patients without NAFLD in T2DM (SMD = − 0.25; 95% CI [− 0.80, 0.30]; p = 0.37; Additional file 1: Fig. S1D and Table S1).
Only 3 trials reported EAT, and the results were compared between the treatment group and the control group; SGLT-2 inhibitors did not reduce EAT (SMD = 0.03; 95% CI [− 0.52, 0.58]; I2 = 69%; p = 0.91; Fig. 8).
Fig. 8
Effect of SGLT-2 inhibitors compared to control on EAT levels
Changes in other body compositionThe results of anthropometric parameters in the SGLT-2 inhibitor group showed a significant reduction. Compared with the control group, the SGLT-2 inhibitor group significantly reduced BMI (MD = − 0.81; 95% CI [− 0.91, − 0.71]; I2 = 23%; p < 0.0001), body weight (MD = − 2.60; 95% CI [− 3.30, − 1.89]; I2 = 95%; p < 0.0001), and waist circumference (MD = − 3.65; 95% CI [− 4.10, − 3.21]; I2 = 0%; p < 0.0001; Fig. 9). Due to the low heterogeneity of BMI and waist circumference, sensitivity analysis and subgroup analysis were not required to determine the source of heterogeneity. Only a subgroup analysis of body weight levels was performed to determine the source of heterogeneity.
Fig. 9
Effect of SGLT-2 inhibitors compared to control on BMI levels (A); effect of SGLT-2 inhibitors compared to control on body weight levels (B); effect of SGLT-2 inhibitors compared to control on waist circumference levels (C)
Subgroup analysis based on intervention duration showed that SGLT-2 inhibitors reduced body weight when they were administered between 16 and 40 weeks (SMD = − 2.77; 95% CI [− 3.61, − 1.93]; I2 = 97%; p < 0.0001) or more (SMD = −3.77; 95% CI [− 4.92, − 2.62]; p < 0.0001) (Additional file 1: Fig. S2A and Table S2).
Subgroup analyses based on baseline BMI showed that reduction in body weight due to the SGLT-2 inhibitor was significant for the overweight group (SMD = − 2.56; 95% CI [− 2.78, − 2.34]; I2 = 0; p < 0.0001), and obesity group (SMD = − 2.63; 95% CI [− 3.45, − 1.81]; I2 = 95%; p < 0.0001; Additional file 1: Fig. S2B and Table S2).
Subgroup analyses according to the mean age of patients included in the study showed that the SGLT-2 inhibitors significantly reduced body weight when the mean age was less than 60 years (SMD = − 2.46; 95% CI [− 3.40, − 1.53]; I2 = 95%; p < 0.0001) and age more than 60 years (SMD = − 2.77; 95% CI [− 3.51, − 2.03]; I2 = 56%; p < 0.0001; Additional file 1: Fig. S2C and Table S2).
Subgroup analysis based on whether or not NAFLD was merged with T2DM showed that SGLT-2 inhibitors significantly reduced body weight in patients with NAFLD in T2DM (SMD = − 2.91; 95% CI [− 3.91, − 1.92]; I2 = 97%; p < 0.0001) compared with that in patients without NAFLD in T2DM (SMD = − 2.25; 95% CI [− 3.08, − 1.43]; I2 = 60%; p < 0.0001; Additional file 1: Fig. S2D and Table S2).
Sensitivity analysis and publication biasBecause of the high heterogeneity in the research results for SAT, VAT, liver fat and body weight, we explored the sources of heterogeneity through sensitivity analysis. The sensitivity analysis results of VAT, SAT, liver fat and body weight showed that any single study excluded from the study would not affect the significance of our combined effect size on any result (Figs. 10, 11, Additional file 1: Figs. S5, S6). The funnel diagram of VAT showed asymmetry (Fig. 12). We further conducted Begg’s test (p = 0.251), and the results indicated that no publication bias was evident. The funnel diagram of SAT showed symmetry (Fig. 13), indicating that the included articles had no publication bias and the results were robust.
Fig. 10
Sensitivity analysis of VAT
Fig. 11
Sensitivity analysis of SAT
Fig. 12 Fig. 13
留言 (0)