Cell culture and transfection
Primary osteoblasts were derived from 5 to 7-day-old newborn BALB/c mice (Animal Center, Guangxi Medical University, China). Collected bone tissues were digested using Type II Collagenase (Gibco, CA, USA). Vascular endothelial cells were derived from cell lines (MPVEC, Aolu Company, Shanghai, China). Primary osteoblasts and vascular endothelial cells were cultured, respectively, in MEMα medium (Gibco, CA, USA) and DMEM medium (Gibco, CA, USA) supplemented with 10% fetal bovine serum (Gibco, CA, USA) and 100 U/ml each of penicillin and streptomycin (Gibco, CA, USA). Then, cells were maintained at 37 ℃ in a thermostatic incubator with 5% CO2. D-gal (20 g/L, Gibco, CA, USA) was added to the medium to induce cellular senescence. Osteoblasts were added to the upper chamber of a Transwell chamber (Corning, USA) and adjusted to a 2.0 × 10⁵ cells/ml density. Endothelial cells were inoculated in six-well plates (Corning, USA) at a 1.0 × 10⁵ cells/ml density. Put the Transwell chambers into the plates after both cell types reached 50% adhesion growth density to establish the co-culture model. miR-214-3p mimic and inhibitor with their negative controls were purchased from RiboBio company. According to the manufacturer’s protocol, they were transfected into the endothelial cells utilizing riboFECT CP reagents (RiboBio, Guangzhou, China).
Exosomes isolation and transmission electron microscopy (TEM)
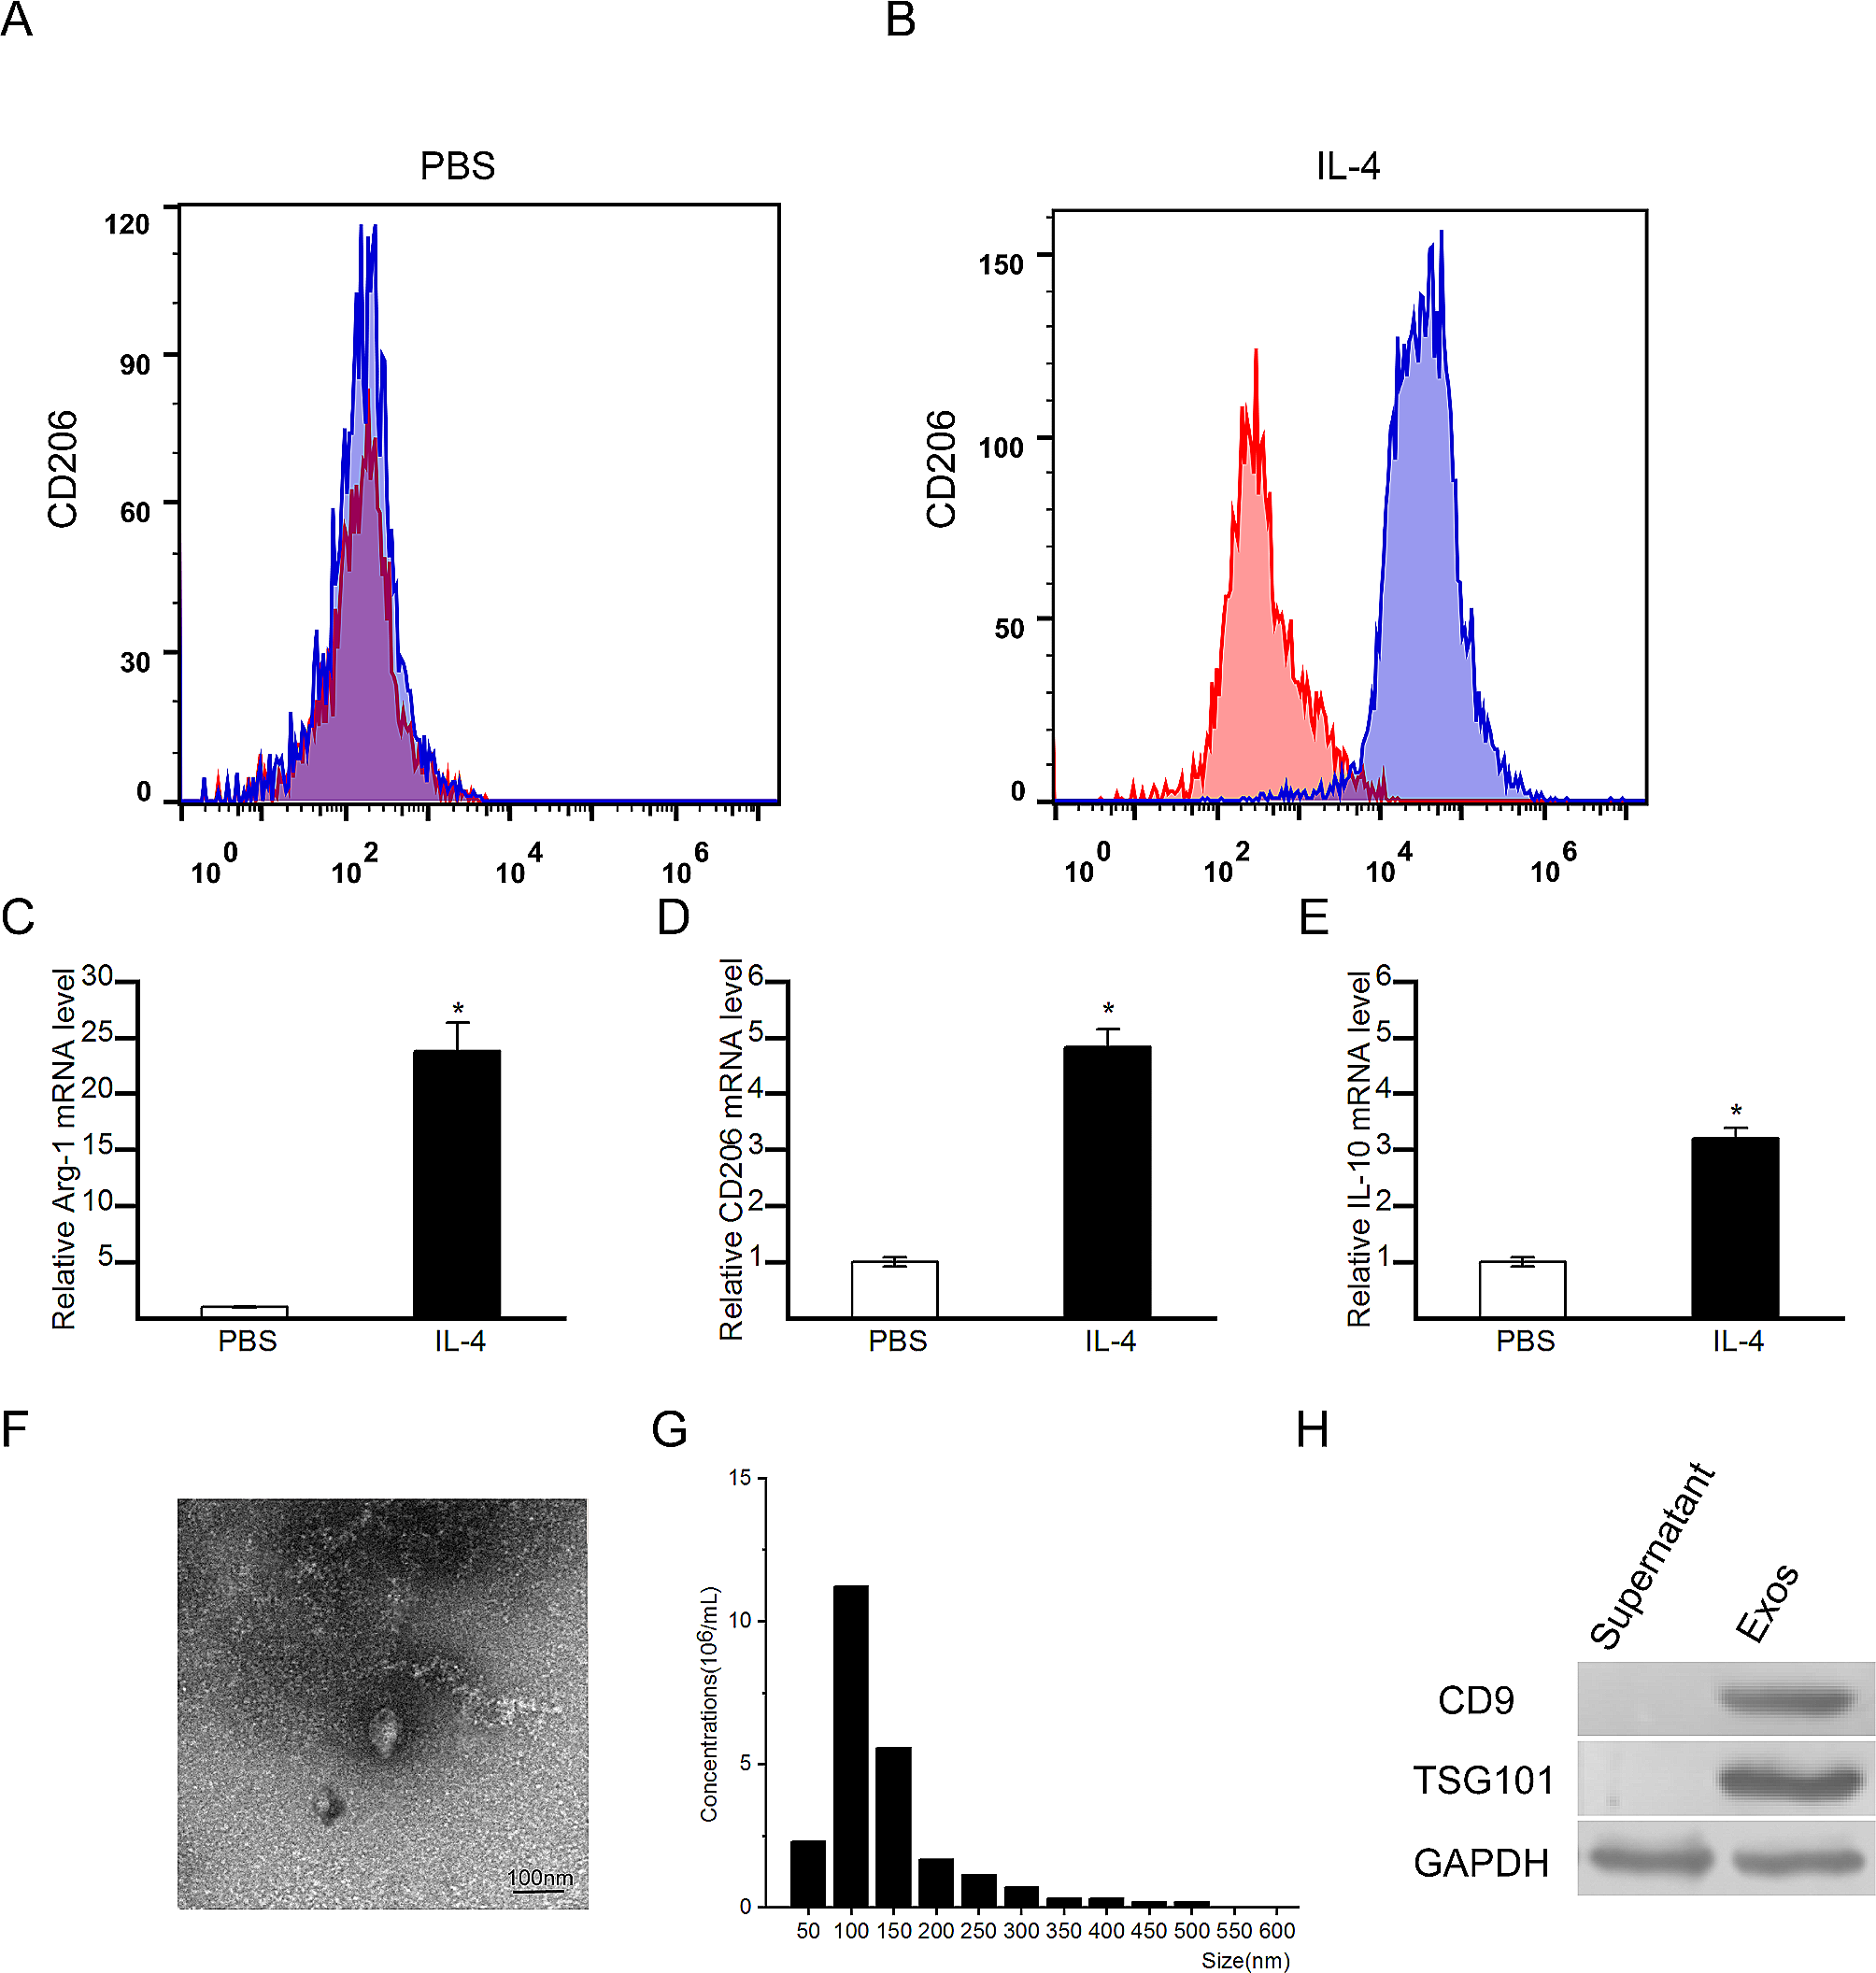
SBI ExoQuick-TC ULTRA EV Isolation Kit (System Biosciences, USA) was used to isolate exosomes from osteoblasts culture supernatant. The isolated exosomes were resuspended in PBS, and 5 μL of the diluted mixture was dropped onto sealing films. Put the carbon-coated copper mesh on the droplets floating. Subsequently, the sealing film was stained with 20 μl of 1% phosphotungstic acid-staining droplet. After drying naturally, a standard TEM with a Philips CM120 microscope was used to observe exosomes and take a picture.
Nanoparticle analysis
Phosphate-buffered saline was used to dilute the extract exosomes. A vortex mixer was used to mix the exosomes evenly. The exosomes were measured with Nanosight NS300 (Malvern, Britain). Each sample was measured three times and 30 s each time.
Western blot
The samples were lysed in RIPA buffer (Thermo Fisher Scientific, USA). The proteins were isolated in 10% SDS polyacrylamide gel electrophoresis and then transferred onto PVDF membranes. Membranes were blocked and cultivated with primary antibodies overnight at 4 °C. The primary antibodies include CD9, CD63, TSG101, and calnexin (all from Abcam). Membranes were washed and further incubated with either HRP-labeled sheep anti-rabbit secondary antibodies or HRP-labeled sheep anti-mouse secondary antibodies for 2 h at room temperature and washed again. Protein bands were detected with the enhanced chemiluminescence detection system (Millipore, Bedford, MA).
RNA isolation, reverse transcription, and quantitative real-time polymerase chain reaction (qRT-PCR)
TRIzol reagent (Invitrogen, CA, USA) was used to isolate total RNA from the cells following the manufacturer’s guidelines. The RNA was converted into cDNA by reverse transcription using the microRNA First-Strand cDNA Synthesis Kit (Sangon Biotech, Shanghai, China) and RevertAid First Strand cDNA Synthesis Kit (Sangon Biotech, Shanghai, China). Real-time PCR was performed to detect the RNA expression using SYBR Green PCR Master Mix (Applied Biosystems) and running with the Applied Biosystems 7300 Fast Real-Time PCR System (Applied Biosystems). The miRNA expression level was standardized to U6, and the mRNA expression level was standardized to GAPDH. The results were analyzed by the 2−△△Ct method. The primer sequences used in this study are described in Table.1.
Table 1 Primer sequences used in this studyCell senescence assay
Senescence-associated-β-galactosidase (SA-β-gal) staining was performed to detect cell senescence using a Cell Senescence β-Galactosidase Staining Kit (Beyotime, Shanghai, China) according to the manufacturer’s protocol. When the cell density reached about 50% under a standard optical microscope, the cells were fixed and stained with SA-β-gal staining solution at 37 °C overnight. After washing the cells with PBS, a digital microscope camera (Olympus) was used to capture images (200 ×). Results were expressed as the percentage of SA-β-gal-positive cells among the total cells counted.
Cell apoptosis assay
A Hoechst 33,258 Staining Kit (Beyotime, Shanghai, China) was used to evaluate the cell nuclear apoptotic changes. Cells were fixed, washed, and stained according to the manufacturer’s instructions. A drop of anti-fluorescence sealing liquid was placed on the cells. The blue-stained nucleus could be detected, and the images (200 ×) were taken under an inverted fluorescence microscope (Olympus, Japan).
Cell proliferation assay
Cell proliferation was detected by the SP staining kit (Zhongshan Jinqiao, Beijing, China) and the Ki67 cell proliferation detection kit (Sangon Biotech, Shanghai, China). Cells were used when they reached a confluence of 70%. The cells were incubated with the antibodies after they were immobilized on glass slides, and then, they were added onto the climbing tablet to carry out DAB and hematoxylin staining. Photographs (200 ×) were taken after the cells were sealed.
Cell migration assay
Transwell chambers (8 μm, Corning, USA) were applied following the manufacturer’s protocol for the cell migration experiment. The cell density was adjusted to 2 × 10⁵ cells/ml. Subsequently, 500 μl serum-free DMEM with transfected cells was added to the upper chambers, and the lower chamber was filled with a 750 μl medium containing serum. After 12-h incubation, the migrated cells were fixed with POM and stained with 500 μ1 0.1% crystal violet solution for 30 min. Then, an inverted microscope was used to count the number of migrated cells and take the photographs (200 ×).
Dual-Luciferase assay
The L1CAM 3′-UTR wild-type (WT) and mutated (MUT) sequences of the target gene L1CAM, were cloned into the pSICheck-2 plasmid. Next, 293 T cells were cultured using 96-well plates. Objective plasmids and mutant plasmids were mixed with miR-214-3p mimic and scrambled RNA as a negative control. Lipofectamine 2000 transfection reagent was used for transfection. After transfected 48 h, the relative luciferase activity was detected using Dual-Luciferase System Kit (Promega, USA) following the manufacturer’s instructions.
Statistical analysis
All data were presented as mean ± S.D. All statistical analyses for this research were executed by SPSS 23.0 software (Chicago, IL, USA) and GraphPad Prism 8 software (La Jolla, CA, USA). The significance of the difference in the mean was estimated using a t-test and one-way analysis of variance. For all analyses, * was used to represent p < 0. 05, while ** was used to represent p < 0. 01.


留言 (0)