
記住我
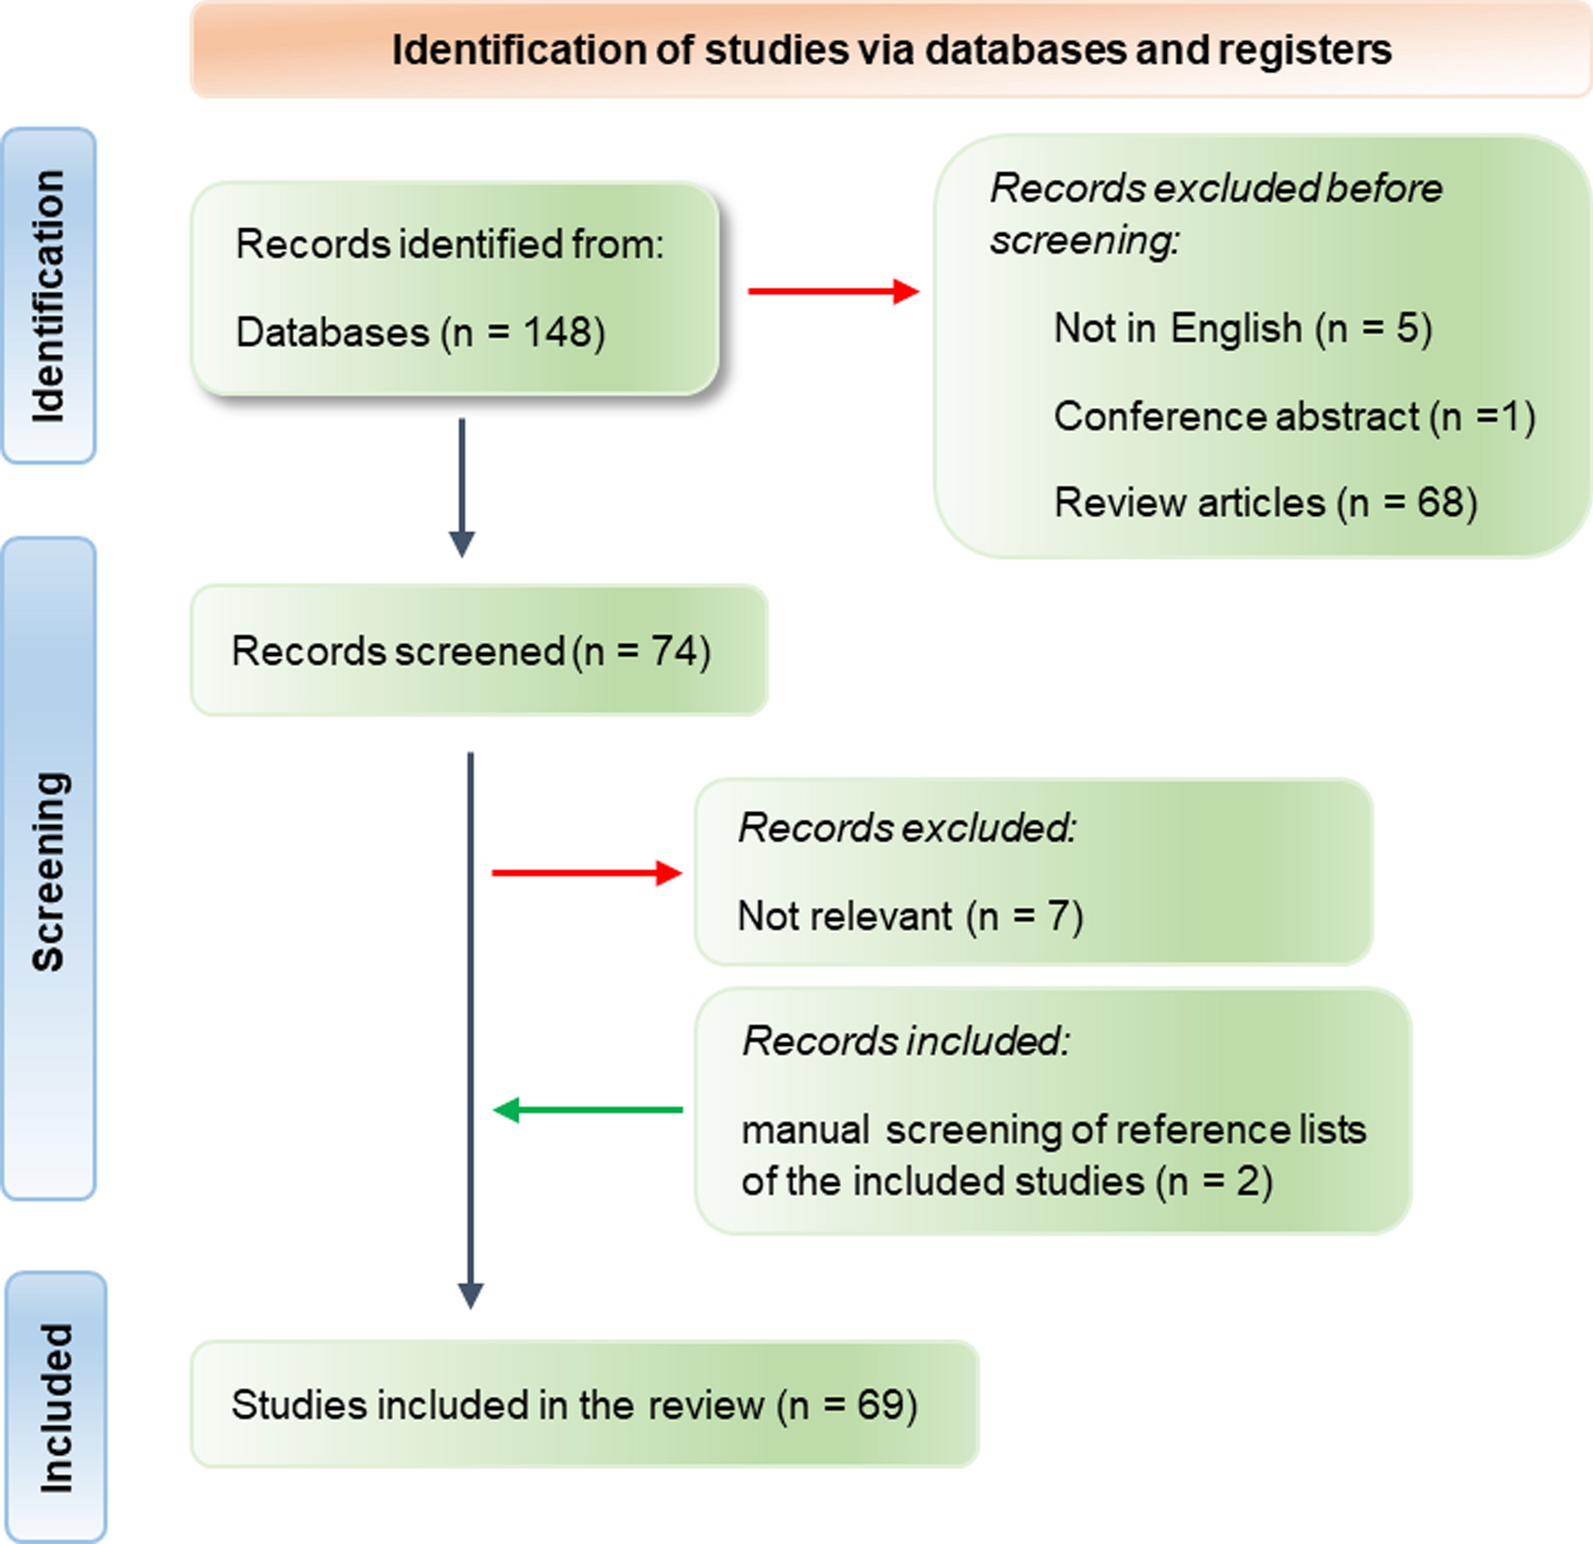
A flowchart of the patient selection process is shown in Fig. 1. A total of 69,601 patients received health check-ups between 2018 and 2019. After excluding patients who did not undergo ultrasonography, data for 6315 patients were included in the analysis. Of these, 3264 CAS cases were included in the training dataset, 817 in the internal validation dataset, and 2234 in the external validation dataset. Table 1 presents the demographic and clinical characteristics of the training dataset, as well as internal and external validation datasets. The proportion of CAS in the training, internal, and external validation datasets was approximately 50%, and there were no statistically significant differences between the groups. When comparing the variables in each validation dataset with the training dataset, it was found that the AST was higher in the internal validation dataset than in the training dataset, with values of 20 (IQR: 17, 24) and 19 (IQR: 16, 24) U/L, respectively. In addition, age and waist circumference were higher in the external validation dataset than in the training dataset. The external validation dataset had an age of 49 (IQR: 40, 57) years old, while the training dataset had an age of 48 (IQR: 37, 55) years. Similarly, the external validation dataset had a waist circumference of 85 (IQR: 79, 91) cm, while the training dataset had a waist circumference of 85 (IQR: 78, 91) cm. However, HDL-C, TP, and ALB levels in the external validation set were found to be lower than levels in the training set. The HDL-C level in the external validation set was 1.20 (IQR: 1.01, 1.42) mmol/L, while in the training set it was 1.21 (IQR: 1.03, 1.46) mmol/L. The TP level was 69.1 (IQR: 66.8, 71.6) g/L in the external validation set and 70.2 (IQR: 67.8, 72.6) g/L in the training set. The ALB level was 43.80 (IQR: 42.30, 45.40) g/L in the external validation set and 44.30 (IQR: 42.70, 45.90) g/L in the training set. The other characteristics of each validation set were comparable to those of the training set.
Fig. 1 Table 1 Characteristics of the training and validation datasetsDevelopment and calibration of CAS classification ML models
Ten features for CAS classification were selected using the GA-KNN algorithm from 24 candidate variables, including age, sex, non-HDL-C, FSG, TC, DBP, LDL-C, ALB, GGT, and ALP. Table 2 and Fig. 2 provide a summary of the performance of ML models. In the internal validation set, LR and GBDT models had the best performance with an auROC up to 0.861 (95% CI 0.841–0.881) and 0.860 (95% CI 0.839–0.880), whereas the corresponding performance metrics of KNN, MLP, SVM-linear, SVM-nonlinear, RF, NB, XGB, and DT were 0.800 (95% CI 0.777–0.824), 0.852 (95% CI 0.832–0.872), 0.846 (95% CI 0.824–0.867), 0.835 (95% CI 0.812–0.857), 0.849 (95% CI 0.828–0.870), 0.829 (95% CI 0.805–0.852), 0.855 (95% CI 0.835–0.876), and 0.817 (95% CI 0.794–0.840), respectively. The model performance reflected by auPR is consistent with that of auROC. With a cut-off value of the operating point determined by the maximal Youden index, the specificity, sensitivity, PPV, NPV, PLR, and NLR were 0.85, 0.722, 0.757, 0.804, 3.057, and 0.208 for the LR model, respectively, and 0.84, 0.729, 0.762, 0.797, 3.104, and 0.219 for the GBDT model, respectively. External validation was also performed to validate the model performance of CAS discrimination, and LR and GBDT models demonstrated similar performance in auROC, auPR, sensitivity, and specificity (Fig. 2). We also showed the calibration curves for the GBDT model in the training, internal and external validation dataset in Fig. 3, which showed good consistency between actual and expected probabilities.
Table 2 The performance of ten ML models for recognizing CAS in the training set, internal validation set, and external validation setFig. 2
ROC and PR curves of models with different algorithms in the training, internal validation, and external validation datasets. PR: precision-recall; ROC: receiver operating characteristic; KNN k-nearest neighbors; LR logistic regression; NB naive bayes; RF random forest; SVM-linear linear support vector machine; SVM-nonlinear non-linear support vector machine; DT decision tree; GBDT gradient boosting decision tree; MLP multiplayer perception; XGB extreme gradient boosting machine
Fig. 3
Calibration plots of the GBDT model in the training, internal validation, and external validation datasets. GBDT: gradient boosting decision tree
Sensitivity analysis of the optimal GBDT model for CAS classificationTo test performance of the GBDT model in different CAS risk groups, sensitivity analysis was performed in the following five subsets, individuals aged ≥ 65 years, BMI ≥ 30 kg/m2, with dyslipidemia, with hypertension, or with diabetes in the training and internal and external validation datasets (Table 3). The analysis showed moderate to high discriminative performance of GBDT models across different subgroups, with an auROC range of 0.869–0.996, auPR of 0.866–0.993, sensitivity of 0.710–0.948, specificity of 0.775–0.939, PPV of 0.645–0.951, PLR of 0.93–3.184 and NLR of 0.133–0.689. However, the NPV was relatively low in subgroup aged ≥ 65 years, with a range of 0.100–0.333 and in subgroup with diabetes with a range of 0.361–0.548.
Table 3 Performance of GBDT model in five high-risk CAS subgroupsInterpretability and clinical benefit analysisFinally, the GBDT model with the best performance was selected for SHAP analysis. We also performed SHAP analysis on the XGB model, which is an integrated learning algorithm based on GBDT. Figure 4 shows a global summary of the SHAP value distribution for all features, which helps to understand the importance of each feature. Age, gender, Non-HDL-C, FSG, DBP, and TC were identified as the top six influencing indicators for CAS classification. According to both the GBDT and XGB models, age, Non-HDL-C, FSG, and DBP showed a positive correlation with CAS, while gender and TC showed a negative correlation with CAS (Figs. 4a, b). Age is the factor that contributes the most to model predictions. The clinical utility of ML models at varying risk thresholds is depicted in Fig. 5. The ML models demonstrated a net benefit in DCA when compared to “treat-all”, “treat-none” at a threshold probability of > 20%. Here, “treat” refers to the selection of patients for intervention.
Fig. 4
Contribution analysis to the prediction of the GBDT and XGB models in the training dataset using the SHAP technique. The higher the ranking, the more important the characteristics; each point is a patient and the color gradient from red to blue corresponds to the high- to low-value of this feature. The point on the left side of the digital baseline (with a SHAP value of 0) represents a negative contribution to suffering from CAS, while the point on the right represents a positive contribution. The farther from the baseline, the greater the impact. CAS: carotid atherosclerosis; GBDT: gradient boosting decision tree; SHAP: SHapley Additive exPlanations; XGB: extreme gradient boosting machine; ALB Albumin; ALP Alkaline phosphatase; DBP Diastolic blood pressure; FSG Fasting serum glucose; GGT Gammaglutamyl transpeptidase; LDL-C Low-density lipoprotein cholesterol; Non-HDL-C Non-high-density lipoprotein cholesterol; TC Total cholesterol
Fig. 5
DCA curve analysis of the ML models in the development and validation datasets. DCA: decision curve analysis; KNN k-nearest neighbors; LR logistic regression; NB naive bayes; RF random forest; SVM-linear linear support vector machine; SVM-nonlinear non-linear support vector machine; DT decision tree; GBDT gradient boosting decision tree; MLP multiplayer perception; XGB extreme gradient boosting machine
留言 (0)