Microarray-based expression analysis and GEO database analysis
The DLBCL-related miRNA expression profiles of GSE29493 and GSE40239 were retrieved from the Gene Expression Omnibus (GEO) database (https://www.ncbi.nlm.nih.gov/geo/).
MiR-124’s pan cancer analysis is conducted through online websites (http://www.picb.ac.cn/dbDEMC/).
Bioinformatics predicted NFATc1 as the target of miR-124-3p
The miRbase (http://www.mirbase.org/), miRDB (http://mirdb.org), and TargetScan (http://www.targetscan.org) databases were employed to predict the genes that might be regulated by miR-124-3p [13]. The prognostic genes of DLBCL were obtained from the GEO (GSE10846) database [14]. The differentially expressed genes in DLBCL were downloaded from the GEPIA website (http://gepia.cancer-pku.cn/) [15]. We intersected the miR-124-3p-related genes and the differentially expressed genes and the prognostic genes in DLBCL. Subsequently, genes were subjected to Kyoto Encyclopedia of Genes and Genomes (KEGG) pathway analysis [16], Gene Ontology (GO) analyses [17], and protein–protein interaction (PPI) analysis [18]. The network was analyzed by Cytoscape 3.7.2 software. Then, we used the microRNA database (http://www.microrna.org/) to predict the miR-124-3p binding site on NFATc1 mRNA. The expression of NFATc1 from The Cancer Genome Atlas (TCGA) was analyzed with datasets from the GEPIA and Oncomine (www.oncomine.org) databases. Transcription factors were predicted through the hTFtarget website (http://bioinfo.life.hust.edu.cn).
Cell cultures
Human SU-DHL-6 and SU-DHL-10 cells were a kind gift from Professors Jing Wei and Fang Wang of the Biology Laboratory of Sichuan University (Sichuan, China). The cell lines were authenticated by short tandem repeat analysis. The cells were cultured in 1640 medium (HyClone, Logan, USA) supplemented with 10% fetal bovine serum (HyClone), 100 units/mL penicillin and 100 µg/mL streptomycin and were maintained in a humidified atmosphere at 37 °C with 5% CO2.
hBMSC identification and culture
hBMSCs were purchased from Saiye Biology Co., Ltd. (HUXMA-01001) and cultured in DMEM-F12 culture medium with 10% FBS at 37 °C with 5% CO2. hBMSCs were subjected to osteogenic and adipogenic differentiation in OriCell™ medium (Cyagen Biosciences Inc., Guangzhou, China) and then stained with alizarin red or oil red O according to the manufacturer’s instructions. A flow cytometer (BD Biosciences Pharmingen, San Jose, CA, USA) was used to detect the expression of hBMSC surface markers.
Transfection and lentiviral transduction
DLBCL cells were transfected with miR-124-3p/negative control (NC) mimic, miR-124-3p/NC inhibitor, or sh-NFATc1/NC plasmids (GenePharma, Shanghai, China) using RFectSPsRNA Transfection reagent (Baidai, Shanghai, China) in accordance with the manufacturer’s instructions for 48 h. Lentivirus packaging was performed in cells seeded in 60-mm dishes and transfected with pMD2G, psPAX2 and pLENTI 6.3-Luciferase/miR-124-3p (miR-NC/miR-124-3p) (4 μg) plasmids. Twenty-four hours after transfection, the medium was replaced with fresh medium, and the cells were cultured for another 24 h. Then, the medium was collected and added to target cells for infection purposes. hBMSCs were cultured in 24-well plates at a density of 5 × 10⁴ cells/well overnight before infection. Five hundred microliters of lentivirus-containing medium and 500 µL of fresh culture medium supplemented with 8 µg of polyacrylamide (Sigma, St. Louis, MO, USA) was added to each well. The plates were then centrifuged at 3000 × g at 37 °C for 1 h before the virus-containing medium was replaced with fresh medium.
Dual luciferase reporter assay
The artificially synthesized NFATc1 3′-untranslated region (3′-UTR) gene fragment was cloned into the psiCHECK-2 dual luciferase vector to construct psiCHECK-2-NFATc1-3′-UTR-wild-type (NFATc1-WT) and psiCHECK-2-NFATc1-3′-UTR-mutant (NFATc1-MUT) vectors. The WT and MUT plasmids were cotransfected with the miR-124-3p mimic and NC mimic. The cells were collected and lysed after 24 h of transfection. Luciferase activity was detected using a Dual Luciferase Reporter Kit (Promega, Madison, WI, USA).
Exosome isolation
Exosomes were isolated from the serum using an ExoQuick Kit (EXOQ20A-1, System Biosciences, Palo Alto, CA, USA) in strict accordance with the instructions provided by the manufacturer. Ultracentrifugation was used for the isolation of exosomes from cultured hBMSCs [19]. The exosomes were resuspended in 100 μL of PBS and stored at -80 °C. The content of exosomes was determined by the BCA method.
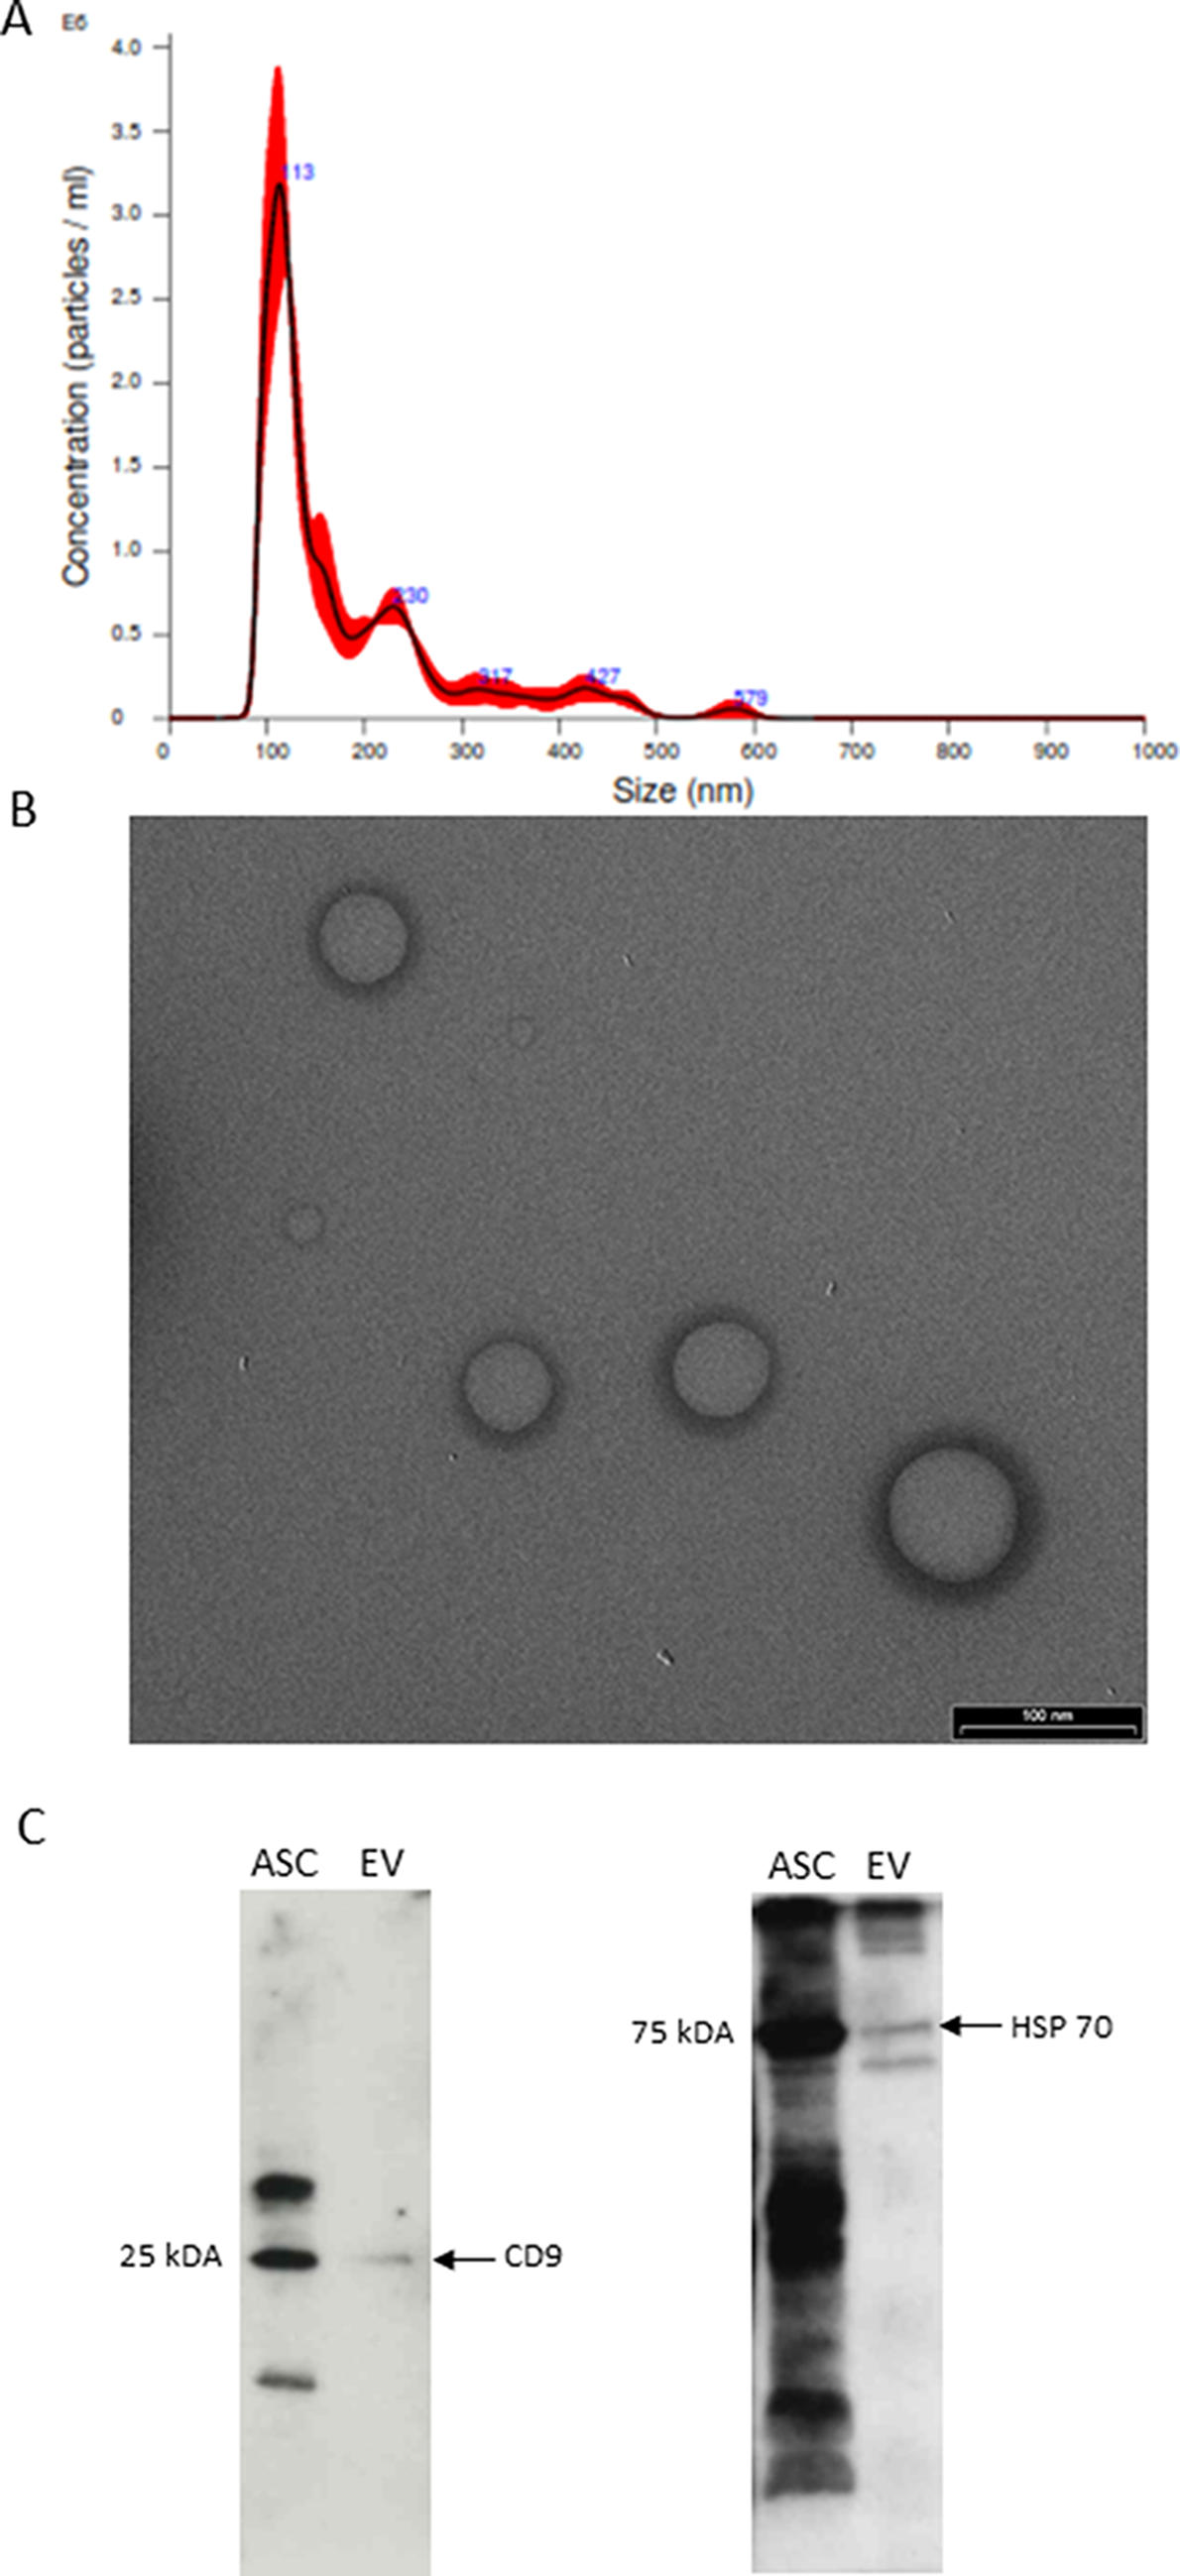
Observation of exosomes under TEM and analysis with NTA
Transmission electron microscopy (TEM) was used to identify exosomes. Samples were examined under an electron microscope (HITACHI, Tokyo, Japan) after drying at an accelerating voltage of 80 kV. To determine the size distribution, exosomes were analyzed with a Zeta View PMX110 nanoparticle tracking analyzer (Particle Metrix, Germany). DiO is used to track exosomes, as it can stably bind to the lipid region of the exosome membrane. All experimental steps were performed following the instructions of the DiO-Membrane EVS Labeling and Purification Kit (Rengen Biosciences Co., Ltd., Liaoning, China). The uptake of exosomes by DLBCL cells was observed under a fluorescence microscope (FV3000, Olympus, Tokyo, Japan).
Coculture and inhibition of exosome secretion
The exosomes produced by hBMSCs transfected with either miR-124-3p mimic or NC mimic were added to DLBCL cells cultured in exosome-free medium in a 6-well plate (Fig. 6A); the cells were categorized as Exo-miR-NC + DLBCL and Exo-miR-124-3p + DLBCL. MiR-124-3p-transfected hBMSCs (5 × 10⁴) and DLBCL cells (1 × 10⁵) were cocultured in a Transwell® model (Fig. 7A). hBMSCs and DLBCL cells were cocultured for 72 h before they were collected and used for subsequent experiments. The specific inhibitor GW4869 (Sigma-Aldrich, St. Louis, MO, USA) and DMA (Santa Cruz, Paso Robles, CA, USA) were used to block exosome secretion at concentrations of 10 nM and 15 nM, respectively.
Reverse transcription quantitative polymerase chain reaction (RT-qPCR)
qPCR was performed according to the instructions of the RT-qPCR Kit (Fermentas Inc., Hanover, MD, USA) with primers synthesized by TaKaRa (Tokyo, Japan) (shown in Additional file 1: Table S1). Real-time quantitative PCR (qPCR) was performed by a quantitative PCR instrument (Bio-Rad iQ5, Bio-Rad, Richmond, CA, USA).
Western blot analysis and immunohistochemistry were performed as previously described
The protein was quantified by a bicinchoninic acid (BCA) kit (Thermo Fisher Scientific, Rockford, IL, USA). Primary antibodies against CD63 (1:1000, Abcam, UK), Hsp70 (1:1000, Abcam, UK), calnexin (1:1000, Abcam, UK), TSG 101 (1:1000, Abcam, UK), cMYC (1:1000, Cell Signaling Technology Danvers, MA, USA), and GAPDH (1:5000, Abcam, UK) and mouse antibodies against NFATc1 (1:1000, Santa Cruz, CA, USA) were used. Immunohistochemical staining was performed using the streptavidin-peroxidase method.
Apoptosis assay and cell proliferation assay
Apoptosis was assessed by standard annexin V-FITC and/propidium iodide (PI) double staining analysis on a flow cytometer. Apoptosis was analyzed using a BD FACSCanto II flow cytometer (BD Biosciences, CA, USA) at 488 nm. Data were analyzed by FlowJo software. The cell proliferation assay was performed by CCK-8. The absorbance at 450 nm was recorded on a microplate reader (Bio-Rad Laboratories, Hercules, CA, USA).
Tumor xenografts in nude mice
NOD/SCID mice are used in our experiment because of their low immunity and easy tumorigenicity. A total of 12 male NOD/SCID mice (4–6 weeks old, weighing 18–22 g) were purchased from Huafukang Biotechnology Co., Ltd. (Beijing, China). After one week of acclimation, 100 μL SU-DHL-10 cells (1 × 10⁷) were subcutaneously injected into the upper flank region. Tumor volumes were measured every 2 days according to the formula V = 1/2 * (short diameter)2 × (longest diameter). After the tumor reached an approximate volume of 100 mm3, the mice were randomly (draw by lot) divided into three groups (hBMSC-transfected miR-124-3p, hBMSC-transfected miR-NC and PBS; four animals per group) by my colleagues. hBMSCs transfected with miR-124-3p or miR-NC were injected into NOD/SCID mice via the tail vein once every three days (5 × 10⁵ cells/mouse); mice in the PBS group received an equivalent volume of PBS. After seven injections, the mice were euthanized by cervical dislocation after CO2 anesthesia, and tumors were removed and weighed. Finally, the tumor samples were frozen in liquid nitrogen or embedded in paraffin for immunohistochemistry analysis after imaging. This study was carried out in compliance with the ARRIVE guidelines.
Statistical analysis
Statistical analyses were performed with SPSS 21.0 statistical software (SPSS, Inc., Chicago, IL, USA). Comparisons between two groups were performed with an independent samples t test; comparisons among multiple groups were performed with one-way analysis of variance (ANOVA). A statistically significant difference was defined as P < 0.05. Data are presented as the means ± SD of three independent experiments (*P < 0.05, ** P < 0.01, *** P < 0.001). Drawing through GraphPad Prism version 6 (GraphPad Prism Inc., San Diego, CA).


留言 (0)