
記住我

Cytomegalovirus (CMV)-related gastrointestinal (GI) diseases are common and can involve various organs, including the oral cavity, esophagus, stomach, small intestine, and large intestine—the last of which is the most common site of CMV-GI infection (1–4). Two-thirds of patients with CMV-GI disease are immunocompromised (5–7). The risk factors for CMV-GI infection include HIV infection with low CD4 count (2,8,9), post–organ transplantation (10–14), and taking immunosuppressive agents, especially corticosteroids (6,7,15,16). Interestingly, CMV-GI disease is being increasingly reported in immunocompetent hosts. The important risk factors for CMV-GI disease in immunocompetent patients were reported to be old age and being critically ill with multiple comorbid illnesses (6,7,16–19). Inflammatory bowel disease (IBD) also increases the risk of developing CMV-GI disease, despite not receiving immunosuppressive agents (20–22).
Diagnosis of CMV colitis requires colonoscopy with tissue biopsy. The presence of viral inclusion on histologic specimens stained with hematoxylin and eosin (H&E) has high specificity, but low sensitivity for diagnosing CMV colitis, with reported sensitivities and specificities of 10%–87% and 92%–100%, respectively. Immunohistochemistry (IHC) stain increases the diagnostic sensitivity to 78%–93%. Therefore, the combination of H&E staining and IHC has been recommended as the gold standard for diagnosing CMV colitis (23–25). Tissue polymerase chain reaction (PCR) assay, which amplifies CMV DNA, has been reported to increase the diagnostic sensitivity to 92%–96.7% (23,26). However, because of its high sensitivity, colonic tissue PCR might detect latent CMV replication in colonic tissue in patients who do not have a clinically significant infection (27–29). Quantitative tissue PCR, which is able to select different cutoffs of tissue viral load, has been reported to increase the specificity while maintaining sensitivity (30). Furthermore, there is a good correlation between tissue CMV viral load and the density of CMV-infected cells (31). The European Crohn's and Colitis Organization guideline recommends that colonic tissue PCR can be used to diagnose CMV colitis in patients with IBD (32). However, the data to define the optimal cutoff of tissue viral load for diagnosis of CMV colitis are currently limited to a few studies (30,33).
Although colonoscopy with tissue sampling remains the mainstay method for diagnosing CMV colitis, colonoscopy may not be feasible in some situations because of the high risk of procedural complications, such as in patients with profound neutropenia, thrombocytopenia, or severe illnesses. Plasma CMV-PCR is a noninvasive test that detects CMV viremia, which could be associated with CMV-GI disease. However, the results of previous studies that investigated the use of plasma CMV-PCR for diagnosing CMV colitis are inconsistent (34,35). Moreover, there has been increasing interest in stool CMV-PCR in diagnosing CMV colitis. Stool CMV-PCR is a noninvasive test that can be either qualitative or quantitative. In a pilot study, Herfarth et al (36) reported a sensitivity and specificity of stool CMV-PCR for detecting CMV DNA of 83% and 93%, respectively, in 19 patients with IBD. Since then, only a few studies have reported the performance of stool CMV-PCR for diagnosing CMV colitis, and the results of those studies are inconsistent. The reported sensitivity ranges from 16.7% to 85%, and the specificity ranges from 71% to 96% (37–40). Furthermore, and importantly, the diagnostic performance of combining plasma and stool CMV-PCR, which may improve the diagnostic performance, has not been studied.
Accordingly, the aim of this study was to investigate the diagnostic performance of stool CMV-PCR, plasma CMV-PCR, and the combination of stool CMV-PCR and plasma CMV-PCR for diagnosing CMV colitis using tissue histopathology (H&E stain and IHC) as a standard reference in patients with clinical suspicion of CMV colitis. We also evaluated the correlation between the number of CMV-infected cells in colonic tissue and the CMV viral load in stool, plasma, and colonic tissue.
METHODS Study design and participantsThis prospective cohort study was conducted at Siriraj Hospital, Mahidol University, Bangkok, Thailand, from October 2020 to October 2021. Patients older than 18 years with clinical suspicion of CMV colitis were enrolled into the study group. Twenty asymptomatic volunteers were also enrolled—all of whom underwent the same study protocol. Clinical suspicion for CMV colitis was established by the presence of at least one risk factor from the list in section 1 below and presenting with at least one GI tract symptom from the list in section 2 below.
Risk factors for CMV colitis: a. Immunocompromised status, including at least one of the following: HIV infection, solid organ or hematologic stem cell transplantation, active hematologic malignancy, or receiving immunosuppressive agents or chemotherapy at the time of enrollment. b. Patients without obvious immunocompromised status, but having some risk factors for CMV colitis, including being critically ill (defined by the presence of organ failure or requiring inotropic agents); age older than 60 years; or having multiple comorbid illnesses, including diabetes mellitus (DM), atherosclerosis, or chronic kidney disease (6,7,16–19). c. IBD (20–22). Presenting GI tract symptoms, including diarrhea, lower GI bleeding, bowel ileus, or pseudointestinal obstruction.All participants underwent colonoscopy with tissue biopsy. Histopathologic analysis of the tissue biopsy was performed using both H&E and IHC stain. An experienced GI pathologist (N.A.) counted the number of infected cells in biopsy specimens with IHC. Two pieces of colonic tissue were sent for quantitative CMV-PCR (CMV R-GENE kit, limit of detection 450 copies/mL; bioMérieux SA, Marcy-l'Étoile, France). Patients who could not be proceeded to colonoscopy with tissue biopsy were excluded. Quantitative stool CMV-PCR (CMV R-GENE kit, limit of detection 450 copies/mL; bioMérieux SA) and quantitative plasma CMV-PCR (cobas CMV, limit of detection 150 copies/mL; Roche Diagnostics, Basel, Switzerland) were performed within 7 days before or after colonoscopy.
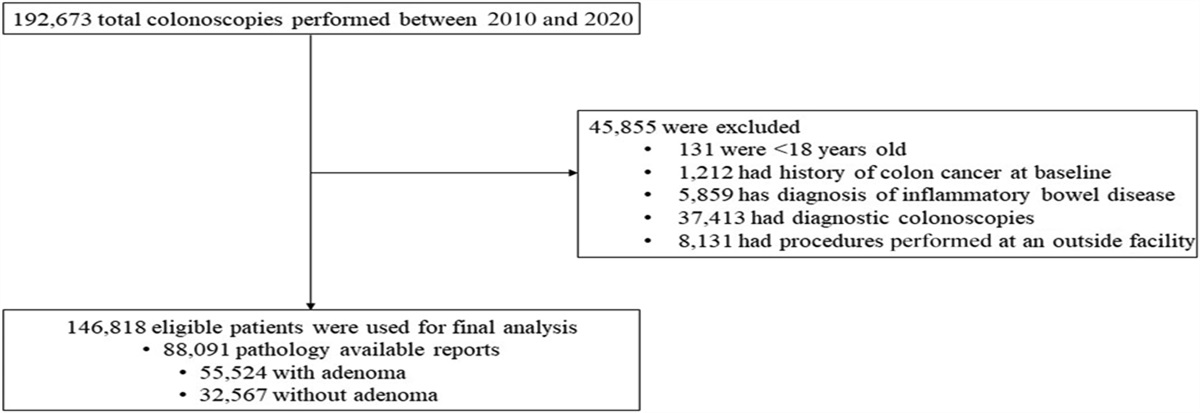
Patients diagnosed with CMV colitis based on detection of either cytomegalic cells on H&E stain or IHC-CMV cells were treated with ganciclovir for at least 2 weeks and then underwent follow-up colonoscopy with tissue biopsy to confirm complete treatment response. Stool specimens were also recollected and sent for CMV-PCR. The patients diagnosed with non-CMV colitis received treatment appropriate to their diagnosis. Twenty asymptomatic volunteers were enrolled into our asymptomatic control group, and all 20 of those subjects followed the same study protocol. A flow diagram describing subject enrollment, the study protocol, and the diagnostic outcome for both study patients and asymptomatic volunteers is shown in Figure 1.
 Figure 1.:
 Flow diagram describing subject enrollment, the study protocol, and the diagnostic outcome for both study patients and asymptomatic volunteers. CMV, cytomegalovirus; CMV-PCR, cytomegalovirus polymerase chain reaction.
CMV-infected cell morphologic diagnosis and cell count methodsThe H&E and CMV IHC study (clone CCH2+DDG9, DAKO, Denmark, 1:150 dilution) slides were retrieved from our archive and digitalized by whole slide scanner (Pannoramic 1,000, 3DHISTECH Ltd., Hungary) with ×40 objective lens (numerical aperture 0.95, pixel resolution 0.12 μm).
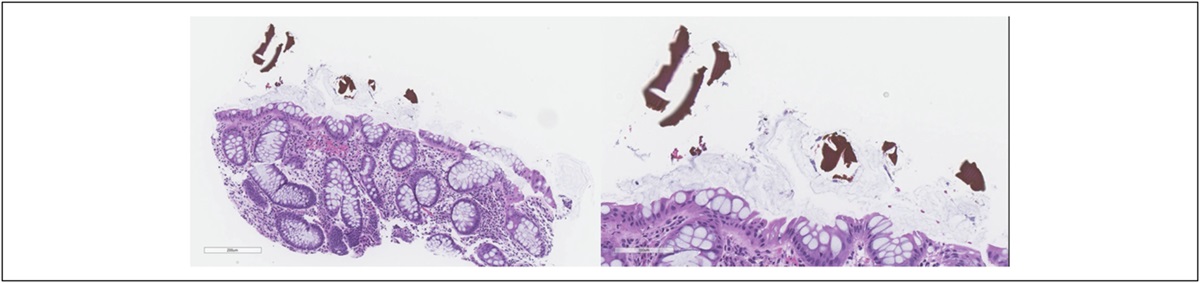
The digital H&E and CMV-IHC slides were reviewed (CaseViewer software, 3Dhistech) by pathologists. A CMV-positive cell is defined by the presence of IHC-positive intranuclear and/or intracytoplasmic inclusion. The CMV-positive cells and area of the biopsied tissue were counted and calculated by digital image analysis software (Quantcenter, 3DHISTECH) and recorded as the number of CMV-positive cells per mm2 (Figures 2a,b).
 Figure 2.:
 Images of H&E (×1,000) CMV-infected cells (arrow) reveal cytomegalic change with intranuclear and/or intracytoplasmic inclusions (a) and CMV IHC (×1,000) CMV-positive cells (b). CMV, cytomegalovirus; H&E, hematoxylin-eosin; IHC, immunohistochemistry.
Stool, plasma, and colonic tissue PCR techniqueFor stool CMV-PCR, CMV DNA from stool was extracted using a MagLEAD 12gC automated extraction platform (Precision System Science, Chiba, Japan). Briefly, the stool specimen was resuspended with phosphate-buffered saline at a concentration of 20% (g/mL) and then subjected to a freeze/thaw cycle 3 times. The supernatant was then collected and used for nucleic acid extraction. Quantitative CMV-PCR was performed using a CMV R-GENE kit (bioMérieux SA) according to the manufacturer's instructions.
For plasma CMV-PCR, 500 mL of plasma was placed into a Cobas AmpliPrep/Cobas TaqMan platform for nucleic acid extraction, amplification, and quantitation. Testing of plasma was performed using a Cobas AmpliPrep/Cobas TaqMan CMV assay (Roche Diagnostics) following the manufacturer's instructions.
For tissue CMV-PCR, the biopsied tissue was cut with scissors into small pieces and placed into a lysis buffer containing guanidine isothiocyanate. The tissue and buffer mixture was mixed thoroughly and incubated at room temperature for 20 minutes. The MagLEAD 12gC automated extraction platform (Precision System Science) was used to extract CMV DNA from 200 mL of lysed tissue. Extraction was performed according to the manufacturer's recommended protocol. Viral DNA was eluted with 100-mL buffer and used for real-time PCR assay. Quantitative CMV-PCR was performed using a CMV R-GENE kit (bioMérieux SA) according to the manufacturer's instructions. Ten milliliters of extracted DNA was added into the amplification mix, and the PCR was performed using a CFX96 Touch Real-Time PCR Detection System (Bio-Rad Laboratories, Hercules, CA).
Study outcomes Primary outcomes.The performance of stool CMV-PCR, plasma CMV-PCR, and their combinations was calculated using the detection of either cytomegalic cells on H&E stain or IHC-CMV cells as the reference standard for diagnosis of CMV colitis among 117 patients with clinically suspected CMV colitis. Correlation between cytomegalic cell count and quantitative tissue CMV-PCR, stool CMV-PCR, and plasma CMV-PCR was calculated. We also evaluated the performance of stool CMV-PCR in following up patients after treatment.
Secondary outcomes.The performance of the diagnostic tests using tissue CMV-PCR as the reference standard was assessed. Subgroup analysis assessed the performance of the diagnostic tests in patients with IBD, patients with immunocompromised status, and patients without obvious immunocompromised status but with some risk factors for CMV colitis.
Statistical analysisDescriptive statistics were used to summarize patient characteristics. Continuous variables are expressed as median and interquartile range (IQR) or mean ± SD, and categorical variables are presented as number of subjects and percentage. Standard 2-group comparison methods were used, including independent t test (for normally distributed data) or Wilcoxon rank-sum test (for non-normally distributed data) for continuous data, and χ2 test or Fisher exact test (depending on the size of the sample) for categorical data.
The diagnostic performance of stool CMV-PCR and plasma CMV-PCR is reported as the area under the receiver operating characteristic curve (AUC). The DeLong test was used to compare the AUCs of the stool and plasma CMV-PCR tests. After that, the sensitivity, specificity, positive predictive value (PPV), and negative predictive value (NPV) were calculated using the optimal cutoff value obtained from the Youden Index. The McNemar test was used to determine the statistical significance of differences among stool CMV-PCR, plasma CMV-PCR, and their combination. Spearman correlation coefficients (r) were used to determine the correlation between the number of infected cells in colonic tissue and stool CMV-PCR, plasma CMV-PCR, and colonic tissue CMV-PCR. All statistical analyses were performed using SAS version OnDemand for Academics (SAS Institute, Cary, NC). A 2-tailed P value of <0.05 was regarded as being statistically significant for all tests.
The protocol for this study was approved by the Siriraj Institutional Review Board on October 1, 2020 (COA no. Si 810/2020), and was in accordance with both the 1964 Declaration of Helsinki (and all of its subsequent amendments) and Good Clinical Practice guidelines. The study was registered at http://clinicaltrials.gov (NCT05522283). All study and volunteer participants provided signed informed consent before participation in the study.
RESULTS Patient characteristicsA total of 117 patients with clinical suspicion of CMV colitis were included, and of those, 27 (23.1%) patients were definitively diagnosed with CMV colitis. The most common diagnoses in the non-CMV colitis group were ulcerative colitis (n = 21), Crohn's disease (n = 11), drug-induced colitis (n = 9), and acute hemorrhagic rectal ulcer syndrome or stercoral ulcers (n = 8). A comprehensive list of non-CMV colitis diagnoses is shown in Supplementary Digital Content (see Supplementary Table S1, https://links.lww.com/CTG/A917). Patient and asymptomatic volunteer baseline characteristics are shown in Table 1. The mean age of study patients was 53 years, and 48% were men. Sixty-seven of 117 (57.3%) patients were immunocompromised, 11 (9.4%) had HIV infection, and 43 (36.7%) were treated with corticosteroids. Seventy patients (59.8%) were hospitalized. Of those, 37 patients had GI symptoms at admission, and the other 33 patients were admitted because of other indications and developed GI symptoms during hospitalization.
Table 1. - Patient baseline characteristics of all study patients, compared between study patients with and without CMV colitis, and of asymptomatic volunteersa Characteristics All study patients (N = 117) CMV colitis (n = 27) Non-CMV colitis (n = 90) P Asymptomatic volunteers (n = 20) Age (yr) 53.3 ± 18.4 55.8 ± 15.5 52.5 ± 19.2 0.41 52.10 ± 14.91 Male sex 56 (47.9%) 13 (48.2%) 43 (47.8%) 0.97 9 (45.0%) Underlying conditions Diabetes mellitus 18 (15.4%) 5 (18.5%) 13 (14.4%) 0.61 3 (15.0%) Coronary artery disease 10 (8.6%) 5 (18.5%) 5 (5.6%) 0.03 3 (15.0%) Cerebrovascular disease 14 (12.0%) 4 (14.8%) 10 (11.1%) 0.60 1 (5.0%) Chronic kidney disease 19 (16.2%) 5 (18.5%) 14 (15.6%) 0.71 0 (0.0%) HIV 11 (9.4%) 5 (18.5%) 6 (6.7%) 0.06 0 (0.0%) CD4 count (cells/mm3) 33.5 (18–293) 33.5 (27–156) 155.5 (8–495) 1.00 Organ transplantation 12 (10.3%) 2 (7.4%) 10 (11.1%) 0.58 0 (0.0%) Malignancy 18 (15.4%) 5 (18.5%) 13 (14.4%) 0.61 2 (10.0%) Autoimmune disease 10 (8.6%) 2 (7.4%) 8 (8.9%) 0.81 1 (5.0%) Inflammatory bowel disease 39 (33.3%) 6 (22.2%) 33 (36.7%) 0.16 0 (0.0%) Active IBD 27/39 (69.2%) 4/6 (66.7%) 23/33 (69.7%) 1.00 Immunosuppressive drugs 54 (46.1%) Corticosteroid 43 (36.7%) 7 (25.9%) 36 (40.0%) 0.18 0 (0.0%) Prednisolone dose (mg/d) 7.5 (5–15) 30 (15–40) 5 (5–15) 0.003 0 (0.0%) Other immunosuppressants 44 (37.6%) 10 (37.0%) 34 (37.8%) 0.94 0 (0.0%) Chemotherapy 11 (9.4%) 4 (14.8%) 7 (17.8%) 0.27 1 (5.0%) Immunocompromised status 67 (57.3%) 16 (59.3%) 51 (56.7%) 0.81 1 (5.0%) Status Inpatient 70 (59.8%) 21 (77.8%) 49 (54.4%) 0.03 0 (0.0%) GI symptoms at admission 37/70 (52.8%) 12/21 (57.1%) 25/49 (51.0%) 0.64 ICU 15 (12.8%) 7 (25.9%) 8 (8.9%) 0.02 0 (0.0%) On ventilator 19 (16.2%) 6 (22.2%) 13 (14.4%) 0.33 0 (0.0%) On inotropic drugs 17 (14.5%) 7 (25.9%) 10 (11.1%) 0.055 0 (0.0%) Acute kidney injury 24 (20.5%) 11 (40.7%) 13 (14.4%) 0.003 0 (0.0%) Clinical presentations Symptom duration (d) 14 (2–60) 15 (2–42) 14 (2–60) 0.54 Diarrhea 81 (52.1%) 14 (51.8%) 47 (52.2%) 0.97 Lower GI hemorrhage 45 (38.5%) 13 (48.1%) 32 (35.6%) 0.23 Abdominal pain 19 (16.2%) 1 (3.7%) 18 (20.0%) 0.07 Fever 17 (14.5%) 6 (22.2%) 11 (12.2%) 0.19 Laboratory findings Hemoglobin (mg/dL) 9.99 ± 2.39 9.41 ± 2.31 10.16 ± 2.40 0.15 WBC (cells/uL) 7,878 ± 4,450 8,456 ± 6,846 7,705 ± 3,462 0.59 Albumin (mg/dL) 3.21 ± 0.87 2.77 ± 0.78 3.35 ± 0.86 0.002 Endoscopic findings Ulceration 76 (65.0%) 24 (88.9%) 52 (57.8%) 0.002 Irregular/geographic 46 (39.7%) 16 (59.3%) 30 (33.7%) 0.017 Deep ulcer 18 (15.5%) 7 (25.9%) 11 (12.4%) 0.09 Punch out lesion 4 (3.5%) 2 (7.4%) 2 (2.2%) 0.23 Inflamed mucosa 65 (55.6%) 18 (66.7%) 47 (52.2%) 0.18 Mucosal hemorrhage 26 (22.2%) 9 (33.3%) 17 (18.9%) 0.11 Location Ileocecum 42 (36.2%) 11 (40.7%) 31 (34.8%) 0.57 Ascending and/or transverse 34 (29.3%) 11 (40.7%) 23 (25.8%) 0.13 Descending and/or sigmoid 50 (42.7%) 15 (55.7%) 35 (38.9%) 0.12 Rectum 60 (51.3%) 18 (66.7%) 42 (46.7%) 0.06Data presented as number and percentage, mean plus/minus SD, or median and interquartile range.
A P value < 0.05 indicates statistical significance which are highlighted in bold.
CD4, cluster of differentiation 4; CMV, cytomegalovirus; GI, gastrointestinal; IBD, inflammatory bowel disease; ICU, intensive care unit; WBC, white blood cells.
aAsymptomatic volunteers are the subjects who undergo colonoscopy for colorectal cancer screening without any gastrointestinal symptoms.
Study patient age and sex were not significantly different between the CMV and non-CMV groups. The proportion of patients with HIV infection tended to be higher in the CMV group, but the difference was not statistically significant. Furthermore, the dose of corticosteroids was significantly higher in the CMV colitis group (P = 0.003). The patients with CMV colitis were more seriously ill based on their higher rates of hospitalization, admission to the intensive care unit, acute kidney injury, and lower mean albumin levels. The common presentations in both groups were not different, including diarrhea and lower GI bleeding, with a median duration from symptom onset to hospital presentation of 14 days. Endoscopic findings revealed more ulcerative lesions in the CMV colitis group than in the non-CMV colitis group (88.9% vs 57.8%, respectively; P = 0.002). Among the 20 asymptomatic volunteers, the mean age was 52 years, and 45% were men. The mean age and sex distribution in the control group were not significantly different from the mean age and sex distribution in both of the study groups. All 20 volunteer subjects had normal colonoscopic findings.
Diagnostic performance of stool CMV-PCR, plasma CMV-PCR, and their combination using histopathologic diagnosis as the reference standard
Of the 117 study patients enrolled, 5 underwent colonoscopy twice because of recurrent symptoms, resulting in a total of 122 stool CMV-PCR tests, and 122 plasma CMV-PCR tests. Of those 122 colonoscopies, 27 colonoscopies yielded positive for CMV on histopathology. Table 2 shows the minimum (0th percentile), 25th percentile, median (50th percentile), 75th percentile, and maximum (100th percentile) values of each diagnostic test. As shown in Table 2, the median stool CMV viral load was 2,357 copies/mL (IQR: 0–6,626) in the CMV group, which was significantly higher than the viral load value of 0 copies/ml (IQR: 0–0) in the non-CMV group (P < 0.001). Similarly, the median plasma CMV viral load was significantly higher in the CMV group than in the non-CMV group (345 copies/mL [IQR: 0–25,900] vs 0 copies/mL (IQR: 0–0), respectively; P ≤ 0.001). As shown in Figure 3, the AUC for diagnosing CMV colitis was 0.818 (95% confidence interval [CI]: 0.724–0.911) for the stool CMV-PCR assay and 0.809 (95% CI: 0.715–0.902) for the plasma CMV-PCR assay. There was no significant difference between the stool CMV-PCR AUC and the plasma CMV-PCR AUC (P = 0.854). The identified optimal cutoff values to define a positive CMV finding was 450 copies/mL for the stool CMV-PCR assay and 161 copies/mL for the plasma CMV-PCR assay.
Table 2. - Range of quantitative data specific to cytomegalic cell counts per area of colonic tissue biopsy(cell/mm2) and copies per milliliter from tissue, stool, and plasma CMV-PCR compared among patients with CMV colitis, patients with non-CMV colitis, and asymptomatic volunteers Study group Variables Minimum (0th percentile) 25th percentile Median (50th percentile) 75th percentile Maximum (100th percentile) CMV colitis Cytomegalic cells, cells/mm2 1.46 4.57 6.26 7.97 11.82 Tissue, copies/mL 0 3,040 56,199 979,107 29,463,461 Stool, copies/mL 0 0 2,357 6,626 425,317 Plasma, copies/mL 0 0 345 25,900 283,000 Non-CMV colitis Cytomegalic cells, cells/mm2 0 0 0 0 0 Tissue, copies/mL 0 0 0 0 1,992,358 Stool, copies/mL 0 0 0 0 43,793 Plasma, copies/mL 0 0 0 0 13,400 Asymptomatic volunteers Cytomegalic cells, cells/mm2 0 0 0 0 0 Tissue, copies/mL 0 0 0 0 0 Stool, copies/mL 0 0 0 0 0 Plasma, copies/mL 0 0 0 0 0CMV, cytomegalovirus; PCR, polymerase chain reaction.
 Figure 3.:
 Receiver operating characteristic (ROC) curves to evaluate the sensitivity and specificity of the stool cytomegalovirus polymerase chain reaction (CMV-PCR) assay and the plasma CMV-PCR assay for diagnosing CMV colitis. AUC, area under the curve.
Using the immediately aforementioned cutoff values, 27 stool tests and 23 plasma tests were positive. As shown in Table 3 and Figure 4, stool CMV-PCR alone had a sensitivity and specificity of 70.4% and 91.6%, respectively, whereas the corresponding values for plasma CMV-PCR were 66.7% and 94.7%, respectively. When both tests were combined, positive results for both tests yielded a specificity of 95.8%, which is significantly higher than the 91.6% specificity of stool CMV-PCR alone (P = 0.045), and resulted in a PPV of 78.9% (95% CI: 60.6–97.3). Furthermore, the sensitivity of either positive plasma CMV-PCR or positive stool CMV-PCR was 81.5%, which was significantly higher than the 66.7% sensitivity of positive plasma CMV-PCR alone (P = 0.045), and resulted in a NPV of 94.5% (95% CI: 89.8–99.2). There were 12 inconsistent results between stool CMV-PCR and plasma CMV-PCR. Four of 8 (50%) positive stool CMV-PCR and negative plasma CMV-PCR tests were implicated in a final diagnosis of CMV colitis, and CMV colitis was diagnosed in 1 of 4 (25%) negative stool CMV-PCR and positive plasma CMV-PCR tests. There were no positive results for any stool CMV-PCR or plasma CMV-PCR tests among any of the 20 asymptomatic volunteer subjects.
Table 3. - Diagnostic performance of the 5 evaluated diagnostic modalities Testing modalities Sensitivity (%)aThe highest value for that diagnostic performance parameter.
CI, confidence interval; CMV, cytomegalovirus; PCR, polymerase chain reaction; PPV, positive predictive value; NPV, negative predictive value.
留言 (0)