
記住我
For many patients suffering from severe blood disorders, allogeneic hematopoietic stem cell transplantation (HSCT) is the best chance for a cure. Generally, siblings whose human leukocyte antigen (HLA) genes match those of the patient are the preferred stem cell donors, but only available for about 30% of patients (1). Other patients depend on a successful search for an unrelated donor in the global pool of registered potential stem cell donors.
In unrelated HSCT, the alleles of particular HLA genes have to be matched between patient and stem cell donor to avoid undesired reactions of donor immune cells against the host organism (2–4). HLA genes are located in the major histocompatibility complex (MHC) on the short arm of chromosome 6 and most of these genes are highly polymorphic. As of December 2022, 36,016 HLA alleles were described in the IPD-IMGT/HLA database (5). Because of the proximity of the gene loci in the MHC, the inheritance of HLA alleles is not stochastic but occurs in form of haplotypes with closely linked alleles. HLA allele and haplotype frequencies are population-specific, shaped for example by founder effects of early migration flows, mixing of gene pools of later migration movements, and reproductive and pathogen-driven modes of selection (6–9).
By the end of December 2022, the World Marrow Donor Association (WMDA) listed more than 40 million potential stem cell donors and cryopreserved cord blood units in their database (10). DKMS is a major donor registry with more than 11 million donors in seven countries. By the end of 2022, DKMS donors have donated hematopoietic stem cells from peripheral blood or bone marrow over 105,000 times to patients from 57 countries. In 2018, Fundación de Beneficencia Pública DKMS was founded in Chile. At the end of December 2022, it listed more than 165,000 potential donors.
In the Latin American countries, HSCT activity has been continuously increasing in recent years, but transplant rates and proportion of allotransplants from HLA-matched unrelated donors are still substantially lower compared with that in North America and European regions. The lower HSCT activity is related to the economic resources of the respective countries, but also to the insufficient representation of regional HLA genotypes in the global donor pool (11–14). In 2018, the founding year of Fundación de Beneficencia Pública DKMS, 212 hematopoietic cell transplants performed in Chile were reported to the Latin American Blood and Marrow Transplantation Group (LABMT) activity survey, 50.9% thereof in an allogenic setting. In only 18.5% (n=20) of these allogenic transplantations the donor was unrelated (14).
Chile is a country with a projected population of more than 19.5 million inhabitants in 2022 (15) in western South America, located between the Pacific Ocean in the west and Argentina in the east with the Andean Mountain Range as a natural border. The vast majority of the population inhabits the central third of the country around the capital of Santiago. As a result of occupation and immigration in the course of its history, the population of the present Chile has undergone several demographic shifts. Before the arrival of the Spanish conquerors in the middle of the 16th century, Chile was inhabited by about twenty indigenous peoples, including the Mapuche, Aymara, Quechua and Easter Islanders (16). During the Spanish colonization, migration to Chile was initiated and controlled by the Spanish Empire. Mainly Spanish males migrated and mated with females from indigenous population groups (16, 17). Various indigenous tribes joined forces and succeeded to resist the conquerors in a long-running conflict and to defend parts of their territory in today’s Southern Chile until its occupation by the end of the 19th century (18). During the 19th and 20th century, immigration of different European populations took place after the declaration of independence in 1818; the Chilean government initiated selective entry of Europeans through colonization agencies. A large number of settlers immigrated from England, Ireland and Germany to Chile, but also from France, Italy, Greece, Croatia, and, more recently, from the Middle East (16, 19). Today, Chile is one of the main destination countries for migrants from South American and Caribbean countries (20).
In a 2020 survey, 52% of the Chilean population defined their ethnicity as “White”, 26% as “Mestizo”, 6% as “Indigenous”, and 2% as “Other”, while 14% did not classify themselves in any of these categories (21). A study on the genetic composition of Chilean individuals indicated predominantly European and Native American contributions with a minor African component (17). Ancestry proportions of individual subjects were found to be rather fluid than to occur in distinct steps that would differentiate different subpopulations. Several other studies have been conducted to describe the genetic structure of the Chilean population and its relationship to different South American Native and European populations based on HLA genes (9, 22–26).
In this study, we characterize HLA allele and haplotype frequencies of donors from Fundación de Beneficencia Pública DKMS (from here on referred to as “DKMS Chile”), the first Chilean stem cell donor registry. We highlight differences and similarities between the two major subpopulations of donors with self-assessed “Mapuche” or “non-Indigenous” origin. We further analyze the extent to which the Chilean population will benefit from the existence and further growth of the registry.
2 Subjects and methods2.1 Donor samples and HLA typingThe DKMS Chile donor file included 126,512 potential stem cell donors with high-resolution genotyping for the HLA loci A, B, C, DRB1, DQB1 and DPB1 on March 29, 2022. 70.8% of the donors were female, and 47.2% were between 18 and 30 years old. Information on the ethnic origin of the donors was obtained by self-assessment during the registration process. For this purpose, donors were asked about the country of origin and ethnicity of both their parents. n=118,258 (93.5%) of the registered donors indicated Chile as both parents’ country of origin while the remaining 8,254 donors (6.5%) had at least one non-Chilean parent or did not provide corresponding information (Supplemental Table 1). Of the donors of Chilean origin, n=92,788 (78.5%) specified non-Indigenous as both parents’ ethnic origin (sample CL-NI). Also, 8,766 donors (7.4%) reported indigenous ancestry (Supplemental Table 2), including 1,993 (1.7%) with both parents belonging to the Mapuche ethnicity (sample CL-MP). Almost half of the donors (CL-NI: 47.7%; CL-MP: 49.9%) lived in the Santiago Metropolitan region. We analyzed the sets CL-NI and CL-MP in detail regarding allele frequency (AF) and haplotype frequency (HF).
For comparative analyses, we used 18 reference population samples (Argentinian, Bolivian, Brazilian, Colombian, English, French, German, US Hispanic, Indian, Irish, Italian, Mexican, Peruvian, Polish, Portuguese, Spanish, Turkish, and Venezuelan) with sample sizes between n=326 and n=100,000 individuals (Supplemental Table 3; this table includes also detailed information on the origin of the various population samples). Median and mean sample sizes were n=8,019 and n=33,707, respectively. In addition to South and Central American populations, we particularly considered populations with a connection to the migratory history of Chile (e.g., Spanish) but also some populations that are expected to have rather low genetic relatedness to Chilean individuals (e.g., Indian).
HLA genotyping of all donor samples was performed in a standardized amplicon-based next-generation sequencing workflow on Illumina platforms at DKMS Life Science Lab in Dresden, Germany. Primers were designed to target exons 2 and 3 of HLA-A, -B, -C, -DRB1, -DQB1 and -DPB1 (27, 28). DNA samples were obtained as buccal swabs with the informed consent of the donors.
2.2 Estimation of allele and haplotype frequenciesAllele frequencies (AF) were obtained by counting. Six-locus (HLA-A, -B, -C, -DRB1, -DQB1 and -DPB1) and 5-locus (HLA-A, -B, -C, -DRB1, and -DQB1) haplotype frequencies (HF) were calculated by the Hapl-o-Mat software (29, 30). Hapl-o-Mat estimates HF from population data using an expectation-maximization (EM) algorithm (31). HF provided by Hapl-o-Mat were truncated after a frequency of f=1/(2n) with n being the sample size, thus including only haplotypes with an expected occurrence of at least 1 in the sample. Prior to HF estimation, Hapl-o-Mat converts real-life donor HLA typing data to a homogenous resolution. The final HF and AF resolution levels in the present study are g-groups which combine alleles with synonymous mutations in the relevant exons (HLA class I genes: exon 2 and 3; HLA class II genes: exon 2) under a common allele group name denoted by a trailing “g” (32).
In order to identify alleles with a high specificity for Chilean populations, we defined large frequency difference (LFD) alleles similar to the study by Single et al. (9). For that purpose, we grouped 17 reference populations into four clusters: South and Central America (including Argentina, Bolivia, Brazil, Colombia, Mexico, Peru, and Venezuela), Southwestern Europe (France, Italy, Spain, and Portugal), Northern and Central Europe (England, Germany, Ireland, and Poland), and Others (India and Turkey). We omitted the US Hispanics as reference population because it comprises individuals of Central and South American – including Chilean – origin which would prevent the identification of HLA characteristics specific for Chileans. To qualify as an LFD allele of CL-NI or CL-MP, the respective AF in CL-NI or CL-MP had to be at least three times higher than the mean frequency of that allele in each of the four clusters.
2.3 Linkage disequilibrium, Hardy-Weinberg equilibriumBased on the estimated 6-locus HF, the linkage disequilibrium (LD) coefficient D’ was calculated for each two-locus allele combination of the donor samples CL-NI and CL-MP (33, 34). Significance was tested with Fisher’s exact test. P-values were subjected to Holm-Bonferroni correction for multiple testing. AF for the LD calculations were derived from haplotype frequencies and therefore may differ slightly from the AF determined by counting.
As the EM algorithm requires the underlying population to be in Hardy-Weinberg equilibrium (HWE), we tested for significant deviations from HWE utilizing an extension of Fisher’s exact test based on Guo and Thompson (35). The procedure was applied to the genotypes on g-group resolution level with Arlequin v 3.5 (36). Because large sample sizes as in this study bear the risk that tests indicate significant results without actual relevance (37), deviations from HWE were also evaluated via the effect size statistics Wn (38) and by comparison of the observed and expected homozygosity for all population samples. Wn values were calculated locus-wise on g-group resolution level. Wn values range from 0 to 1, with values near 1 reflecting strong disequilibrium. Values below Wn=0.1 were regarded as indicator for sufficient accordance with HWE. No correction for multiple testing was applied for HWE evaluations since this would bias the results towards accordance with HWE and lead to a loss of sensitivity.
2.4 Genetic distancesGenetic distances (GD) between the 20 samples (CL-NI, CL-MP plus 18 reference populations) were calculated as Cavalli-Sforza and Edwards chord distances (39) for the high-resolution AF of HLA loci A, B, C, DRB1, DQB1 and DPB1. Locus-wise chord distances dj were calculated using the formula dj=2π 2·(1−∑i=1nfi·gi), where n is the total number of alleles and fi and gi are the AF of the two populations. The overall distance for each population pair was computed as D=∑j=1mdj2, where m denotes the number of loci considered, i.e. m=6 in our case. Multidimensional scaling (MDS) was carried out in R 3.6.3 (40) using the cmdscale function. The quality of the distance values’ fit to the graphical representation was evaluated with the goodness-of-fit (GOF) measure, which is based on the eigenvalues of the MDS solution and depends on the number of dimensions used. GOF can take a value between 0 and 1, with higher values indicating a better fit.
2.5 Matching probabilitiesThe probability for a patient from a given patient population to find at least one donor from a given donor population matching in HLA loci A, B, C, DRB1 and DQB1 was calculated as described before (32, 41, 42). We did not consider HLA-DPB1 in the matching probability analyses because a donor matched for the other 5 HLA genes included in this study (“10/10 match”) is usually accepted as a “full match”. To avoid an influence of different sample sizes on the calculated matching probabilities, we drew random samples of n=1,000 individuals from the populations. The analysis was conducted with 17 populations including CL-NI, CL-MP and all reference populations except Argentina, Bolivia, and Venezuela whose sample sizes were too small.
We calculated matching probabilities for three scenarios: (a) donor population CL-NI, 17 different patient populations (including CL-NI und CL-MP); (b) 17 donor populations, patient population CL-NI; and (c) 17 donor populations, patient population CL-MP. Due to the high proportion of non-Indigenous donors in DKMS Chile, the donor population CL-NI served as an approximation for the entire DKMS Chile donor file.
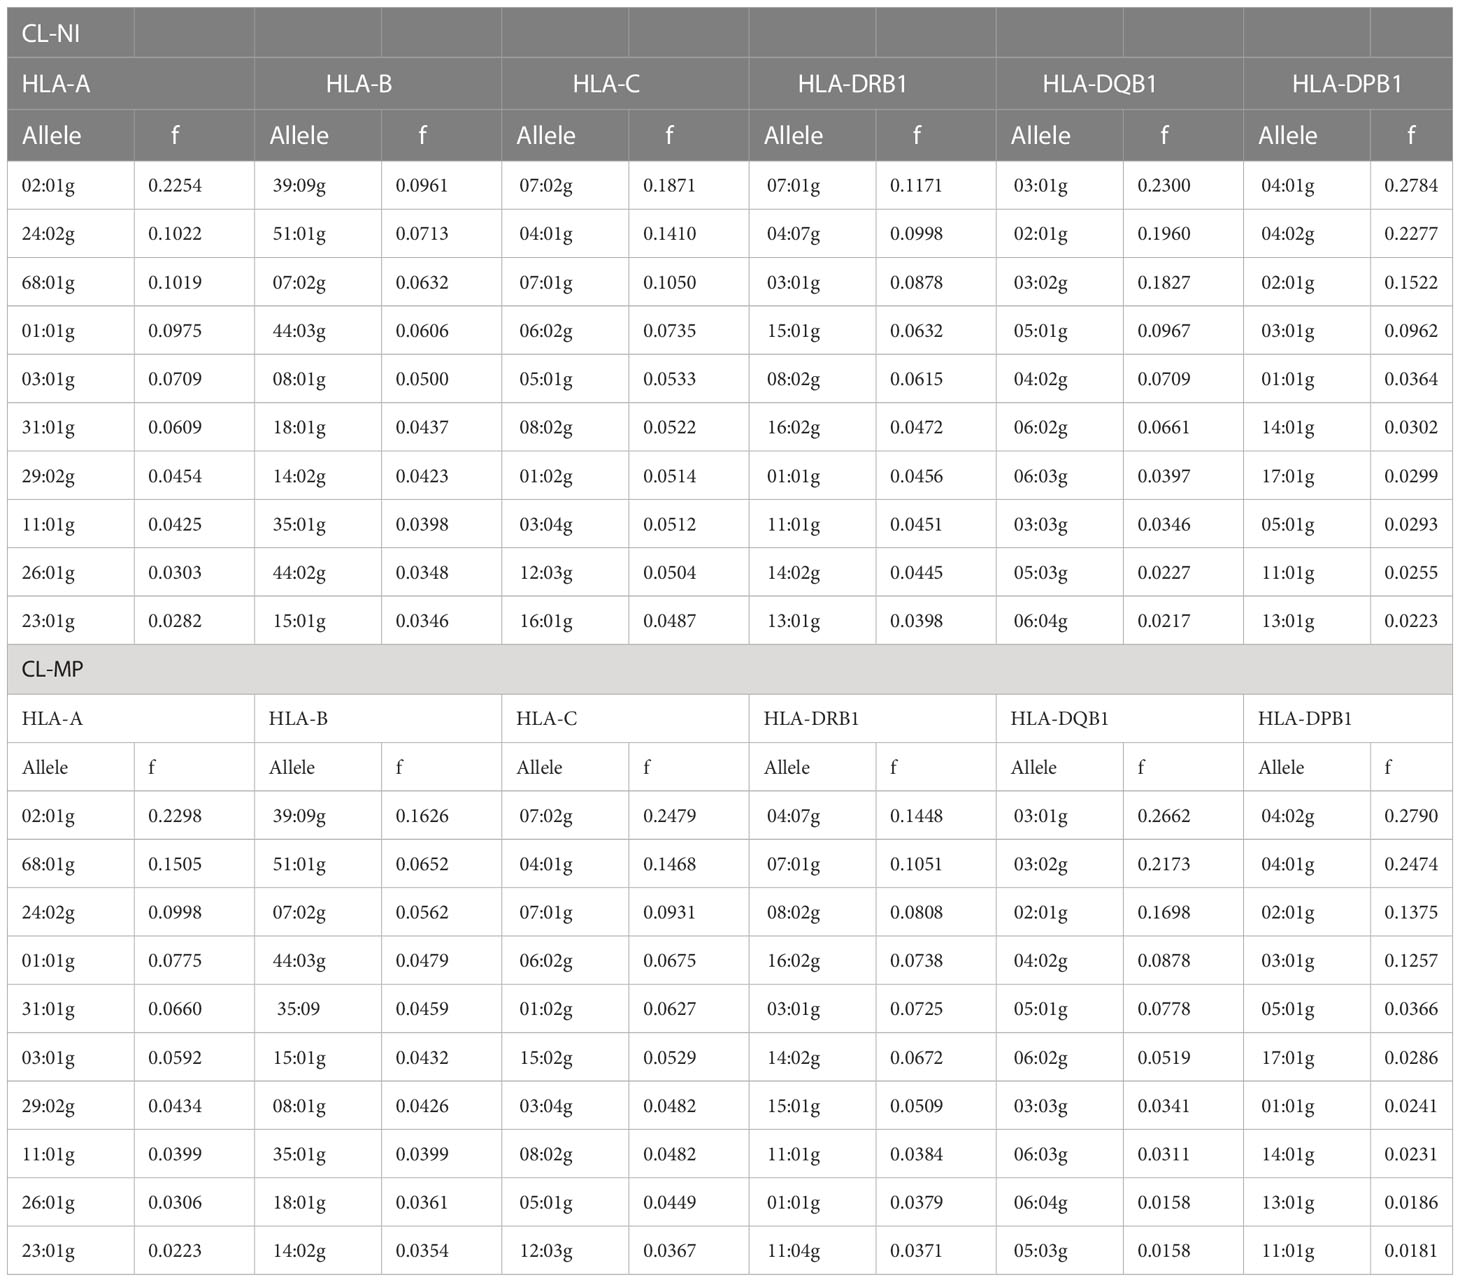
3 Results3.1 AF and HF estimationFor the sample of non-Indigenous individuals (CL-NI), AF obtained by counting resulted in cumulative frequencies of the 10 most frequent alleles between 53.6% (HLA-B) and 96.1% (HLA-DQB1; Table 1, complete allele lists are given in Supplemental Table 4). The number of different alleles ranged from 35 (HLA-DQB1) to 205 (HLA-B). These results indicate a particularly high allelic diversity for HLA-B and a particularly low one for HLA-DQB1. Similar to the CL-NI sample, the cumulative frequency of the 10 most frequent alleles of the smaller CL-MP sample ranged from 57.5% (HLA-B) to 96.8% (HLA-DQB1; Table 1), while the number of alleles ranged from 19 (HLA-DQB1) to 100 (HLA-B; Supplemental Table 5). AF of the 18 reference populations are given in Supplemental Table 6.
Table 1 10 most frequent HLA-A, -B, -C, DRB1, -DQB1 and -DPB1 alleles of non-Indigenous Chilean donors (sample CL-NI, n=92,788) and Mapuche donors (sample CL-MP, n=1,993).
The 12 most frequent HLA alleles were identical for CL-NI and CL-MP in all 6 loci, with the following two exceptions: DRB1*09:01g (#15 in CL-NI), and DRB1*13:02g (#14 in CL-MP) (Supplemental Table 4). The 5 alleles with the largest absolute AF differences between the CL-MP and CL-NI samples were: B*39:09g (Δf=0.066, fCL-NI=0.096, fCL-MP=0.163), C*07:02g (Δf=0.061, fCL-NI=0.187, fCL-MP=0.248), DPB1*04:02g (Δf=0.051, fCL-NI=0.228, fCL-MP=0.279), A*68:01g (Δf=0.049, fCL-NI=0.102, fCL-MP=0.151), and DRB1*04:07g (Δf=0.045, fCL-NI=0.100, fCL-MP=0.145). For each of these alleles, the frequency in the CL-MP sample was higher than in CL-NI. We observed the largest absolute AF difference between both samples with fCL-NI>fCL-MP (and eighth largest overall) for DPB1*04:01g (Δf=-0.031, fCL-NI=0.278, fCL-MP=0.247).
When determining the largest ratios of AF of both population subsamples (the respective larger AF in the numerator), we considered only AF with a difference of at least 0.01 in absolute value in order to exclude random findings. With this constraint, the 5 alleles with the largest AF ratios were: B*39:09g (fCL-MP fCL-NI=1.691, fCL-NI=0.096, fCL-MP=0.163), DRB1*16:02g (fCL-MP fCL-NI=1.562, fCL-NI=0.047, fCL-MP=0.074), DRB1*14:02g (fCL-MP fCL-NI=1.512, fCL-NI=0.044, fCL-MP=0.067), DPB1*01:01g (fCL-NI fCL-MP=1.510, fCL-NI=0.036, fCL-MP=0.024), and B*35:09 (fCL-MP fCL-NI=1.491, fCL-NI=0.031, fCL-MP=0.046). Similar to the analysis of the largest AF differences, the AF were higher in the CL-MP sample for 4 of 5 alleles, with the exception of DPB1*01:01g. The B*39:09g allele is not only the allele with the largest absolute AF difference and the largest AF ratio between both samples, but also the only one that is among the top 5 in both views.
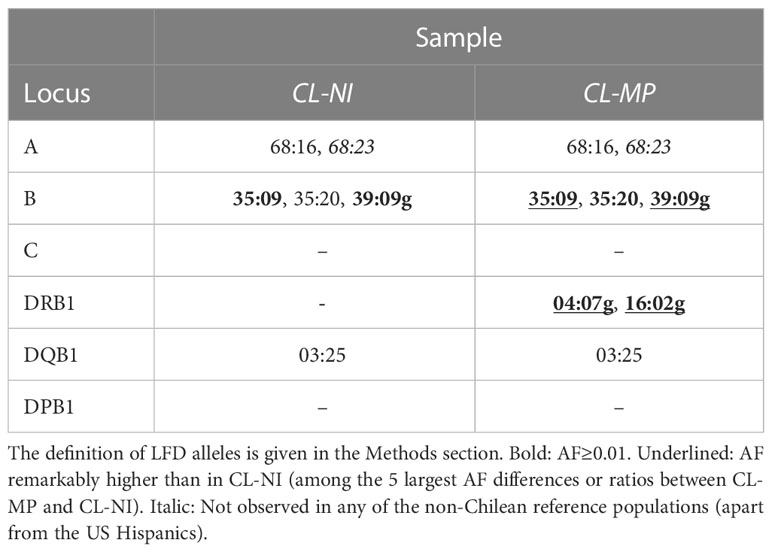
Samples CL-NI and CL-MP comprised 6 (including 2 with f>0.01) and 8 (including 7 with f>0.01) LFD alleles, respectively (Table 2). Four of the aforementioned alleles with a considerable higher occurrence in CL-MP than in CL-NI (B*39:09g, B*35:09, DRB1*04:07g, and DRB1*16:02g) also were LFD alleles of CL-MP and had an AF>0.01 in this population. Thus, these are relevant alleles that are characteristic for the Mapuche population. Interestingly, we could not observe A*68:23 (43) in any of the reference populations apart from the US Hispanics though it was present in both CL-NI and CL-MP, in the latter even with an AF>0.01. The CIWD categories (Version 3.0.0 (44)) of the LFD alleles are given in Supplemental Table 7.
Table 2 Large frequency difference (LFD) alleles of the samples CL-NI and CL-MP.
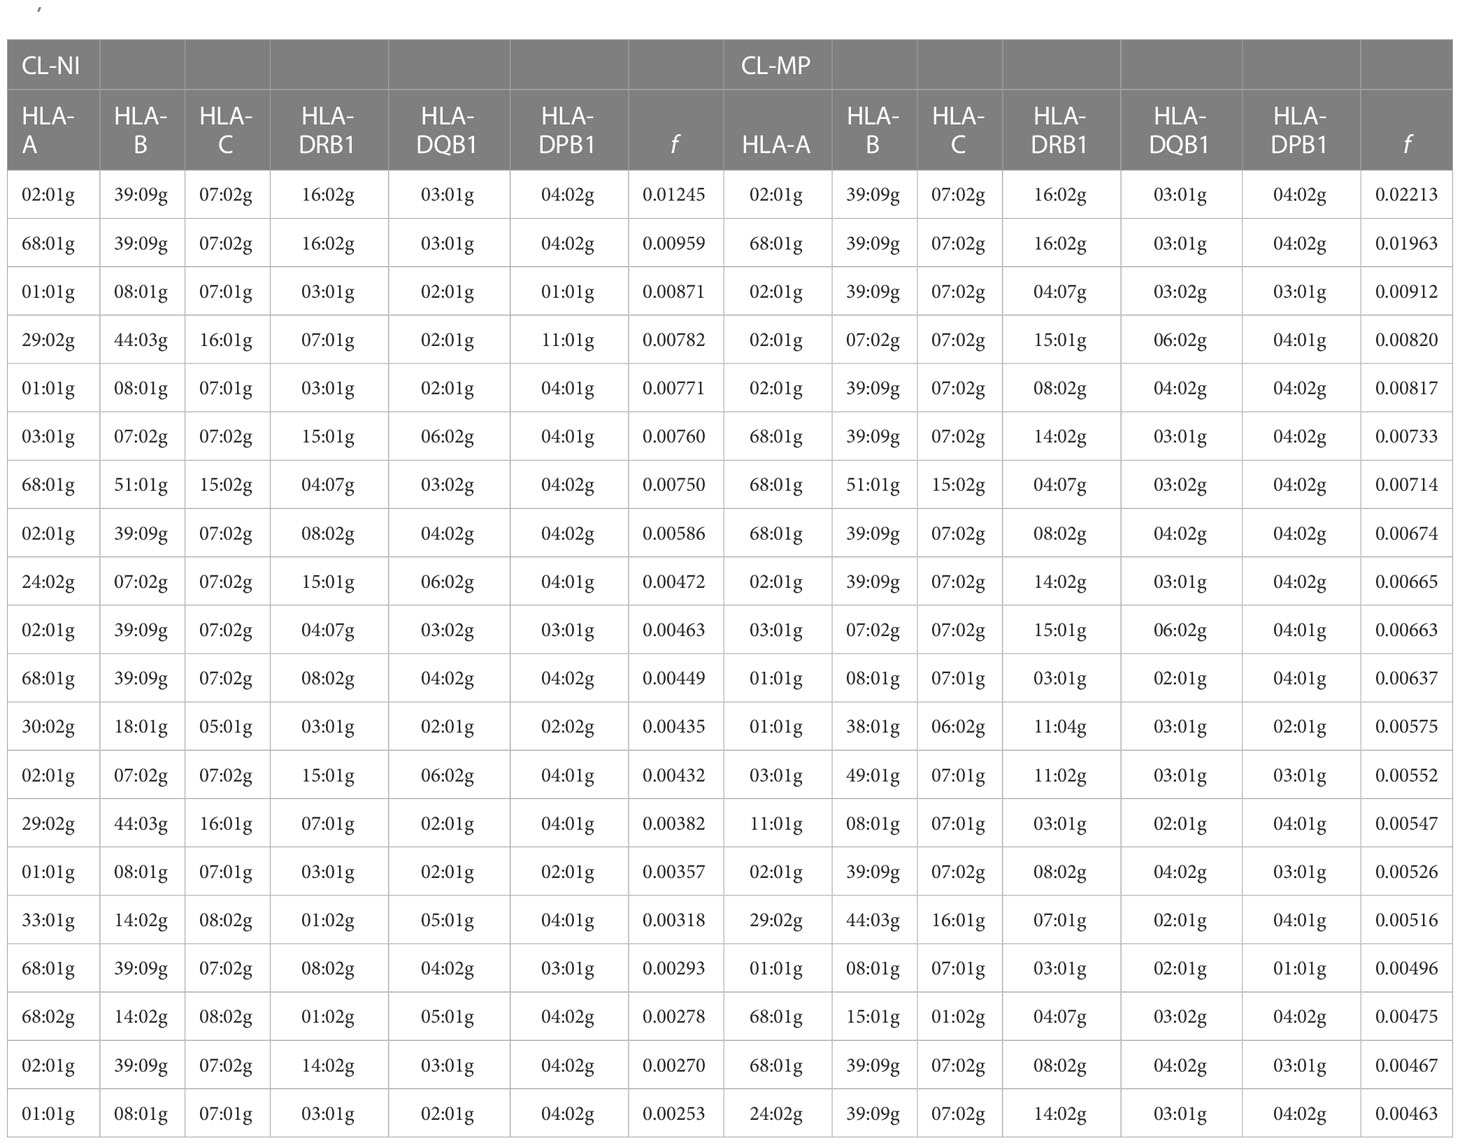
For the sample of non-Indigenous individuals, 6-locus HF estimation resulted in 19,451 haplotypes with a frequency of f ≥ 1/2n, summing up to a cumulated frequency of f = 0.980. The 20 most frequent HLA haplotypes of CL-NI had a cumulated frequency of f = 0.111 (Table 3; Supplemental Table 8A). HF estimation for the smaller Mapuche sample (CL-MP) resulted in 1,835 haplotypes with f ≥ 1/2n (cumulated frequency f = 0.984). The 20 most frequent haplotypes summed up to a cumulated frequency of f = 0.154 (Table 3; Supplemental Table 9A). The results of the 5-locus HF estimations are given in Supplemental Table 8B (CL-NI) and Supplemental Table 9B (CL-MP). Six-locus HF of the 18 reference populations are listed in Supplemental Table 10.
Table 3 20 most frequent 6-locus HLA haplotypes of non-Indigenous Chilean donors (sample CL-NI, n=92,788) and Mapuche donors (sample CL-MP, n=1,993).
Thirteen haplotypes were among the 20 most frequent for both samples, and the two most frequent haplotypes in each sample, namely A*02:01g~B*39:09g~C*07:02g~DRB1*16:02g~DQB1*03:01g~DPB1*04:02g and A*68:01g~B*39:09g~C*07:02g~DRB1*16:02g~DQB1*03:01g~DPB1*04:02g, were identical, albeit with considerably higher HF in CL-MP (see below). Seven of the 20 most frequent CL-NI haplotypes and 10 of the 20 most frequent CL-MP haplotypes included the partial haplotype B*39:09g~C*07:02g. The three haplotypes with the largest absolute HF differences between CL-MP and CL-NI were: A*68:01g~B*39:09g~C*07:02g~DRB1*16:02g~DQB1*03:01g~DPB1*04:02g (Δf=0.0100, fCL-NI=0.0096, fCL-MP=0.0196), A*02:01g~B*39:09g~C*07:02g~DRB1*16:02g~DQB1*03:01g~DPB1*04:02g (Δf=0.0097, fCL-NI=0.0124, fCL-MP=0.0221), and A*68:01g~B*39:09g~C*07:02g~DRB1*14:02g~DQB1*03:01g~DPB1*04:02g (Δf=0.0051, fCL-NI=0.0022, fCL-MP=0.0073). These haplotypes include identical alleles for the HLA loci B, C, DQB1 and DPB1.
The three haplotypes with the largest HF ratios between the CL-MP and CL-NI samples (the respective larger HF in the numerator, only HF with a difference of at least 0.0025 in absolute value considered) were: A*11:01g~B*08:01g~C*07:01g~DRB1*03:01g~DQB1*02:01g~DPB1*04:01g (fCL-MP /fCL-NI=9.535, fCL-NI=0.0006, fCL-MP=0.0055), A*11:01g~B*07:02g~C*07:02g~DRB1*01:01g~DQB1*05:01g~DPB1*04:02g (fCL-MP /fCL-NI=4.533, fCL-NI=0.0007, fCL-MP=0.0033), A*01:01g~B*38:01g~C*06:02g~DRB1*11:04g~DQB1*03:01g~DPB1*02:01g (fCL-MP /fCL-NI=3.513, fCL-NI=0.0016, fCL-MP=0.0058)
(fCL-MP fCL-NI=3.513, fCL-NI=0.0016, fCL-MP=0.0058). Interestingly, all three haplotypes are putatively of European origin. The first of these haplotypes has frequency rank #14 in CL-MP, but only rank #280 in CL-NI.
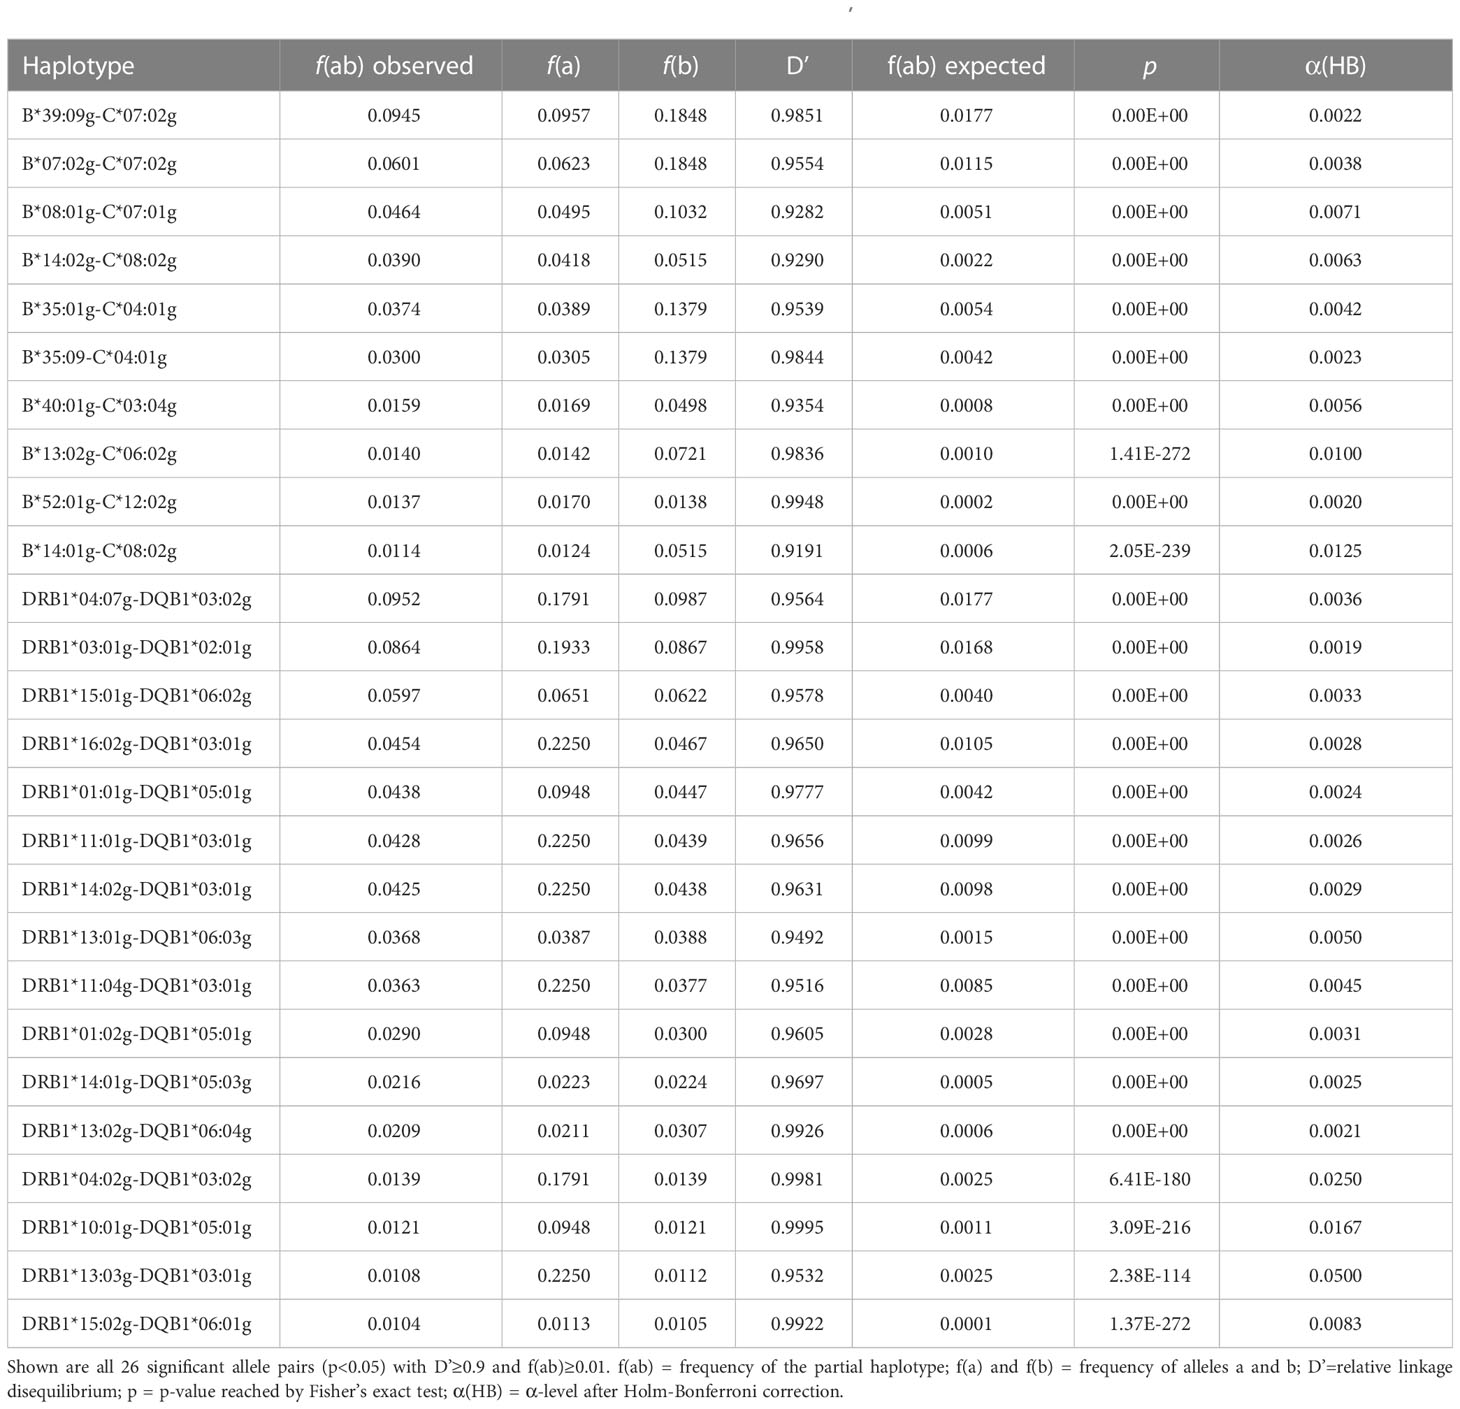
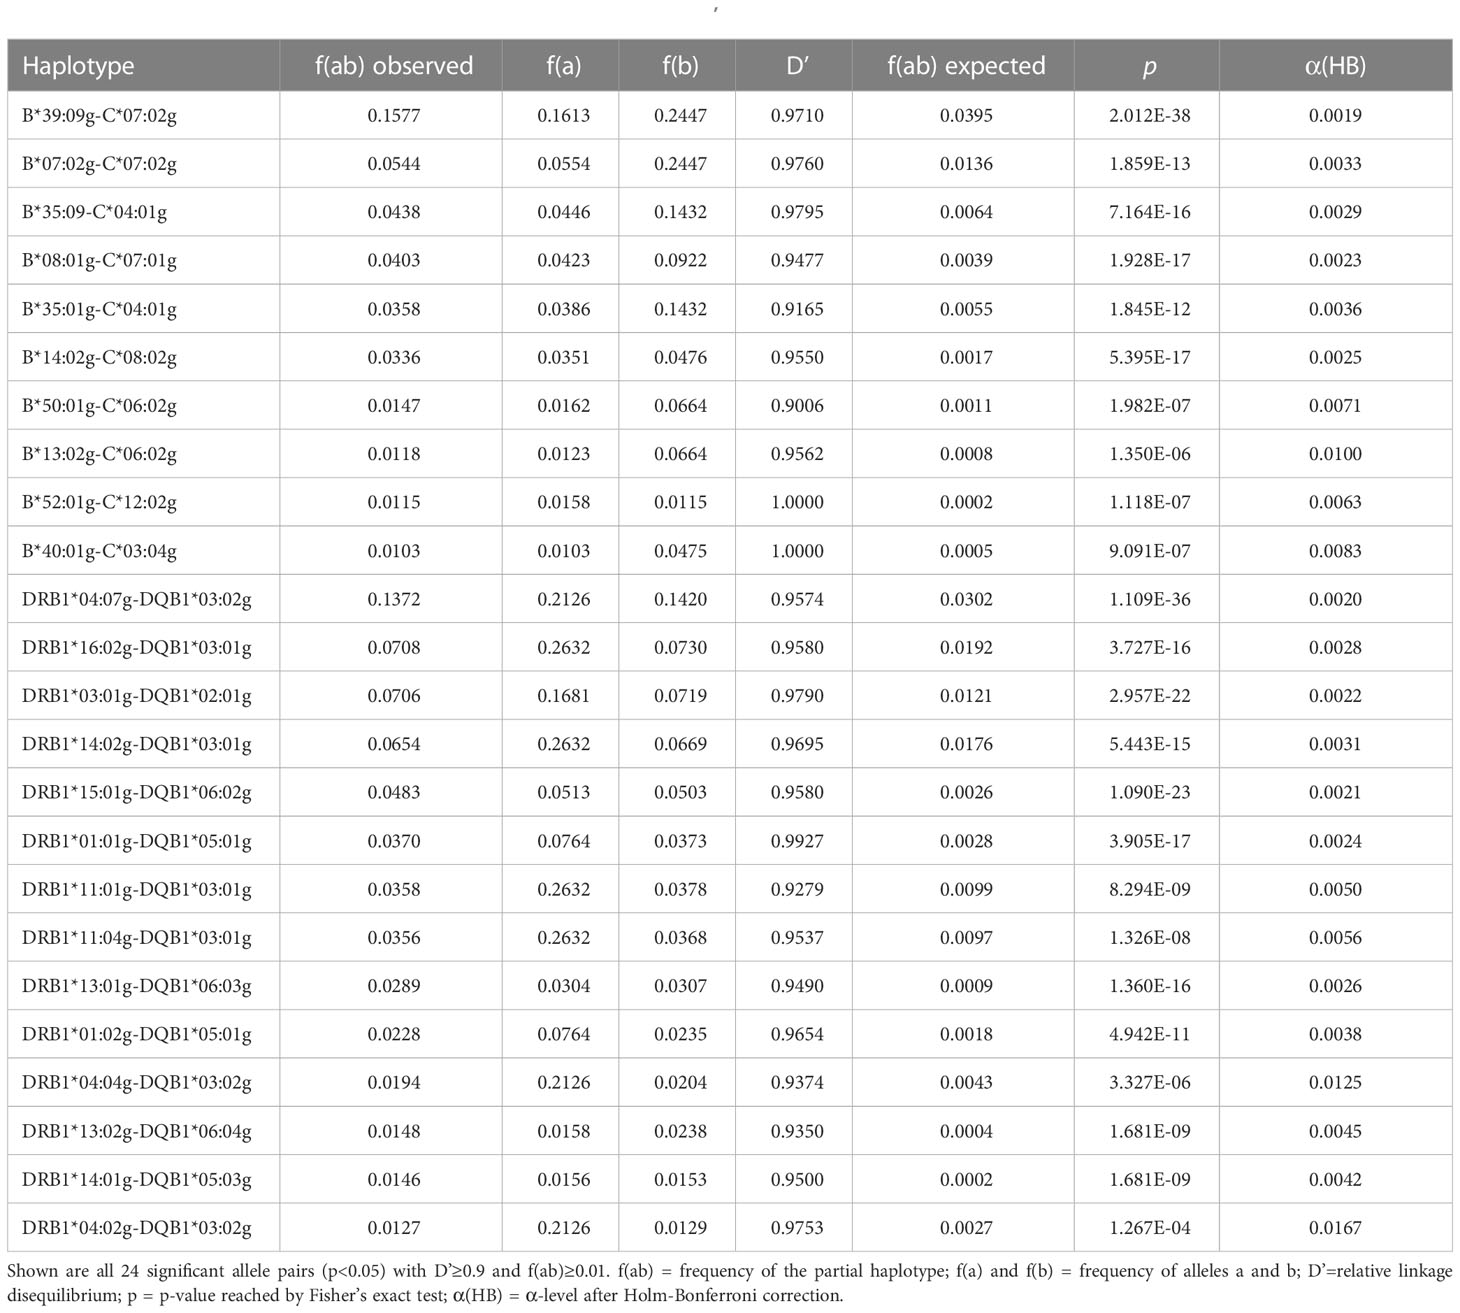
3.2 Linkage disequilibrium, Hardy-Weinberg equilibriumLD was assessed for all allele pairs from the 6-locus haplotypes of donor samples CL-NI (n=137,185 pairs) and CL-MP (n=30,602 pairs). In CL-NI, there were 26 allele pairs with a 2-locus HF of f ≥ 0.01 and strong LD of D’≥ 0.9 among the 10,434 pairs in significant (p<0.05) LD (Table 4; see Supplemental Table 11 for a list of allele pairs with significant LD and a haplotype representation of a least four counts). These 26 allele pairs included 16 DRB1~DQB1 and 10 B~C locus combinations. The pairs with the highest occurrence in the sample were DRB1*04:07g~DQB1*03:02g (fobs=0.0952) and B*39:09g~C*07:02g (fobs=0.0945). The highest D’ values were observed for DRB1*10:01g~DQB1*05:01g (D’=0.9995), followed by DRB1*04:02g~DQB1*03:02g (D’=0.998) and DRB1*03:01g~DQB1*02:01g (D’=0.996). The allele pair B*39:09g~C*07:02g showed both a high frequency and a strong LD (D’=0.985).
Table 4 2-locus linkage disequilibria of non-Indigenous Chilean donors (sample CL-NI, n=92,788).
In the CL-MP sample, 872 pairs were in significant LD, including 24 with a 2-locus HF of f ≥ 0.01 and D’≥ 0.9 (Table 5; see Supplemental Table 12 for a list of allele pairs with significant LD and a haplotype representation of a least four counts). Of these 24 pairs, 14 were DRB1~DQB1 and 10 B~C locus combinations. Again, the two most frequent allele pairs were B*39:09g~C*07:02g (fobs=0.1577) and DRB1*04:07g~DQB1*03:02g (fobs=0.1372), here with an even higher frequency than in CL-NI. B*52:01g-C*12:02g (D’=1) and B*40:01g-C*03:04g (D’=1) showed the strongest LD, followed by DRB1*01:01g-DQB1*05:01g (D’=0.993).
Table 5 2-locus linkage disequilibria of Mapuche donors (sample CL-MP, n=1,933).
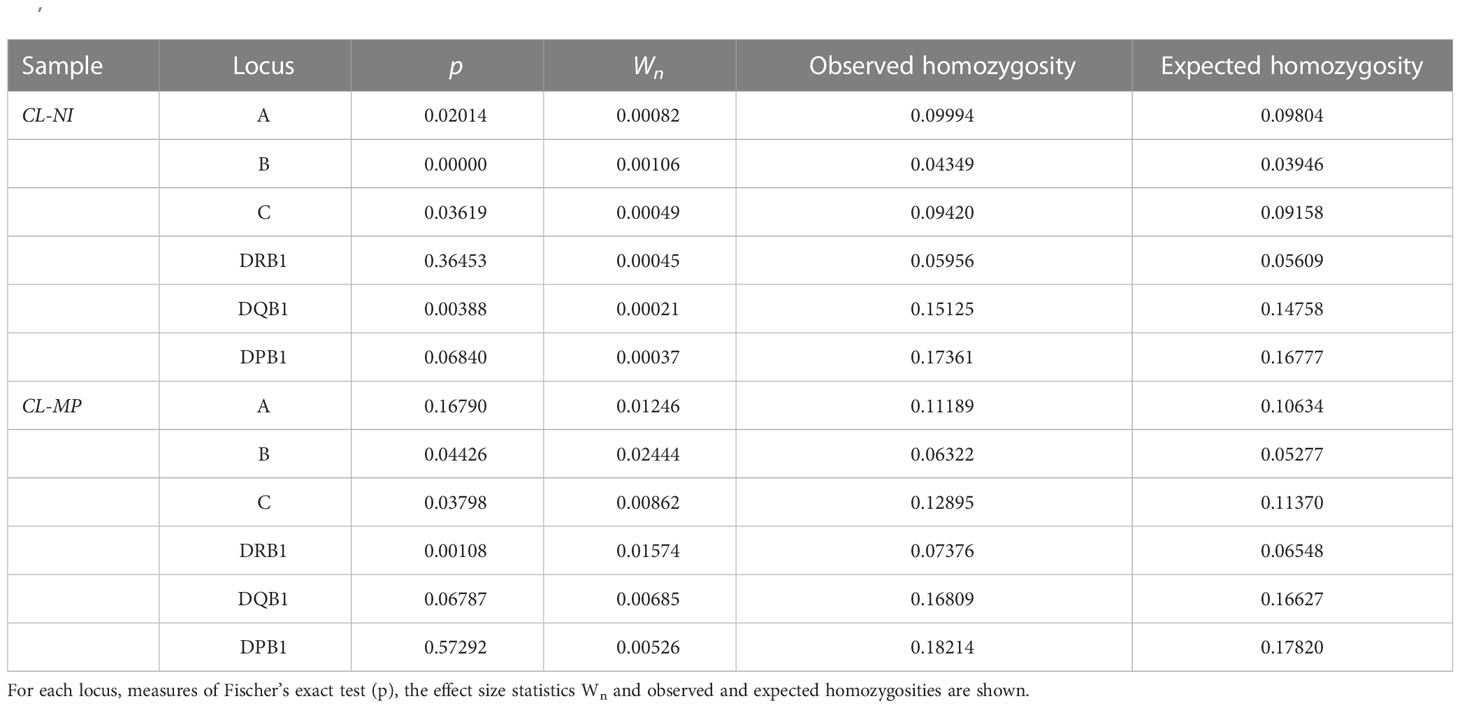
The sample of non-Indigenous Chilean individuals (CL-NI) displayed significant deviations from HWE for four HLA loci (A, B, C and DQB1) in the exact test, the Mapuche sample (CL-MP) for three HLA loci, namely B, C and DRB1 (Table 6, see Supplemental Table 13 for results of HWE tests for all 20 population samples). However, effect size values Wn were generally small with Wn=0.024 for HLA-B in CL-MP being the highest observed value, thus indicating only moderate deviations from HWE. Furthermore, we observed an excess homozygosity for all loci, and it has been shown that deviations from HWE towards excess homozygosity are not detrimental for HF estimation using the EM algorithm (45). Taken together, the results of the HWE tests are not a constraint for the analyses performed in this work with samples CL-NI and CL-MP.
Table 6 Results of Hardy-Weinberg equilibrium tests for non-Indigenous Chilean donors (sample CL-NI, n=92,788) and Mapuche donors (sample CL-MP, n=1,993).
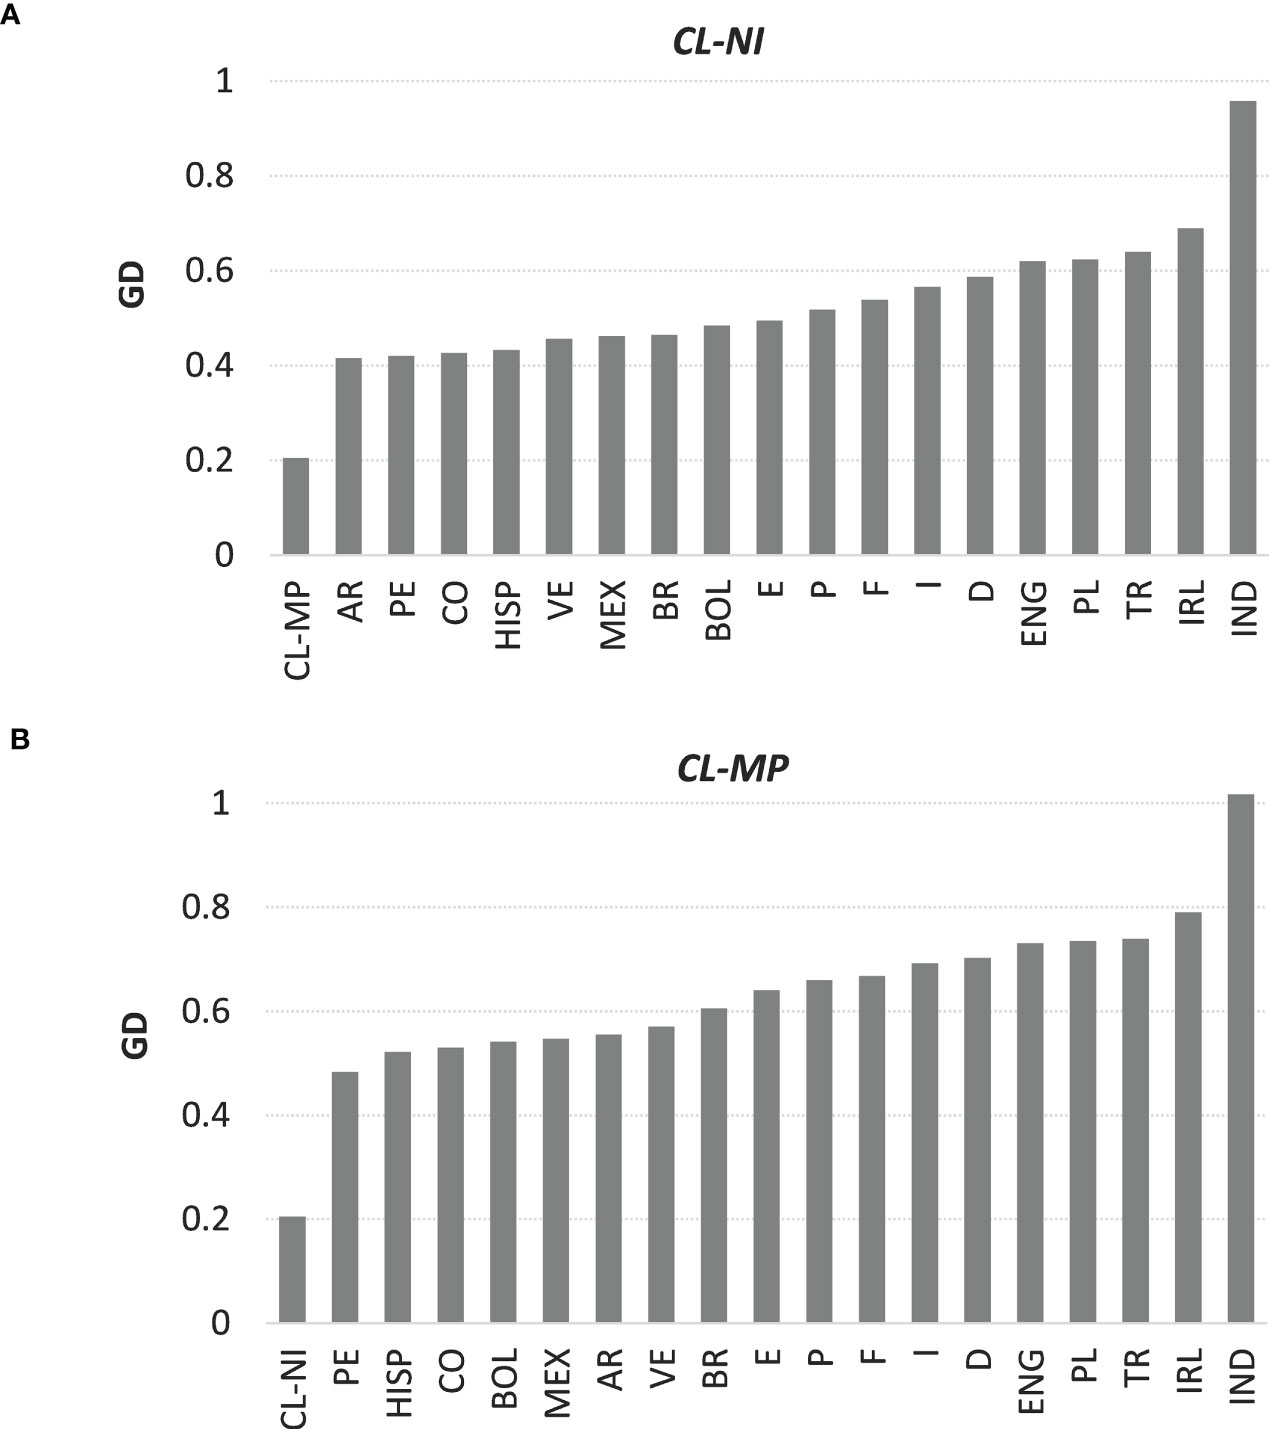
3.3 Genetic distancesThe overall GD between non-Indigenous and Mapuche individuals from Chile was d=0.205 (see Supplemental Table 14 for GD overall and single-locus results, Figure 1 as graphical representation of overall distances of CL-NI and CL-MP to the respective other populations). This was the fourth smallest distance we observed, behind the distances between France and Germany (d=0.157), Portugal and Spain (d=0.168), and England and Ireland (d=0.175). Apart from the distance to the respective other Chilean subpopulation, CL-NI had the smallest GD to Argentina (d=0.416), Peru (d=0.420) and Colombia (d=0.427), CL-MP to Peru (d=0.483), the US Hispanics (d=0.522) and Colombia (d=0.530). We observed the largest distances of CL-NI and CL-MP to India (d=0.958 for CL-NI, d=1.017 for CL-MP), Ireland (d=0.690 for CL-NI, d=0.790 for CL-MP), and Turkey (d=0.639 for CL-NI, d=0.740 for CL-MP). For each of the 18 reference populations, the distance to CL-NI is smaller than to CL-MP. Distances calculated for the individual loci followed the described general pattern of the overall GD, whereby the order of the respective populations varied in detail.
Figure 1 Genetic distances of samples (A) CL-NI and (B) CL-MP to the respective other 19 population samples. Shown are Euclidian overall values of Cavalli-Sforza and Edwards chord distance over the six loci HLA-A, -B, -C, DRB1, -DQB1, and -DPB1. Abbreviations for the populations: CL-NI=Chile non-Indigenous, CL-MP=Chile Mapuche, AR=Argentinian, BOL=Bolivian, BR=Brazilian, CO=Colombian, D=German, E=Spanish, ENG=English, F=French, HISP=US Hispanics, I=Italian, IND=Indian, IRL=Irish, MEX=Mexican, P=Portuguese, PE=Peruvian, PL=Polish, TR=Turkish, VE=Venezuelan.
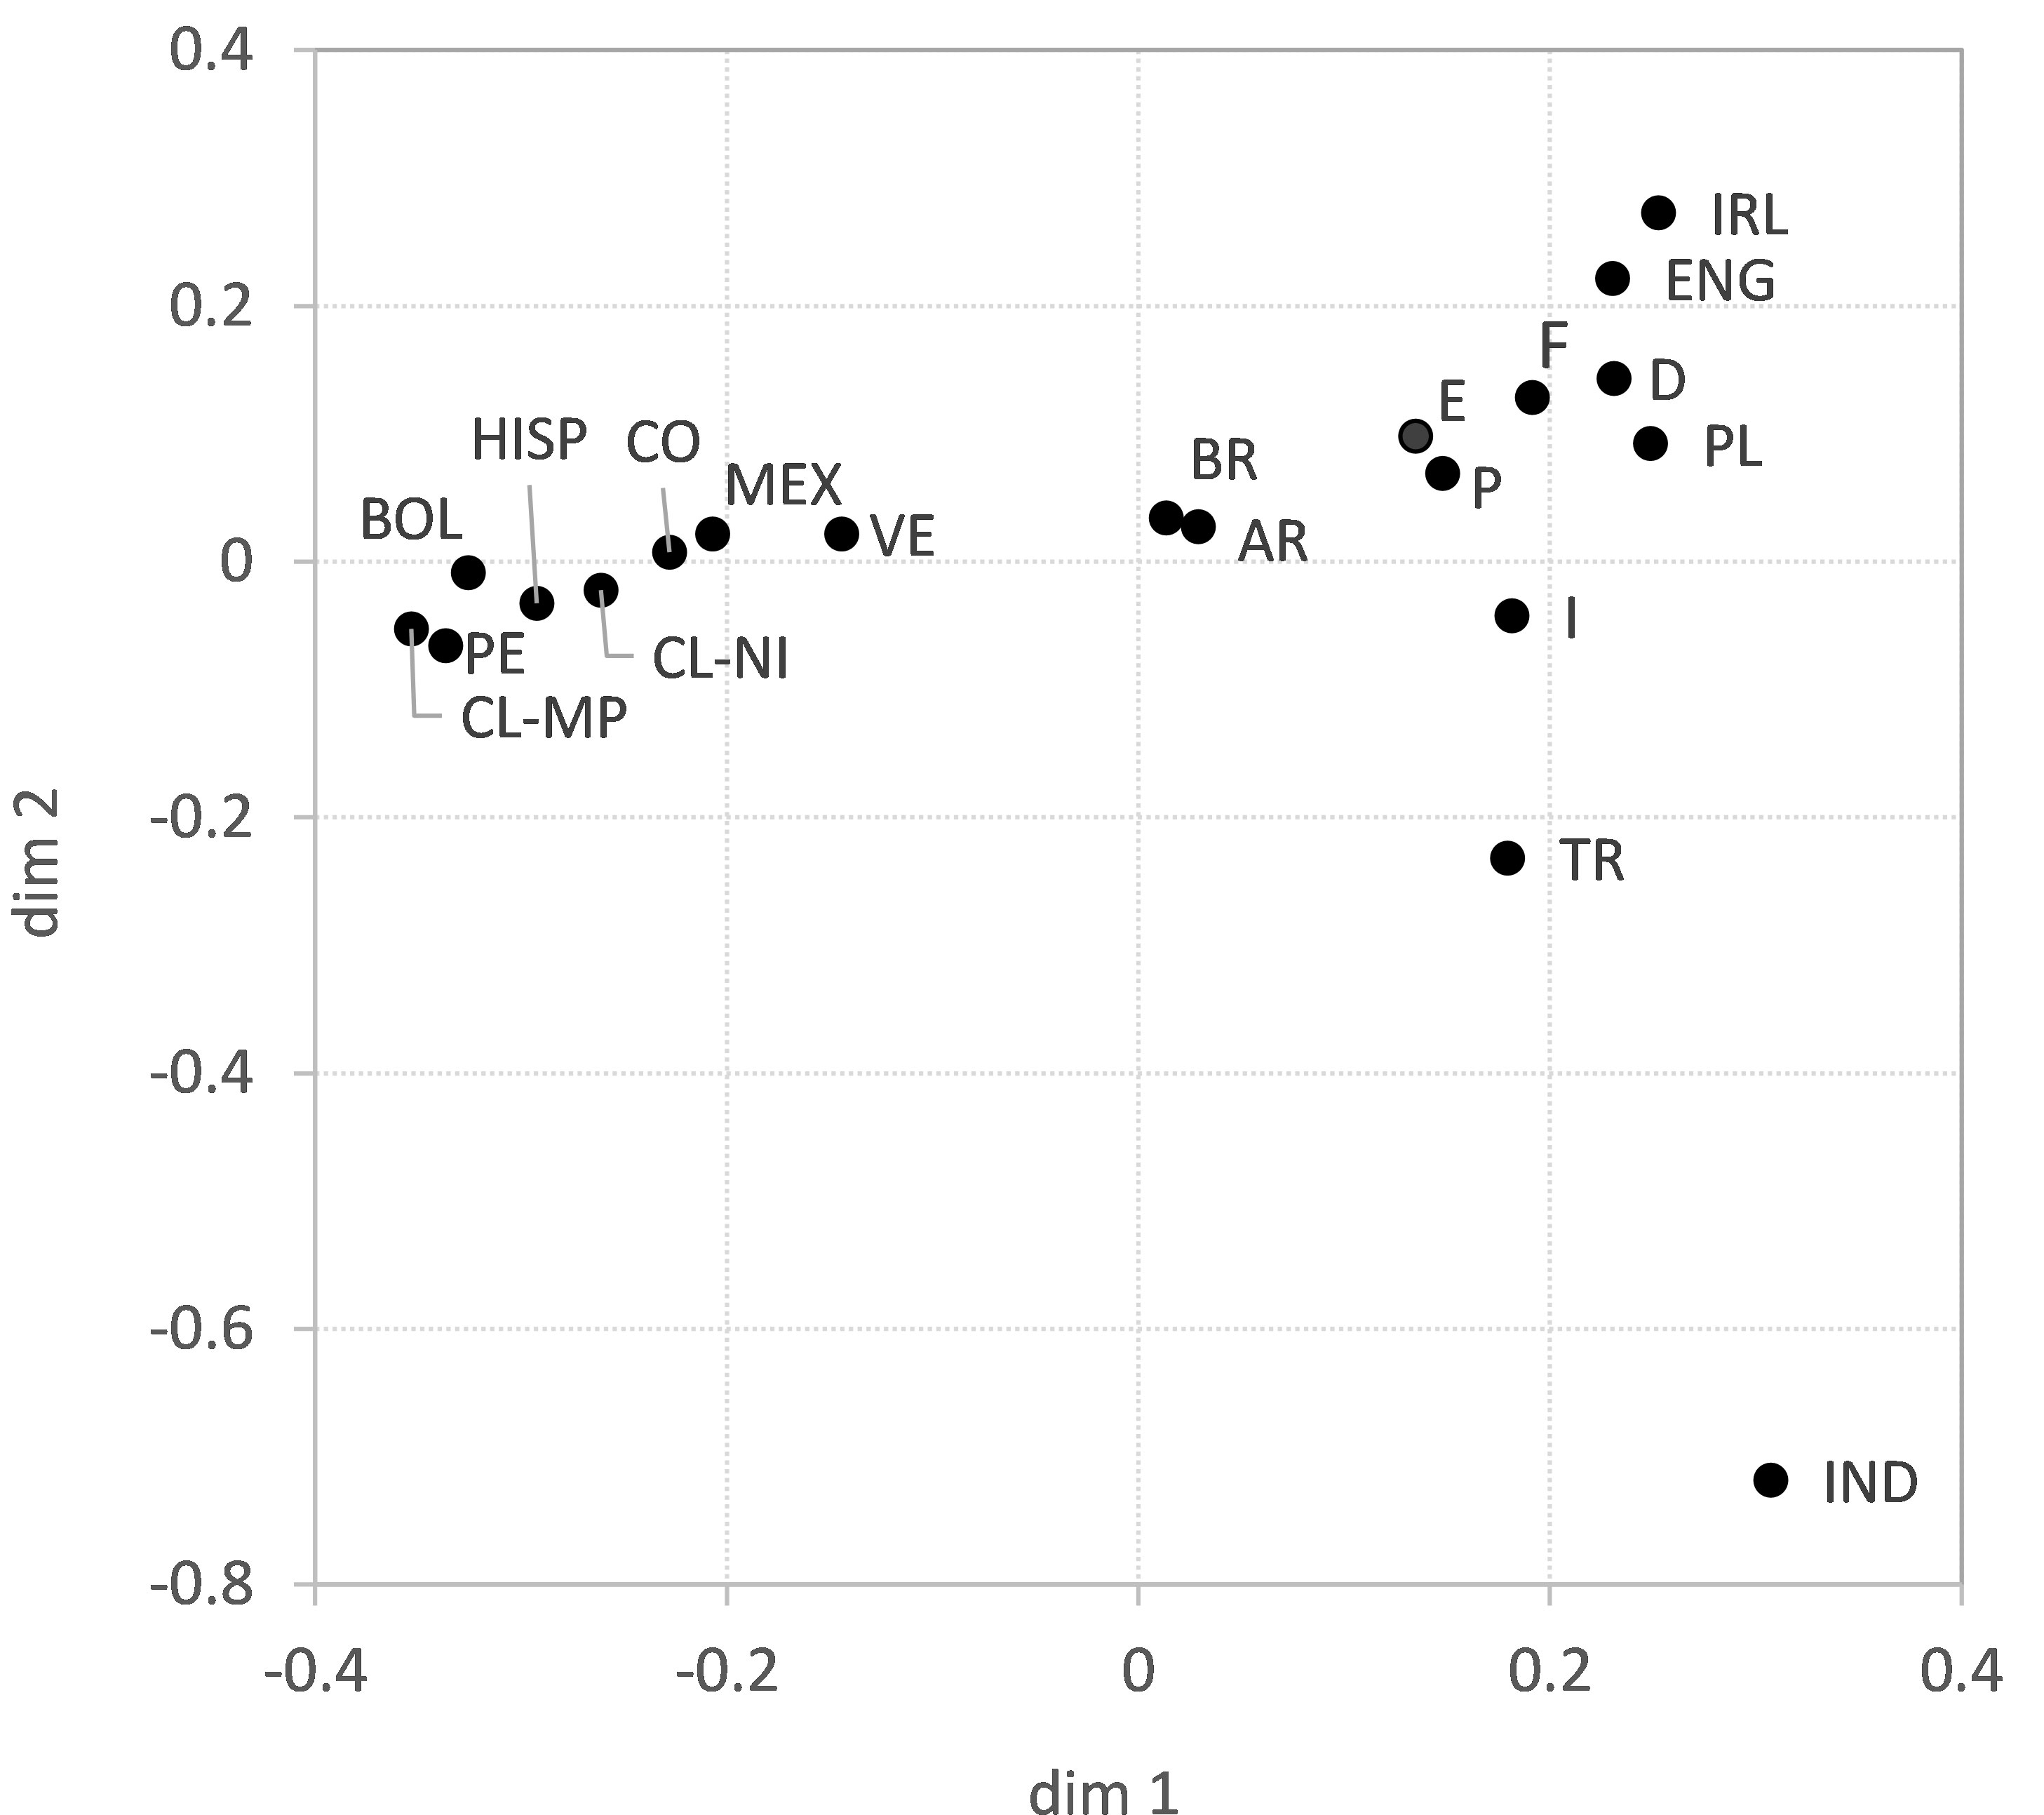
The above results suggest a decisive influence of geographic location on GD. This is supported by the two-dimensional GD visualization using multidimensional scaling (Figure 2). In the upper right part of the figure, the European populations cluster, with the Southern European populations being closer to the Southern and Central American populations than those from Western and Central Europe. The larger distances from CL-MP to the reference populations compared with CL-NI are also evident here, with the exception of the populations from Bolivia and Peru, which are closer to CL-MP in the figure. Also, the relatively close proximity of CL-NI and CL-MP to Argentina, evident in the genetic distances, is not appropriately reflected in the two-dimensional MDS. The GOF value of the shown visualization is 0.569 (Dimensions 1 and 2 explain 33.3% and 23.6% of the variance, respectively) thus indicating only a moderate fit of the data.
Figure 2 Genetic distances (Euclidian overall distances computed from single-locus Cavalli-Sforza and Edwards chord distances) of samples CL-NI, CL-MP and 18 reference population samples visualized by multidimensional scaling. Dimensions 1 and 2 explain 33.3% and 23.6% of the variance, respectively. Abbreviations for the populations: CL-NI=Chile non-Indigenous, CL-MP=Chile Mapuche, AR=Argentinian, BOL=Bolivian, BR=Brazilian, CO=Colombian, D=German, E=Spanish, ENG=English, F=French, HISP=US Hispanics, I=Italian, IND=Indian, IRL=Irish, MEX=Mexican, P=Portuguese, PE=Peruvian, PL=Polish, TR=Turkish, VE=Venezuelan.
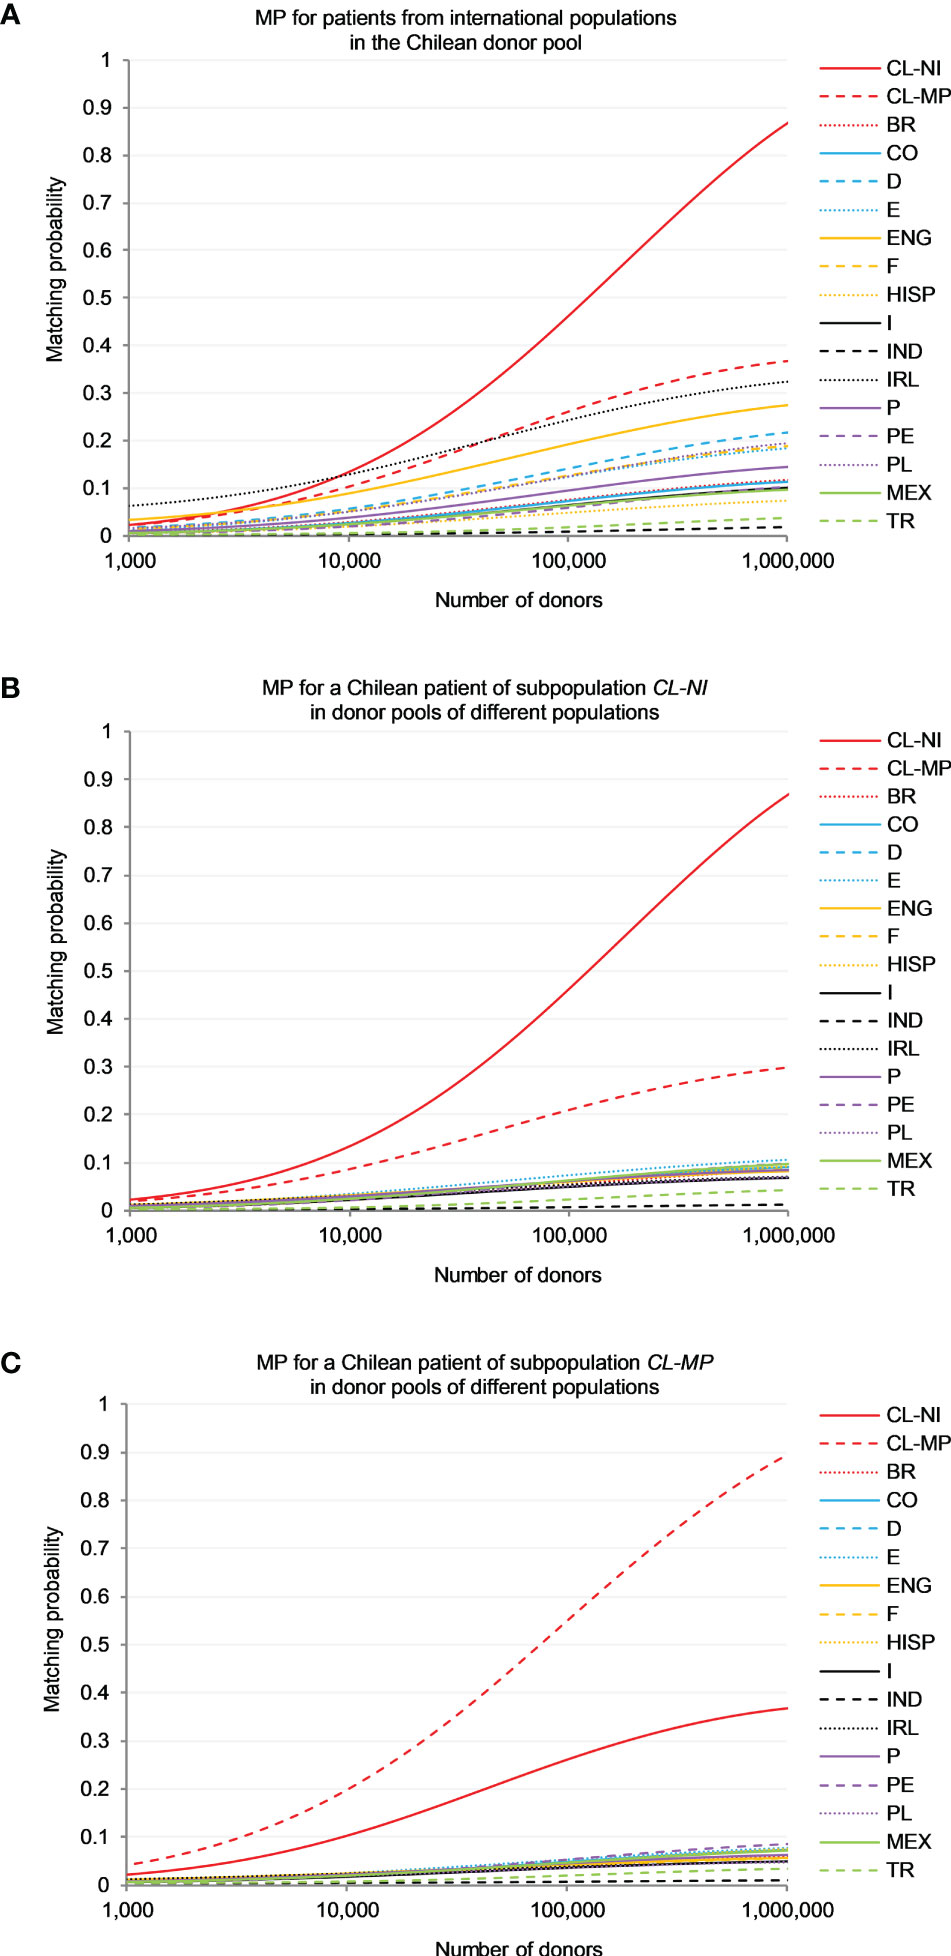
3.4 Matching probabilities5-locus (HLA-A, -B, -C, -DRB1 and -DQB1) high-resolution MP were calculated for patients from 15 reference populations searching in the Chilean donor pool, represented by population sample CL-NI (Figure 3A), and for non-Indigenous (CL-NI, Figure 3B) and Mapuche (CL-MP, Figure 3C) patients searching in virtual pools of donors from these 15 populations (see Supplemental Table 15 for MP values at different registry sizes). In the following description, all MP values refer to a donor registry size of n=100,000 unless specified otherwise.
Figure 3 Matching probability (MP) to find a 10/10-matched unrelated donor. (A) MP for patients from different international populations in the Chilean donor pool (sample CL-NI). (B) MP for a Chilean patient of subpopulation CL-NI in donor pools of different populations. (C) MP for a Chilean patient of subpopulation CL-MP in donor pools of different populations. Abbreviations for the populations: CL-NI=Chile non-Indigenous, CL-MP=Chile Mapuche, BR=Brazilian, CO=Colombian, D=German, E=Spanish, ENG=English, F=French, HISP=US Hispanics, I=Italian, IND=Indian, IRL=Irish, MEX=Mexican, P=Portuguese, PE=Peruvian, PL=Polish, TR=Turkish.
For patients from both Chilean subpopulations the chances of finding a matching stem cell donor were by far greatest in a registry of donors from their own population (e.g. p=0.465 for CL-NI and p=0.554 for CL-MP; Figures 3B, C), followed by a registry of donors from the respective other Chilean subpopulation (p=0.210 for CL-NI patients and CL-MP donors and p=0.263 for the opposite scenario).
In a direct comparison of the two matching scenarios with specific focus on CL-NI individuals (Figures 3A, B), it was evident that the MP curves of the reference populations for the scenario with CL-NI donors spread out significantly more than the corresponding curves for the scenario with CL-NI patients. For example, for a CL-NI donor registry the largest MP observed for non-Chilean reference populations were p=0.245 (Ireland), p=0.193 (England) and p=0.142 (Germany). In contrast, the three largest MP occurring for CL-NI patients searching in donor registries with non-Chilean donors were p=0.073 (Spain), p=0.064 (Mexico) and p=0.062 (Colombia, France, Portugal and Peru), i.e., significantly lower. It was also noticeable that the countries with particularly high MP values in the scenario with CL-NI donors, e.g., Ireland, England, and Germany, have rather large GD to CL-NI (Figure 1; Supplemental Table 14). This is counterintuitive to some extent because one might expect registered donors to be particularly beneficial for patients from genetically closely related populations.
To understand the mechanisms underlying these results, it is helpful to look at the genotypes that can be formed for each population from the population-specific haplotype frequencies. The cumulative frequency of genotypes shared between donor and patient population in the patient population is the upper limit for the MP, because for patients with a genotype not present in the donor population, in principle no matching donor can be found in this population. With increasing registry size, the MP approach this upper limit. Therefore, there is a high correlation between MP and cumulative frequencies of shared genotypes in the patient populations, especially for large donor registry sizes. In our data, this holds for the scenario “Donors from CL-NI, patients from various populations” (Spearman’s ρ=0.990; Figure 3A) as well as for the scenario “Donors from various populations, patients from CL-NI” (Spearman’s ρ=0.934; Figure 3B) at registry size n=100,000.
For further illustration, we use the example of the CL-NI and Irish (IRL) populations (Supplemental Table 16). Of all populations considered, the fewest genotypes can be formed for IRL from the haplotypes obtained with the EM algorithm, namely g=228,127. Since the sample size in this analysis was uniform for all populations, genotype number and genetic diversity are positively correlated. The corresponding value for CL-NI is g=474,985 while the number of shared genotypes is g=10,362. These shared genotypes have a cumulative frequency of f=0.338 in the IRL population, but only of f=0.073 in CL-NI. The low intra-population diversity of our IRL sample and the fact that the shared genotypes have a significantly higher frequency in IRL than in CL-NI are well in line with the insularity of Ireland and the significant migration from Ireland to Chile. Consistent with the cumulative frequencies of the shared genotypes, the MP for CL-NI donors and IRL patients is p=0.245 for n=100,000 and p=0.325 for n=1,000,000. In the opposite scenario with IRL donors and CL-NI patients, the corresponding values are p=0.054 (n=100,000) and p=0.071 (n=1,000,000).
4 DiscussionFrom a data set of 126,512 potential hematopoietic stem cell donors registered with DKMS Chile, we analyzed two population subsets, namely donors with self-assigned non-Indigenous (CL-NI, n=92,788) and Mapuche (CL-MP, n=1,993) origin. We examined specific characteristics of HLA allele and haplotype distributions based on typing information of the loci A, B, C, DRB1, DQB1 and DPB1 and related it to samples from 18 reference populations.
Previous knowledge of Chilean HLA AF and HF is limited and mostly restricted to data from rather small population samples of confined regions. The so far largest of the studies analyzed genotypic data of n=920 umbilical cord blood units of donors from Santiago with predominantly Western European ancestry (25). This analysis is limited to loci HLA-A and -B at low (antigenic) resolution and HLA-DRB1 at high resolution. When comparing the results at this resolution level, we see good agreement between the AF of the cord blood study and the CL-NI subpopulation in this work. For example, for each HLA locus the five most frequent alleles are identical. However, the allele frequency differences vary between 0.2% (B*35) and 39.3% (DRB1*04:07g). The closest concordance of AF is seen in locus HLA-A. The two most frequent haplotypes of both population samples are the same, while the third most frequent haplotype in the previous study (A*02~B*39~DRB1*08:02) only reaches rank 7 in this study, and our third most frequent haplotype (A*02~B*39~DRB1*16:02) ranks 12th in the cord blood bank study. A further study counted high-resolution HLA-DRB1 AF on a Chilean population of n=510 individuals from Talca, a city 250 km south of Santiago, and HLA-A, -B, and -C high resolution AF for n=160 thereof (26). The agreement with the AF of the CL-NI subpopulation in our study is only moderate. The Top 3 alleles are identical for loci HLA-A and -C, but with a change in rank order between alleles A*68:01g and A*24:02g (Δf= 1.4% and -0.2%, respectively). Loci HLA-B and -DRB1 show greater differences in allele ranking and frequency. Two additional studies focusing specifically on Mapuche HLA allele and haplotype distributions in samples of n=104 and n=66 individuals from Cañete, a city in the Biobío region 600 km south of Santiago, found the same prevalent alleles as we did in our CL-MP sample, but some frequencies differ considerably (23, 24). While, for example, DRB1*04:07g is the most frequent DRB1 allele (f=13.9%) in our study, it only reaches 2.9% and 3.0% in the former studies. In contrast, the DRB1*04:03 allele, found at remarkably high frequencies of 31.7% (24) and 18.4% (23), had only an AF of f=1.2% in our study. In another study with a small sample of n=20 Huilliche, a Mapuche subgroup in southern Chile (9), DRB1*04:07g was again the most frequent DRB1 allele with f=27.5%. The comparison between our study and the former Mapuche population studies is hampered by the different sampling approaches. The previous studies were limited to very small and geographically restricted groups of individuals, whereas our study includes all donors from DKMS Chile who reported Mapuche origin for both parents and thus may represent an admixture of different Chilean Mapuche subpopulations. Previous studies discussed that discrepancies in allele frequencies may also result from nonrandom mating in isolated groups (46, 47).
Our CL-MP sample included 8 LFD alleles, namely A*68:16, A*68:23, B*35:09, B*35:20, B*39:09g, DRB1*04:07g, DRB1*16:02g and DQB1*03:25. All of these, with the exception of the two DRB1 alleles, were also LFD alleles of the CL-NI sample. We identified 4 of the LFD alleles (B*35:09, B*39:09g, DRB1*04:07g and DRB1*16:02g) as relevant and characteristic for our Mapuche sample because their AF in CL-MP were – with the minimum value of f=0.046 for B*35:09 – substantially greater than f=0.01 and particularly different from that in CL-NI. B*39:09g and DRB1*04:07g were even the most frequent alleles of their respective locus with f=0.163 and f=0.145, respectively.
Our definition of LFD alleles is similar to that of Single et al. (9). Nevertheless, due to the different choice of references, there are also clear differences between the two approaches. We intended to identify alleles that are particularly typical of Chile, i.e., that stand out in frequency from other populations, including South and Central American populations. In contrast, the earlier study aimed to identify alleles that are considerably more frequent in Native American populations than in other world regions. The fact that the LFD alleles identified in our study - the exception DQB1*03:25 is due to the fact that the Single et al. study did not include the DQB1 locus - are a subset of the LFD alleles identified in the earlier study suggests that the alleles are Native American in origin. A*68:16 and A*68:23, e.g., identified by us as LFD alleles of CL-MP and CL-NI, were described by Single et al. as “endemic”, i.e. absent from all world regions outside the Americas. This is confirmed by our results, as we found them outside Chile only in the Peruvian (A*68:16) and US Hispanics (both A*68:16 and A*68:23) population samples.
The choice of our reference populations was also driven by the number of registered DKMS donors in the different populations. In particular, the absence of other Native American reference populations makes it difficult to identify specific Mapuche alleles. Similarly, the absence of sub-Saharan West African populations prevents the assessment of an African contribution to today’s Chilean population, which, however, is estimated to be very minor (17). To balance this deficiency, we examined the global occurrences and frequencies of our LFD alleles in other populations in the literature and the Allele Frequency Net Database (AFND), a repository for immune-related gene polymorphisms in worldwide populations (48). Alleles included in our g-groups were considered.
Four of our 8 LFD alleles (A*68:16, A*68:23, B*35:09, DQB1*03:25) have been documented to date exclusively in South or Central American Native populations. In addition to the description of a respective unique occurrence in a Chilean Huiliche population (9), A*68:16 and A*68:23 were found in Chilean Mapuche (23) and in Chimila Amerindians of Colombia (49). Another study, whose results are not documented in AFND, reported the finding of allele A*68:23 in a cohort of n=559 Chileans from Santiago with a frequency of f>0.0125 (43). The highest AF of DQB1*03:25 in AFND has so far been reported in a population from Colombia Bogotá Cord Blood with f=0.0003, which corresponds to the presence of one allele in the sample of n=1,463 (50). B*35:09 has been reported with the highest frequencies in a Chilean Huiliche (f=0.075 (9)) and a Quechua population living in Bolivia and Peru (f=0.071 (9)). Further substantial occurrence was published for a Wichí population of Argentina (f=0.033 (51)).
The four remaining LFD alleles show - in addition to their occurrence in South and Central American indigenous populations - also relevant incidences in other world regions. B*35:20 has been documented before in a Mapuche population sample (f=0.024 (23)) and several other South and Central American Native populations, for example in two Colombian Ticuna populations (f=0.079 and f=0.036 (9)) and a Mestizo population from Nicaragua (f=0.013 (52)), but also occurs in other world regions, e.g. India (f=0.037 (53)), Israel (f=0.035 (54)), and Singapore (f=0.012 (54)). B*39:09g stands out in our analyses as the most frequent HLA-B allele and by a considerably higher frequency in CL-MP (f=0.163) than in the non-Indigenous CL-NI (f=0.096). To AFND, this allele was reported at very high frequencies in the above described Huiliche (f=0.425 (9)) and Mapuche population samples (f=0.200 (23)) from Chile and in a Yucpa population from Venezuela (f=0.349 (55)). Apart from further South American populations, occurrence of the allele, albeit with much lower incidence, was reported from several Asian, e.g. Thai (f=0.031 (56)) and Chinese (f=0.015 (57)) populations. DRB1*04:07g is not only abundant in South American populations with the highest occurrence in a Kogi population in Colombia (f=0.613 (58)), but also documented in virtually all American Native populations, for example, South Dakota Lakota Sioux (f=0.188 (59)) and Alaska Native or Aleut (f=0.020 (60)). The allele was further found in numerous European population samples. A similar abundance across American indigenous populations such as e.g. Colombian Sikuani (f=0.389 (58)), New Mexico Zuni (f=0.190 (54);) and Alaska Native or Aleut (f=0.371 (60)) is seen for DRB1*16:02g. Beyond that, the allele is frequent in Pacific and Southeast Asian populations, e.g. from Papua New Guinea (f=0.288 (61)), Malaysia (f=0.280 (62)), and Thailand (f=0.141 (63)).
In the HLA haplotypes, the LFD alleles frequently occur combined in conserved associations. 10 of the 20 most frequent 6-locus HLA haplotypes of the CL-MP sample contain B*39:09g (including the 3 most frequent and 5 of the 6 most frequent), always in combination with C*07:02g. The Native American alleles DRB1*04:07g and DRB1*16:02g are found in 3 and 2 of the 20 most frequent CL-MP haplotypes, respectively. DRB1*16:02g is predominantly associated with B*39:09g~C*07:02g and DQB1*03:01, while DRB1*04:07g~DQB1*03:02 also occurs with other B~C allele combinations. Despite their self-assessed non-Indigenous family background, donors of population sample CL-NI also carry a number of haplotypes containing blocks of frequent South and Central American indigenous alleles. For example, 7 of the 20 most frequent CL-NI haplotypes share the block B*39:09g~C*07:02g, including the two most frequent, which are identical to the two most frequent haplotypes in the CL-MP sample. Haplotypes with clear European origin are also found with high frequencies in both Chilean subsamples. For example, partial haplotypes B*08:01g~C*07:01g~DRB1*03:01g~DQB1*02:01g (frequency ranks 3, 5, 15 and 20 in CL-NI and 11, 14, and 17 in CL-MP) and B*07:02g~C*07:02g~DRB1*15:01g~DQB1*06:02g (frequency ranks 6, 9 and 13 in CL-NI and 4 and 10 in CL-MP) are included in the most frequent 6-locus haplotypes in all European reference populations in this study.
The association with alleles of other HLA genes in haplotypes also sheds light on the possible origin of the 4 LFD alleles that we identified as characteristic for our Mapuche sample. B*35:09 has also been documented in non-Chilean and non-Mapuche indigenous populations in South America, suggesting that the allele is virtually unique Native South American.
Apart from South American populations, B*39:09g occurs also in Asia but with other associations: In Asia, B*39:09-containing haplotypes show a conserved linkage of the allele to A*02:03 (64–66), in South American populations usually to A*02:01 or other HLA-A alleles. Also, linkage to DRB1 alleles is different in B*39:09-containing haplotypes from the two world regions. Common DRB1 allele associations like DRB1*15:01 or DRB1*04:05 in Asian haplotypes (65, 66) are not or very rarely seen in South American haplotypes. These differences suggest an independent origin of South American and Asian B*39:09 alleles.
For alleles DRB1*04:07g and DRB1*16:02g, both of which are present in virtually all Native populations from North, Central and South America, but also in Europe (DRB1*04:07g) and Asia (DRB1*16:02g), the examination of the DQB1 associations is distinctive. DRB1*04:07~DQB1*03:02 is a conserved Native American haplotype block while DRB1*04:07~DQB1*03:01 is found in Europeans (65, 67). Similarly, DRB1*16:02~DQB1*03:01 is found in Native Americans while DRB1*16:02~DQB1*05:02 is typically seen in Asians and Africans (61, 64). These different DRB1-DQB1 associations also indicate a possible convergent evolution of the alleles.
Overall, the cumulative frequency of haplotypes containing one or more of the four LFD alleles that we identified as characteristic for our Mapuche sample is 31.8% in CL-MP and still 20.9% in CL-NI. Given this high percentage even among those that self-identify as “Non-indigenous”, it is reasonable to assume that Chilean patients would benefit most from donors with similarly mixed European-Native South American ancestry and vice versa. Because of specific alleles that are rare outside South America, donors from the Hispanic/Latino groups in the United States with predominantly Mexican, Central American and Caribbean ancestry (6) may not be a match for Chilean or South American patients.
In the MP analysis, it is apparent that non-Chilean patients benefit more from a Chilean donor registry (approximated in this work by a registry of non-Indigenous Chilean donors, because they represent by far the majority of donors in the existing Chilean registry) than Chilean patients (non-Indigenous and Mapuche) benefit from registries of non-Chilean donors. This effect is particularly pronounced in the European reference populations, but also applies to our South American reference populations. This observation suggests a strong need for a Chilean donor registry to serve Chilean patients.
However, caution is warranted in interpreting our MP results, mainly for two reasons: First, the results are based on fairly small samples of size n=1,000, an approach we intentionally chose to avoid bias due to different sample sizes and to be able to include as many reference populations as possible in the analyses. We expect to considerably underestimate the real MP given the small samples, although the order of MP values between the different populations should be less affected. Second, we only considered matching probabilities for one donor and one patient population each. For a more realistic modeling of actual donor searches, one would need to construct a donor pool from numerous populations (42). We refrained from doing so because of the limitations posed by the small sample sizes anyway and the different main focus of this work.
In the MP context, it is also interesting to look at the actual stem cell collections for unrelated transplantation from Chilean donors and for Chilean patients (68). In 2021, there were 50 collections from Chilean donors, 33 for Chilean patients, and 17 for patients from 8 other countries. In addition, there were 35 donations from foreign donors for Chilean patients, of which the large majority were from Germany (n=26). Given that the Chilean donor registry represents less than 0.4% of the global donor pool, the fact that more foreign donors donated to Chilean patients than vice versa does not contradict our finding based on MP that non-Chilean patients generally benefit more from Chilean donors than vice versa. Also, the fact that the majority of non-domestic stem cell donations to Chilean patients came from Germany is probably due to the very large number of registered donors in Germany (>9M).
Apart from the above-mentioned constraints in the context of matching probabilities, our study is subject to further limitations that could influence the results. First, registered stem cell donors may not constitute an unbiased sample of the respective populations under consideration. This is, for example, due to the fact that their age distribution differs from that of the total population, since only persons aged 18-60 can be registered donors and the recruitment efforts are focused on young donors. Younger subjects in particular are likely to have higher genotype diversity due to a change in mobility and mating patterns over the generations. Furthermore, individuals of higher socioeconomic status may be more likely to be reached by invitations to register. In addition, it can be assumed that due to the peculiarities of the recruitment process, the regional distributions of registered donors and the total population do not match. For example, the nearly 50% of donors in our sample residing in the Santiago metropolitan region exceed the regional population share (~36%). It is known that the regional composition of the Chilean population varies (17, 69), so that, for example, a successful donor drive in a small town may create bias. Since the donor’s current address is not a good proxy of regional differences due to high mobility of the young target group, we refrained from stratification based on this parameter in our analyses. Second, the assignment of registered donors to individual populations is based on self-assessed ancestry during the recruitment process. This may not always result in consistent information, especially for donors of mixed ethnicity. Third, different levels of resolution limit the comparability of alleles between and with published data. In our study, we confined allele comparisons to a level of resolution that differentiates non-synonymous mutations of the antigen recognition site, neglecting possible variations outside this gene region. And finally, the fact that most reference population samples consist entirely of migrants and their descendants is a source of bias that is difficult to assess (70). For example, judging from their location in the MDS plot, the sample of Brazilian donors could be reflecting subpopulations with high European components and not necessarily the ethnic diversity represented in that country. Similarly, the sample of Hispanics from the United States is composed of individuals from very different genetic backgrounds. However, we have used the approach before and obtained conclusive results, so we consider it reasonable (71).
Similar to other DKMS registries, the proportion of female volunteer donors in DKMS Chile is high (70.8%). Gender imbalance is a common observation in stem cell donor registries worldwide (72). However, as the HLA alleles studied in our work are located on chromosome 6 of the human genome, we do not expect any bias for our results.
In summary, we analyzed HLA allele and haplotype frequency distributions of Chilean stem cell donors of non-Indigenous and Mapuche origin. With n=92,788 and n=1,993 individuals, respectively, these are the largest population samples of this type to date. We identified alleles with substantially higher frequencies in these two populations than in populations outside Chile. Our analyses of allele and haplotype frequencies, genetic distances and matching probabilities showed that both populations are quite similar as they carry an admixture of European and Native American HLA genes and haplotypes, thus reflecting the country’s history of admixture and immigration. Nevertheless, when comparing the two samples, we found 4 alleles with a Native American origin with high specificity for the Mapuche population, namely B*39:09g, B*35:09, DRB1*04:07g and DRB1*16:02g. Our results regarding matching probabilities, suggest a particular need for more stem cell donor recruitment in Chile, but need to be further confirmed due to the small samples and the simple model used.
Data availability statementThe datasets presented in this article are not readily available because of ethical and privacy restrictions. Requests to access the datasets should be directed to the corresponding author/s.
Ethics statementEthical review and approval was not required for the study on human participants in accordance with the local legislation and institutional requirements. Written informed consent for participation was not required for this study in accordance with the national legislation and the institutional requirements. DNA extraction from blood samples or buccal mucosal swabs was performed with the informed consent of the donors. The consent allowed the processing of anonymized donor data for research related to donor search or stem cell donation. The publication itself does not contain any identifiable personal data.
Author contributionsUS, AS and JS designed the study. AG and MG were responsible for stem cell donor recruitment and administration. VL was responsible for donor HLA typing. US organized the database and carried out analyses. UVS and AHS wrote the first draft of the manuscript with support from MF-V. All authors contributed to the article and approved the submitted version.
AcknowledgmentsWe thank the volunteers who register as potential donors to help strangers in need of a stem cell transplant.
Conflict of interestThe authors declare that the research was conducted in the absence of any commercial or financial relationships that could be construed as a potential conflict of interest.
Publisher’s noteAll claims expressed in this article are solely those of the authors and do not necessarily represent those of their affiliated organizations, or those of the publisher, the editors and the reviewers. Any product that may be evaluated in this article, or claim that may be made by its manufacturer, is not guaranteed or endorsed by the publisher.
Supplementary materialThe Supplementary Material for this article can be found online at: https://www.frontiersin.org/articles/10.3389/fimmu.2023.1175135/full#supplementary-material
AbbreviationsAF, Allele frequency; AFND, Allele Frequency Net Database; GD, Genetic distances; HF, Haplotype frequency; HLA, Human leukocyte antigen; HSCT, Hematopoietic stem cell transplantation; LD, Linkage disequilibrium; MDS, Multidimensional scaling.
References1. Passweg JR, Baldomero H, Chabannon C, Basak GW, de la Camara R, Corbacioglu S, et al. Hematopoietic cell transplantation and cellular therapy survey of the EBMT: monitoring of activities and trends over 30 years. Bone Marrow Transplant (2021) 56(7):1651–64. doi: 10.1038/s41409-021-0
留言 (0)