Development of the generic adherence for chronic diseases profile (GACID-P) questionnaire
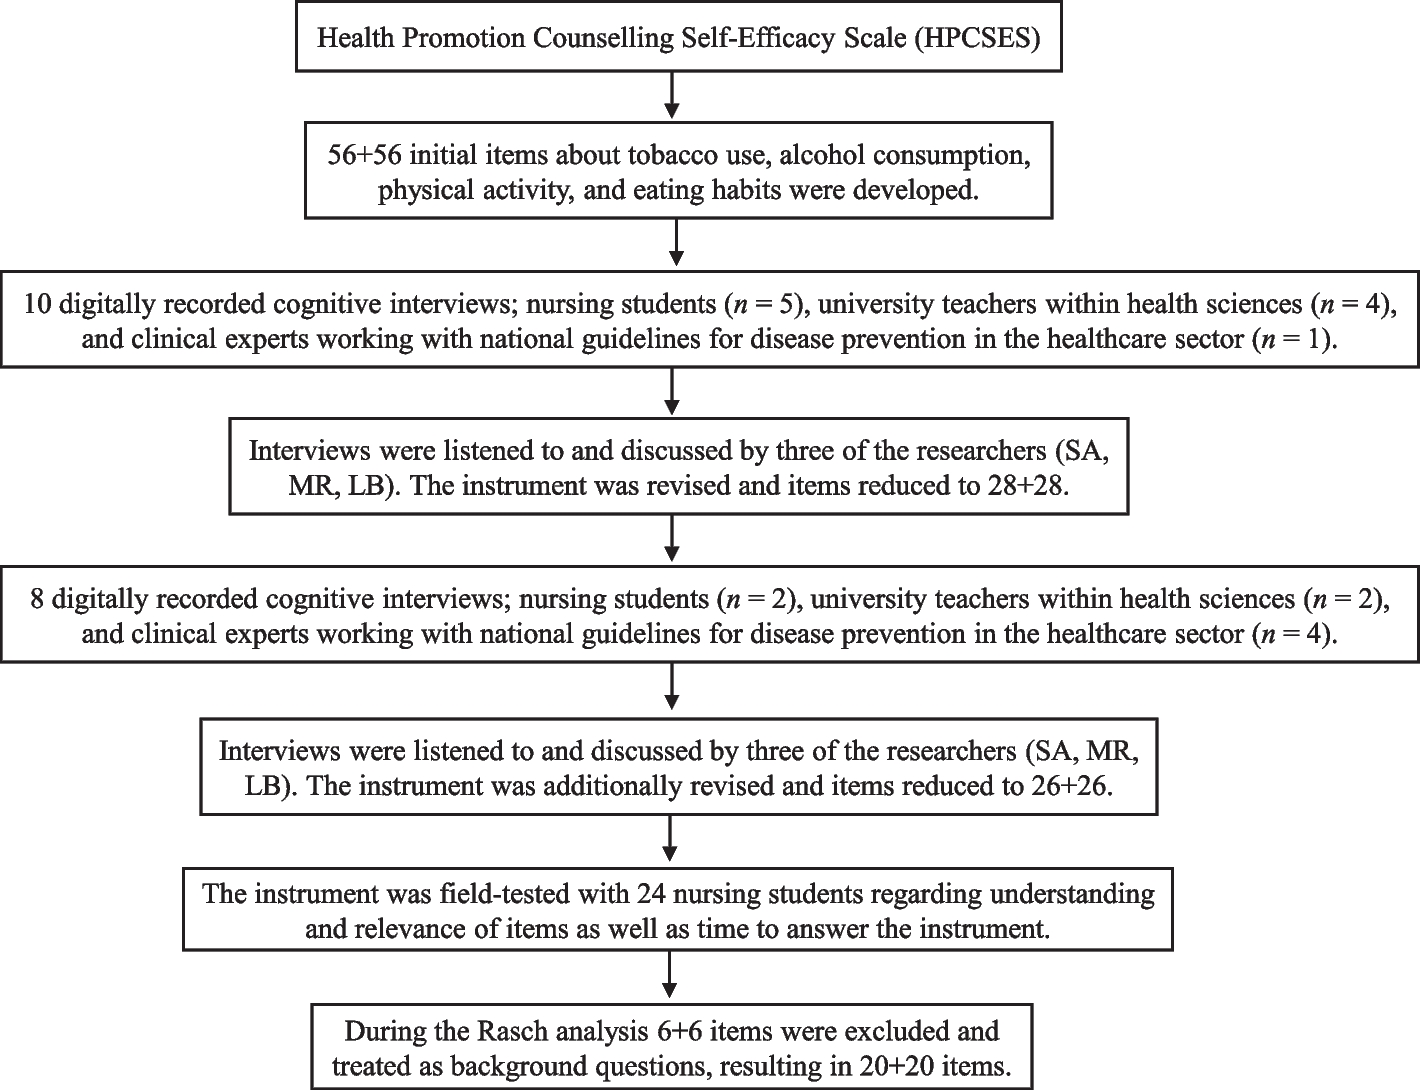
A review of the English and French literature on the development or validation of adherence questionnaires published since 1980 identified 20 published and validated scales comprising a total of 330 items. This item bank was used to create new items for our tool (either by adapting some items from this bank or by creating new items as for majority of items). After a content analysis by a group of experts (psychologists, clinicians, nurses), these items were grouped together in three dimensions: (1) medication and/or medical adherence: adherence to medical prescriptions in terms of dose, schedules, attending medical appointments, tests (blood test, X-ray, etc.) requested by the doctor; (2) lifestyle adherence; (3) diet adherence: sometimes optimized care is achieved by following a restrictive diet or avoiding excess (sugars, fats, etc.). The purpose of this step was to bring together dimensions that were scattered in the different questionnaires depending on whether they were created from a clinical, public health or psychological approach. Then, 26 health professionals from university hospitals (8 cardiologists, 5 diabetologists, 3 rheumatologists, 4 nurses, 6 health psychologists) and 9 general practitioners of the Grand-Est region in France divided into 5 multiple health-professional groups, grouped items (among the 330) with the same meaning. The items with the clearest or most accurate wording were retained in each group, or the items were reworded for more relevance in terms of measured adherence, which resulted in a corpus of 41 items. An expert group of seven health professionals with specific knowledge of adherence (one general practitioner, one cardiologist, one diabetologist, one rheumatologist, one nurse, two health psychologists) then reduced this list to 32 items. The instructions were to cover all three dimensions of adherence identified in the literature review, ensure that the items were consistent and congruent for all medical specialties (and adjust their wording accordingly), and avoid unnecessary repetition and retain items that were relevant. A final phase consisted of a cognitive debriefing with focus groups of patients to guarantee good understanding of the 32 items and, if necessary, adapt the reformulation. Four focus groups of six patients with various conditions (heart disease, diabetes, rheumatic diseases, cancer, others) reviewed all 32 items to ensure that they were well understood and appropriate to the reality of the disease as experienced by the patients.
Study sample
The sample consisted of patients with chronic disease consulting at two university hospitals (during consultations in diabetology, cardiology, rheumatology, oncology and infectiology) and in three private practices (diabetology, cardiology, rheumatology) of the Grand-Est region, France. The inclusion criteria were (1) age > 18 years; (2) in routine consultation; and (3) able to complete the questionnaire. A specialist clinician confirmed the inclusion criteria for each condition: (1) chronic cardiovascular diseases such as heart failure, hypertension and coronary heart disease; (2) type 2 diabetes; (3) knee or hip osteoarthritis, osteoporosis, inflammatory rheumatism (rheumatoid arthritis and spondyloarthropathy); (4) consulting in a hospital clinic and receiving oral non-hormonal anti-cancer drugs; and (5) consulting in a hospital clinic and living with HIV infection. We excluded patients not receiving any treatment (drug or lifestyle/dietary recommendations) as well as those with more than three conditions cited in the inclusion criteria.
Measured variables
The GACID-P questionnaire is a French adherence questionnaire consisting of 32 items covering three components of health adherence: medication and/or medical adherence (i.e., adherence with medication prescriptions and examinations: items 1 to 22); lifestyle adherence (physical activity, addictive behaviours, etc.: items 23, 24 and 28 to 30) and diet adherence (i.e., limited intake of fat, sugar and salt: items 25 to 27). Some items measure non-adherence to therapy (items 2 and 6 to 16) and others measure adherence to therapy. Responses to the items were rated on a 4-point Likert-type scale (1, never, to 4, all the time).
The 8-item MMAS (MMAS-8) is a generic medication adherence scale [18] validated in French [20]. The total score on the MMAS-8 ranges from 0 to 8, with scores of < 6, 6 to < 8, and 8 reflecting low, medium, and high adherence, respectively.
For each patient included during the consultation, the physician completed a “treatment and history” document specifying the different treatments under way in the previous month as well as the surgical history and comorbidities. Socio-demographic data collected were sex, age, marital status (single, married/ cohabitating, divorced, partnership, widow(er)), education (certificate of studies, certificate of secondary education, technical school certificate, baccalaureate degree (general or professional), post-baccalaureate degree), employment status (full-time, part-time, unemployed, retired).
Conduct of the study
The physician in one of the 12 participating centres administered the first questionnaires including GACID-P and MMAS-8 scales and socio-demographic and treatment data to the patient during a routine visit after the study was explained to the patient (D0). At the end of this consultation, the patient was given the questionnaires including GACID-P and MMAS-8 scales only in a pre-stamped envelope to be completed 15 days later (D15).
Statistical analysis
Sociodemographic and clinical characteristics of patients are described with number (%) for categorical variables and number and mean (SD) for quantitative variables. To determine the acceptability of the questionnaire, the distribution of response modalities for the items was analysed, with a search for a floor or ceiling effect as well as the percentage of missing items. Two types of factorial analyses of the questionnaire were performed: principal component analysis (PCA) with rotation for items with polytomous coding and multiple correspondence analysis (MCA) for items with dichotomous coding following study of the distribution of items. The properties of GACID-P questionnaire dimensions identified by PCA and MCA were further studied by using a model of item response by dimension [21], involving a Rasch model for dimensions with dichotomous response items [22] and a partial credit model for dimensions with polytomous items [23]. Item and person fit were tested with standardized residuals (a summation of individual person and item deviations) and as a chi squared statistic. Residual values of items between ± 2.5 are deemed to indicate adequate fit to the model [24] [25]. For participants deviating, underfit means random or constant responses and overfit an attraction for extreme response patterns. Disordered thresholds within an item indicated consistent difficulty in discriminating between response categories. The internal consistency of the dimensions was assessed by the Person Separation Index (PSI), with expected value > 0.85 [26]. According to Tennant et al. “Person Separation Index (PSI) is interpreted in the same way as Cronbach’s alpha. In fact, the only calculation difference between PSI and Cronbach’s alpha lies within the value used within the formula, with PSI using the logit value and Cronbach’s alpha using the raw value. The PSI is an indication of reliability and reflects the ability to differentiate between different levels of the underlying construct” [24, 26]. Local dependency was identified with a residual correlation (r) at least 0.3 higher than the mean of the correlations between pairs of items on the scale [27]. The invariance of the items was studied by differential item functioning (DIF) according to different factors such as the present condition, sex, smoking statusonly available in infectiology patients (smoker, former smoker and non-smoker) and professional status (not working, work part time, work full time). For each item, DIF is detected by comparing graphically and by ANOVA the response probabilities observed between the different levels of the underlying characteristic and between different groups [22]. Finally, following the results of the IRT analyses, a content analysis was carried out in accordance with recommendations for reducing measurement scales [28]. In each dimension defined by factor analyses and optimized by IRT and content analyses, the internal consistency was determined by calculating Cronbach’s alpha, with a value ≥ 0.7 considered acceptable [29]. The reproducibility of the dimensions was studied between D0 and D15 by calculating the intra-class correlation coefficient (ICC). A value 0.6 to 0.8 was considered good and > 0.8 excellent [30]. The convergent validity of the instrument was assessed by Spearman correlation analysis of scores for the dimensions of the GACID-P questionnaire on drug adherence and the MMAS-8 score.
Statistical analysis involved use of SAS v9.4 (SAS Inst., Cary, NC) for classical test theory analysis and RUMM2030 (Rumm Laboratory, Perth, Western Australia) for IRT analysis. All p-values were Bonferroni-corrected for IRT analysis and overall significance was set to 0.05 for the other analyses.

留言 (0)