Study population
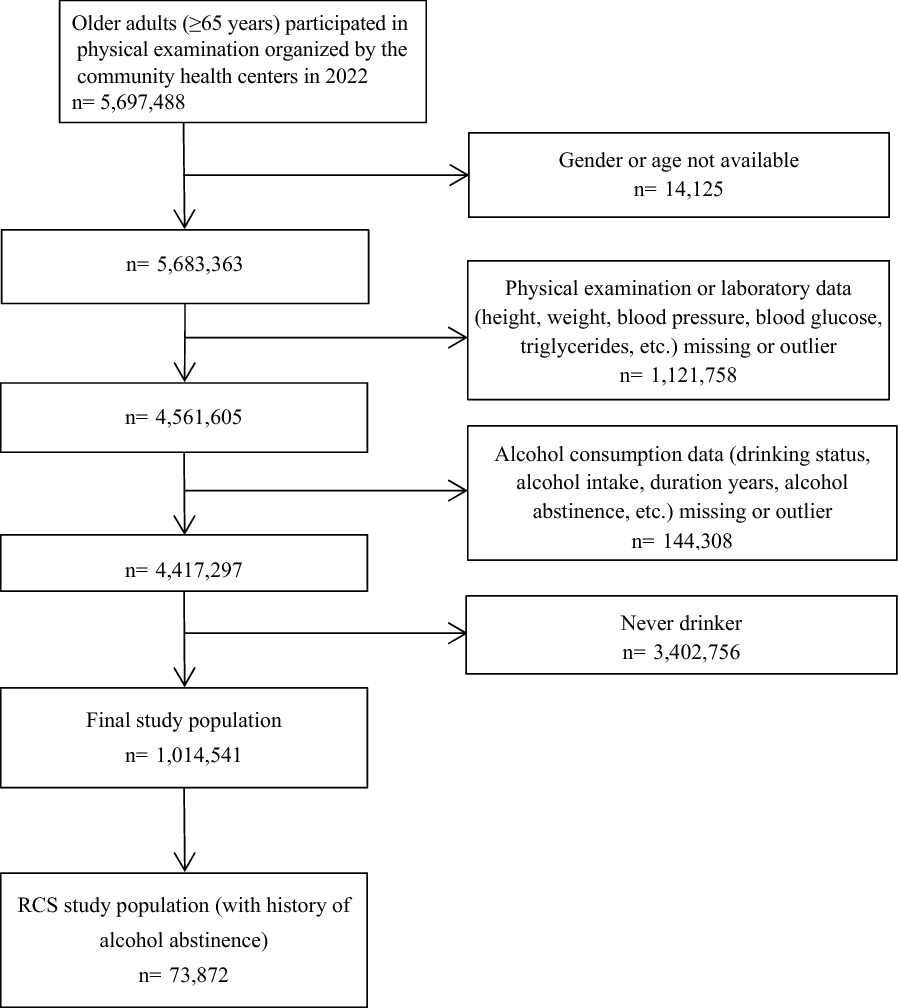
The study included 726 newly diagnosed diabetic inpatients with a duration of less than 1 year who were admitted to the endocrine department at Tianjin Union Medical Center between January 2019 and June 2022. Inclusion in the study was based on the diagnostic criteria for diabetes mellitus outlined by the World Health Organization (WHO) in 1999 [23]. Excluded from the study were patients under the age of 18, those with type 1 diabetes mellitus, gestational diabetes, or other special forms of diabetes, and those with an unclear type of diabetes. The classification of diabetes mellitus was also based on the WHO consultation [23]. Additionally, participants with ketosis, serious infections, malignant tumors, serious heart, liver, kidney, or thyroid dysfunction, and those taking lipid-lowering drugs or thiazide diuretics daily for the past month were also excluded. The exclusion criteria were established to eliminate potential confounding factors that may impact the lipid profiles of the participants. Furthermore, individuals with incomplete key variables such as anthropometric measurements and blood lipid profile results were excluded.
A total of 49 participants were excluded due to diabetic ketosis and/or T1DM and/or severe infections. One individual with steroid-induced diabetes, one with pancreatogenic diabetes, five with malignant tumors, and seven with severe cardiac, hepatic, and renal damage were also excluded from the study. Additionally, 53 participants were not included in the analysis due to insufficient information on key variables, and an additional five outliers were removed for the purposes of accurate analysis. The final sample comprised 605 individuals, who were divided into two groups: early-onset T2DM and late-onset T2DM, based on their age. The control group comprised 139 healthy individuals who were matched for age and gender to the early-onset T2DM group and underwent a routine physical examination at the Health Management Center of Tianjin Union Medical Center. All subjects in the control group were confirmed as non-diabetic through fasting blood glucose and glycosylated hemoglobin tests.
Data collection
Clinical data was collected through interviews conducted by health professionals, such as doctors or postgraduate medical students. The interviews covered information related to general characteristics (e.g. gender, age, date of diabetes diagnosis, and duration of diabetes), lifestyle habits (e.g. smoking and alcohol consumption), and medical history (e.g. family history of diabetes, previous illnesses, and medication use). Family history of diabetes was defined as the presence of diabetes in at least one first-degree relative (parents, siblings, or children). Smoking status was classified as either current or non-current, with current smokers defined as those who smoke daily and non-current smokers including those who have never smoked, occasionally smoked, or quit. Drinking status was similarly categorized as current or non-current, with current drinkers defined as those who drink daily and non-current drinkers including those who have never drunk, occasionally drank, or quit.
In our study, height and weight were measured using an automatic height and weight measuring instrument (DST-600, DONGHUAYUAN, China) by health professional surveyors. The WC was measured utilizing a soft ruler at the midpoint between the lower ribs and the iliac crest. Blood pressure was measured with an arm-type electronic sphygmomanometer (AC-05C, Ling Qian, China) after participants had rested for at least 5 min. The visceral fat area (VFA) and body fat ratio (BFR) were assessed through bioelectrical impedance analysis (BIA) using a body composition analyzer (InBody770, Biospace, Korea). The presence of fatty liver was primarily determined through transabdominal ultrasound. All diabetic patients underwent an oral glucose tolerance test (OGTT). The participants fasted overnight for at least 8 h, and venous blood samples were collected the following morning for laboratory examination.TG, total cholesterol (TC), HDL-C, low-density lipoprotein cholesterol (LDL-C), uric acid (UA), and fasting plasma glucose (FPG) were measured using an automatic biochemical analyzer (TBA-120FR, Toshiba, Japan). The levels of insulin and C-peptide were determined through radioimmunoassay, and the GHbA1c was detected through high-efficiency liquid chromatography utilizing an automatic glycosylated hemoglobin analyzer (HA-8180, ARKRAY, Japan).
Ultimately, the clinical data were extracted from the electronic medical records by designated recorders who meticulously recorded the relevant information on a pre-determined form. To maintain impartiality, the interviewers, surveyors, and recorders were not informed of the study's underlying hypothesis. Two impartial assessors were also blinded to the exposure status of the study participants and their sole involvement in the study was the evaluation of the results.
Definition and calculation of variables
We used the homeostasis model assessment-2(HOMA2) model to calculate the homeostasis model assessment-2 of insulin resistance (HOMA2-IR) and the homeostasis model assessment-2 of β-cell function (HOMA2-β). The HOMA2 model was obtained from www.ocdem.ox.ac.uk [24]. The HOMA2 model was used after converting the units of C-peptide to nmol/L and inputting the fasting glucose and fasting C-peptide values into the model, in order to avoid the effect of exogenous insulin. In addition, the following indices were calculated and defined:
BMI = body weight (kg)/the square of the height (m2) [25].
LAP = [WC (cm)-65] × TG (mmol/L) for males; LAP = [WC (cm)-58] × TG (mmol/L) for females [19].
VAI = \(\left(\frac}\right)\times \left(\frac\right)\times \left(\frac\right)\) for males; VAI = \(\left(\frac}\right)\times \left(\frac\right)\times \left(\frac\right)\) for females; WC (cm), BMI (kg/m2), TG (mmol/L) and HDL (mmol/L) [20].
Statistical analysis
Normally distributed and skewed data approximated a normal distribution after natural log transformation (including SBP, DBP, HOMA2-IR, HOMA2-β, TG, HDL-C, VFA, VAI and LAP) were compared by Student's t-test. We compared categorical variables between the two groups by the chi-square test.
In order to determine the predictive ability of the LAP and VAI in comparison to other traditional obesity-related indices (BMI, WC, BFR, and VFA) for early-onset T2DM, we employed a receiver operating characteristic (ROC) curve analysis. This analysis involved plotting ROC curves, which utilized early-onset T2DM as the state variable, late-onset T2DM as the reference variable, and LAP, VAI, BMI, WC, BFR, and VFA as the test variables. The evaluation of the results consisted of calculating the area under the curve (AUC), cut-off value, sensitivity, specificity, and the Youden index.
To evaluate the correlation between various levels of LAP and VAI with the risk of early-onset T2DM, we divided the sample into four subgroups using the quartile divisions of LAP (L1-L4) and VAI (V1-V4). The quartile categorization of LAP in males was L1 (≤ 30.29), L2 (30.30–51.35), L3 (51.36–93.49), and L4 (> 93.51), while VAI was classified as V1 (≤ 1.36), V2 (1.37–2.16), V3 (2.17–3.62), and V4 (> 3.63). In females, the quartile categorization of LAP was L1 (≤ 30.90), L2 (30.91–52.90), L3 (52.91–81.34), and L4 (> 81.35), and that of VAI was V1 (≤ 1.71), V2 (1.72–2.76), V3 (2.77–4.28), and V4 (> 4.29). Subsequently, a binary logistic regression analysis was executed, with L1 or V1 as the reference, to calculate the adjusted OR and 95% confidence intervals (95% CI) of the other subgroups after combining the quartiles of both genders. To assess the independent influence of LAP and VAI on early-onset T2DM, variables with a significance level (α) of less than 0.1 from univariate analysis were included in the model, after adjusting for multicollinearity. The original model of LAP consisted of variables such as current drinking status, smoking status, systolic blood pressure (SBP), diastolic blood pressure (DBP), UA, fatty liver, family history of diabetes, LDL-C, HDL-C, and LAP quartile categorization. Similarly, the original model of VAI incorporated variables such as drinking status, smoking status, SBP, DBP, UA, fatty liver, family history of diabetes, LDL-C, and VAI quartiles. The final models were obtained using forward stepwise regression.
Finally, in an effort to provide a clearer comprehension of the impact of LAP and VAI on the onset age of T2DM by gender, we conducted a correlation analysis and multiple linear regression after log-transforming LAP and VAI using base 10 logarithm. Pearson's correlation analysis was employed in the correlation analysis, while multiple linear regression was utilized to establish predictive models for the onset age of T2DM. A stepwise model selection approach was employed, evaluating the goodness of model fit using the Akaike Information Criterion (AIC). We carried out standard linear regression diagnostics, including verification of linearity, normality, and homoscedasticity of residuals, as well as checking for the absence of leverage points and outliers.
We regarded P < 0.05 (two-tailed) to be statistically significant. The statistical analysis was carried out utilizing RStudio (version 2021.09.0 for Mac OS, RStudio Team, RStudio: Integrated Development for R; RStudio, Inc., Boston, MA).

留言 (0)