
記住我
Cell cycle kinases cyclin-dependent kinase (CDK) 4 and CDK 6 facilitate cell cycle progression through the G1 phase. Small molecule inhibitors targeting these kinases can block the proliferation of cancer cells.1 2 Three orally available CDK4/6 inhibitors (CDK4/6i), palbociclib, ribociclib, and abemaciclib, have been approved by the Food and Drug Administration for the treatment of hormone receptor-positive and human epidermal growth factor receptor 2 (HER2)-negative breast cancer in combination with hormone therapy.3–7
Accumulating evidence suggests that CDK4/6i may enhance certain aspects of antitumor immunity.8 For example, CDK4/6i abemaciclib can suppress the proliferation of regulatory T cells in a mouse model of HER2+ mammary cancer.9 10 In addition, CDK4/6i have been reported to boost T-cell activity through transcription factor nuclear factor of activated T cells (NFAT)11 12 and promote differentiation of memory CD8 T cells.13 14 We and others have demonstrated that CDK4/6i can induce a pro-immunogenic phenotype in cancer cells associated with increased production of chemokines and type III interferons that recruit and activate CD8 T cells.10 15 16 Furthermore, CDK4/6i therapy induces the expression of immune checkpoint molecule programmed death ligand-1 (PD-L1) on tumor cells, making them sensitive to anti-PD-L1 therapy.17
Breast cancers, especially of the estrogen receptor-positive (ER+) subtype, are not considered immunogenic and typically lack prominent T-cell infiltration and respond poorly to immune checkpoint blockade (ICB).18 These factors raise the idea of harnessing the pro-immunogenic activity of CDK4/6i to sensitize breast cancers (and potentially other cancers) to ICB. Several clinical trials have been initiated combining ICB therapy with CDK4/6i palbociclib (NCT04360941, NCT03147287), abemaciclib (NCT03280563, NCT04169074, NCT04272645, NCT04220892, NCT04118036, NCT03997448, NCT02779751, NCT04088032, NCT02791334), ribociclib (NCT03294694), and a newer intravenous CDK4/6i trilaciclib (NCT02978716) in breast cancer and other malignancies (ClinicalTrials.gov). While many of these studies are still in progress, early results suggest that adding ICB does not dramatically enhance responses over CDK4/6i alone. For instance, a combination of abemaciclib with the anti-programmed cell death protein-1 (PD-1) antibody pembrolizumab with or without endocrine therapy in locally advanced or metastatic breast cancer (MBC) did not show clear improvement over historical data for abemaciclib monotherapy.19 Similarly, combination with ribociclib did not suggest an additive effect with ICB.20 In another study, a combination of palbociclib, pembrolizumab, and letrozole as front-line therapy in ER+ MBC showed a progression-free survival (PFS) of 25.2 months, similar to a PFS of 24.8 in the control arm (no pembrolizumab) of the PALOMA-2 trial.21 The overall clinical experience with CDK4/6i and ICB combinations, although based on studies with a small number of patients, suggests that additional immune evasion mechanisms may restrict the full potential of these combinations in patients. Understanding these immune evasion mechanisms would be necessary to effectively harness pro-immunogenic properties of CDK4/6i in the clinic.
We hypothesized that the limited efficacy of CDK4/6i and ICB therapy is associated with the anti-proliferative effect of CDK4/6i on the host’s cells. Indeed, the sensitivity to CDK4/6i varies across cell types.22 23 Furthermore, the main side effects of CDK4/6i (diarrhea, neutropenia) are associated with inhibition of proliferation in fast-cycling normal cells, including gastrointestinal epithelial cells and granulocyte progenitors.24 25 While it remains largely unknown how the anti-proliferative effect of CDK4/6i impacts the host’s immune system, it is plausible that systemic CDK4/6 inhibition may impact some immune cell subtypes required for effective antitumor immunity.
To understand the barriers for effective antitumor immunity after CDK4/6i and ICB therapy in breast cancer, we used female mice bearing luminal-like PYMT mammary tumors and ex vivo immune cell cultures. Using these preclinical models coupled with transcriptome and immune cell assessments, we identified immune subsets sensitive to CDK4/6i. We also interrogated longitudinal samples from patients with MBC undergoing CDK4/6i therapy to corroborate mechanistic findings in the mouse tumors and assess the dynamics of CDK4/6i-mediated immune system modulation in humans. Based on the results of these studies, we designed and validated a combinatorial therapeutic approach to overcome antitumor immunity block in the context of CDK4/6i and ICB therapy.
ResultsTumor-infiltrating leukocytes from CDK4/6i-treated mice displayed decreased expression of cell cycle genesTo determine how CDK4/6i affects the phenotype of tumor-infiltrating immune cells in vivo, we used female transgenic MMTV-PYMT mice (FVB genetic background) that develop mammary tumors with a mean latency of 53 days. When tumors were palpable, mice were treated with palbociclib or vehicle for 18 days. Subsequently, CD45-positive immune cells were isolated from tumors using fluorescence-activating cell sorting (FACS) and subjected to RNA sequencing (RNA-seq) (figure 1A). Tumor growth over time is shown in figure 1B. We identified 486 downregulated and 309 upregulated genes in CDK4/6i-treated tumors (figure 1C, online supplemental data S1). Gene Ontology (GO) analysis revealed a highly significant enrichment of GO terms related to cell proliferation, such as ‘cell cycle’, ‘cell division’, and ‘mitotic nuclear division’, among palbociclib-downregulated genes (figure 1D). Expression of cell cycle-related genes was reduced in immune cells obtained from palbociclib-treated tumors (figure 1E). These included proliferation marker Ki-67, cell cycle transcription factor FoxM1, essential mitotic kinase Aurkb, mitotic cyclin Ccnb1, and phosphatases Cdc25b and Cdc25c that activate mitotic cyclin-dependent kinase CDK1 (figure 1F). These results suggest that palbociclib treatment inhibits proliferation of tumor-infiltrating leukocytes.
 Figure 1
 Downregulation of proliferation-related transcription in tumor-infiltrating leukocytes after palbociclib treatment. (A) Experiment scheme. Female MMTV-PYMT mice at 2 months of age were treated with vehicle or 100 mg/kg palbociclib for 23 days. CD45+ cells sorted from tumors were analyzed by RNA sequencing. (B) Tumor volume changes over time in the experiment shown in A. N=5 mice per treatment group. (C) Pie chart graph showing numbers of genes upregulated or downregulated by palbociclib treatment. (D) Analysis of Gene Ontology terms enriched in a set of genes downregulated by palbociclib. (E) Heat map indicating the expression of genes downregulated by palbociclib. (F) Expression of selected cell cycle regulating genes in leukocytes infiltrating mammary tumors in vehicle-treated and palbociclib-treated mice. Statistical comparison was performed using an unpaired t-test.
CDK4/6 was required for bone marrow cell proliferation but dispensable for the proliferation of activated T cellsBased on the RNA-seq findings, we performed experiments to identify populations of immune cells sensitive to palbociclib. First, the effect of palbociclib on T-cell proliferation was investigated. Mouse spleen-derived T cells and human peripheral blood T cells were stimulated with plate-bound anti-CD3 and anti-CD28 antibodies for 3 days. Palbociclib was added to the culture plates at increasing concentrations (figure 2A–C). As a negative control, cells were incubated without T cell-stimulating antibodies. The stimulation induced the proliferation of mouse and human T cells. The addition of palbociclib had no significant effect on T-cell proliferation (figure 2B,C).
Bone marrow (BM)-derived myeloid cells are abundant in the tumor microenvironment (TME).26 The colony-forming unit (CFU) assay was used to assess the effect of CDK4/6i on the proliferation of BM-derived cell subsets. Mouse BM cells were incubated in three-dimensional culture media that was enriched with growth factors that commit progenitor cells to differentiation along monocytic, granulocytic, and erythroid lineages (figure 2D). Notably, CDK4/6i prominently suppressed proliferation of BM cells even at the lowest dose of 0.3 µM (figure 2E). Both the number of colonies and the number of cells per colony (colony density) were reduced by CDK4/6i (figure 2F,G). In contrast, the distribution of colony phenotypes (erythroid, granulocytic, monocytic, mixed) was not significantly altered (figure 2H). These findings suggest that palbociclib inhibits the proliferation of BM-derived cells, and this inhibition is evident across different progenitor lineages.
To determine if palbociclib modulated BM myelopoiesis in vivo, we treated tumor-free mice with vehicle or palbociclib and evaluated BM composition using flow cytometry (figure 2I). The percentages of CD11b+cells were significantly reduced within the BM leukocytes of palbociclib-treated mice as compared with vehicle-treated animals (figure 2J). Moreover, in accordance with myeloid compartment reduction, there was a proportional increase in the content of lymphoid cells, such as T and B cells, in the BM of palbociclib-treated mice (figure 2J,K). We next performed a similar experiment using PYMT-tumor bearing mice treated for 2 weeks with CDK4/6i palbociclib or abemaciclib (online supplemental figure S1A) and analyzed the numbers and Ki67 expression in immune cells from different tissues. We observed a reduction in total CD45+ cell numbers in peripheral blood that primarily affected myeloid compartment (figure 2L) and was associated with the reduction of the percentages of Ki67+cells within these cell populations (figure 2M, online supplemental figure S1C, blood plots). Cell content in the BM and spleen was not prominently affected, with the exception of an increase of T-cell populations in the BM (online supplemental figure S1B). However, there was a significant reduction in the percentages of Ki67+cells within the CD45+ and CD11b+cells in spleens of CDK4/6i-treated mice (online supplemental figure S1C). The majority of leukocytes in the BM were positive for Ki67, and this was not affected strongly by the treatments. However, we detected a moderate reduction in the Ki67 positivity in non-granulocytic myeloid cells in the BM of mice treated with palbociclib (online supplemental figure S1C). Intriguingly, we found reduced expression of Ki67 in CD4 and CD8 T cells in all tested tissues. One potential explanation is that there may be a delayed effect of CDK4/6i on the homeostatic proliferation of T cells. Interestingly, while the tumor inhibition was comparable in palbociclib and abemaciclib-treated mice, overall immune cell suppressing effects of abemaclib were often less pronounced, highlighting differences between agents within the CDK4/6i class. Taken together, these data suggest that hematopoiesis of myeloid immune cells is suppressed by CDK4/6i in vivo.
 Figure 2
 Palbociclib inhibits the proliferation of bone marrow cells while T-cell proliferation is unaffected. (A) T-cell proliferation experiment scheme. Mouse splenocytes from C57BL/6 mice or human PBMCs were stimulated with CD3/CD28 antibodies for 3 days in the presence or absence of palbociclib. N=3 biological replicates per each treatment condition. (B) The relative number of mouse CD3+cells without stimulation and with stimulation in the presence of palbociclib. Statistical comparison between ‘0’ and other treatment groups was performed using one-way analysis of variance (ANOVA) with Tukey’s post-test with adjustment for multiple comparisons. (C) Same as in B, except human CD3+T cells were used. (D) Bone marrow cell proliferation experiment scheme. Mouse bone marrow cells were cultured for 14 days in three-dimensional (3D) growth factor-enriched media with and without palbociclib. Colony number, phenotype, and average cell density in colonies were compared. The experiment was performed twice with four biological replicates in each experiment. (E) Representative images of plates of 3D-cultured bone marrow cells after 14 days of incubation with and without palbociclib. Black colonies of various shapes and sizes are visible. (F) Count of bone marrow colonies per plate from two independent experiments, each with four biological replicates per concentration shown in D and E. Statistical analysis was performed using one-way ANOVA with Dunnett’s post-test adjusting for multiple comparisons. (G) Densitometry analysis of individual colonies formed by bone marrow cells with and without palbociclib. Statistical comparison between vehicle and palbociclib-treated groups was performed using one-way ANOVA with Tukey’s post-test. N=183 colonies for vehicle group, n=44 for palbo 0.3 μM, n=38 for palbo 1 µM, and n=12 for palbo 3 µM. (H) Types of colonies formed by bone marrow cells in the absence or presence of palbociclib. Colony types were identified based on morphology by evaluating high magnification photographs of plates shown in E. Statistical analysis of differences in frequencies of indicated colony types per plate between indicated treatment groups was performed using two-way ANOVA with Tukey’s post-test with adjustment for multiple comparisons. (I) Experiment scheme. Bone marrow cells from non-tumor-bearing C57Bl/6 mice treated with vehicle or palbociclib (100 mg/kg one time per day) for 1 week were assayed by flow cytometry. N=3 mice per treatment group. (J) Percentages of the indicated immune cells within the total population of CD45+leukocytes of the bone marrow in vehicle-treated and palbociclib-treated mice. Three mice in each treatment group were analyzed. (K) Percentages of CD11b+myeloid cells, CD19+B cells, and CD3e+T cells within CD45+cell in the bone marrow of vehicle-treated and palbociclib-treated mice. (L–M) PYMT-tumor bearing mice were treated with palbociclib, abemaciclib or vehicle for 15 days followed by fluorescence-activating cell sorting staining of RBC lyses peripheral blood samples. (L) Relative numbers of CD45+cells (left) and CD11b+cells (right) in 1 mL of blood determined using counting beads. Numbers are expressed as events in the population of interest divided by bead events, n’s are vehicle (n=5), palbociclib (n=5), abemaciclib (n=4). (M) Percentages of Ki67+cells within CD45+ (left) and CD11b+ (right) cell populations; n’s as in L. Statistical comparison between vehicle and treatment groups (palbociclib or abemaciclib) was performed using ANOVA with Dunnett’s post test. ns, not significant (p≥0.05), *p=0.01–0.05, **p=0.001–0.01, ***p=0.0001–0.001. NK, natural killer; PBMC, peripheral blood mononuclear cell; RBC, red blood cells.
CDK4/6i lowered the number of dendritic cells in the TME and inhibited their proliferationWe next investigated how palbociclib impacts the myeloid compartment of the TME. Mice inoculated with PYMT tumors were treated for 4 weeks with vehicle or palbociclib, and tumor-infiltrating myeloid cells were analyzed by flow cytometry (figure 3A, online supplemental table S1). Data was analyzed using the uniform manifold approximation and projection (UMAP) dimension reduction algorithm that distributed cells across two-dimensional plot based on similarity/differences in expression of tested markers (online supplemental figure S2A). Notably, the percentages of antigen-presenting cells (major histocompatibility complex (MHC)-II+) and specifically dendritic cells (DCs) (CD11c+, MHC-II+) were drastically reduced in palbociclib-treated mice (figure 3B). These changes affected both conventional DC (cDC)1 and cDC2 subsets (CD103+/CD11b− and CD103−/CD11b+, respectively). Of note, cDC2 cells were strongly over-represented in tumors (figure 3B). We further examined if DC loss in tumors was associated with palbociclib and abemaciclib-mediated systemic DC suppression. We found that treatment of PYMT-tumor bearing mice with palbociclib and abemaciclib (2 weeks treatment) resulted in significant reduction in absolute numbers of CD11c+MHC-IIhi DCs in peripheral blood and spleen (figure 3C). In BM, treatment with palbociclib showed significant reduction in CD11c+MHC-IIhi DCs numbers, while reduction was minor and not statistically significant in the abemaciclib-treated group (figure 3C). Treatment with either palbociclib or abemaciclib resulted in significant reduction of both cDC1 and cDC2 in peripheral blood (figure 3C). In spleen, palbociclib downmodulated both cDC1 and cDC2, whereas abemaciclib caused a statistically significant reduction only in cDC2 (figure 3C). In accordance with decreasing DC numbers, we observed a decrease in Ki67 expression in DCs from spleen and tumors (figure 3C), whereas proliferation of T cells in the tumor was not affected, based on Ki67 expression (online supplemental figure S2C).
 Figure 3
 Palbociclib treatment reduces dendritic cell infiltration in mammary tumors and inhibits dendritic cell differentiation ex vivo. (A) Scheme of tumor immune phenotyping experiment. Mice were inoculated with PYMT-C57 cells and treated with 100 mg/kg vehicle or palbociclib one time per day for 4 weeks. N=5 mice per treatment group. The tumor cell suspension was analyzed for immune cell surface marker expression using flow cytometry. (B) Percentages of CD11C+MHC+ dendritic cells and MHC+antigen-presenting cells within CD45+cells, cDC1 and cDC2 from individual tumors of the vehicle and palbociclib-treated mice. Statistical analysis of the difference between treatment groups was calculated using an unpaired t-test. (C–D) Immunophenotyping of BM, peripheral blood (blood) and spleen in PYMT-tumor bearing mice shown in figure 2L. CD11c+MHC-IIhi DCs, cDC1, cDC2 (C) and DC and monocyte precursors (D) were identified using a gating strategy described in online supplemental figure S3A. Dot plots show total cell numbers of immune cell subsets in indicated organs, n’s as in figure 2L. Statistical comparison between vehicle and treatment groups (palbociclib or abemaciclib) was performed using t-test. (E) Scheme of dendritic cell differentiation experiment. Murine bone marrow cells were cultured in the presence of GM-CSF and IL-4 with or without palbociclib. (F) Numbers of cells after 5 days of culture in DC differentiating conditions in the presence of vehicle or indicated doses of palbociclib. The experiment was performed in four biological replicates. Statistical comparison between vehicle and palbociclib treatment groups was performed using one-way analysis of variance with Dunnett’s post test. P values were adjusted for multiple comparisons. (G) Representative images of differentiated cells in indicated treatment groups from the experiment shown in D. (H–J) Murine bone marrow cells were cultured in the presence of GM-CSF and IL-4 (GM-CSF condition) or FLT3L and GM-CSF (FLT3 condition) with or without palbociclib for 8 days as described in methods. Percentages of Ki67+cells with the CD45+BMDCs were determined, percentage of Ki67 in undifferentiated (UnD) BM cells were determined as baseline. (H) Representative fluorescence-activating cell sorting plots of three independent experiments. (I) Dot plot showing %Ki67+CD45+ cells in indicated culture conditions. (J) Dot plots showing total numbers of BMDCs, cDC1 and cDC2 harvested in different culture conditions as described above. cDC1 and cDC2 percentages were determined (shown in online supplemental figure S2E) using gating strategy as described in online supplemental file 2 and total cell numbers were determined from their percentages and total BMDC numbers. Statistical comparison between vehicle and treatment groups (palbociclib or abemaciclib) was performed using a t-test. ns, not significant (p≥0.05), *p=0.01–0.05, **p=0.001–0.01, ***p=0.0001–0.001. BM, bone marrow; BMDC, bone marrow dendritic cell; cDC, conventional DC; CDP, common DC progenitor; cMoP, common monocyte progenitor; DC, dendritic cell; GM-CSF, granulocyte-macrophage colony-stimulating factor; IL, interleukin; MDP, monocyte and DC progenitor; MHC, major histocompatibility complex.
Since CDK4/6i therapy reduced DCs both systemically and in the TME, we analyzed if CDK4/6i therapy affected DC ontogeny by altering their precursors. The monocyte and DC progenitor (MDP) differentiates into common DC progenitor (CDP) and common monocyte progenitor (cMoP). Ly6Chi monocytes (referred to as Ly6Chi mono henceforth) are derived from cMoP while cDC1 and cDC2 are derived from the CDP.27 We found that palbociclib affected the numbers of MDP, CDP, cMoP, and Ly6Chi mono (identified as shown in online supplemental figure S3F) in the BM (figure 3D). Significant reduction in numbers of MDP and cMoP was seen in BM of abemaciclib-treated mice compared with vehicle-treated group (figure 3D). In the peripheral blood we saw a significant reduction in numbers of CDP and Ly6Chi mono in palbociclib and abemaciclib-treated groups compare to vehicle (figure 3D). In the spleen, palbociclib treatment significantly reduced the numbers of CDP, cMoP, and Ly6Chi mono and had a small effect on MDP, which was not statistically significant. Abemaciclib also reduced the numbers of MDP, CDP, cMoP and Ly6Chi mono, but these differences were not statistically significant (figure 3D). Thus, both palbociclib and abemaciclib affected DC precursors, DCs and DC subsets numbers, although there were some differences between the two drugs.
Based on these data, we hypothesized that palbociclib might negatively affect the differentiation of DCs from the BM progenitors. To test this hypothesis, we cultured mouse BM cells ex vivo in the presence of granulocyte-macrophage colony-stimulating factor(GM-CSF) and interleukin (IL)-4 (GM-CSF bone marrow dendritic cells (BMDCs)) or FLT3 and GM-CSF (FLT3-BMDCs) to induce DC differentiation (figure 3E). During incubation, cells were treated with either vehicle or palbociclib. We found that palbociclib significantly reduced the number of differentiated cells even at the lowest examined dose of 0.1 µM (figure 3F,G). Consequently, BMDC differentiation and proliferation were significantly affected resulting in significantly reduced BMDC numbers in both GM-CSF/IL-4 and FLT3/GM-CSF culture conditions (figure 3H,I). In agreement with our observation in vivo, the absolute numbers of MDP, CDP, cMoP, and Ly6Chi monocytes were significantly reduced (online supplemental figure S3C,D). Similarly, the numbers of cDC1 and cDC2 harvested using GM-CSF and FLT3 culture conditions were significantly reduced (figure 3J and online supplemental figure S3E).
CDK4/6i therapy inhibited DCs in patients with breast cancerTo determine if mouse model findings reflected CDK4/6i effects in human, we collected longitudinal peripheral blood samples from eight patients receiving palbociclib and endocrine therapy for the treatment of MBC either during their first cycle of treatment or subsequent cycles (table 1, figure 4A).
Table 1Patient, cancer, and treatment characteristics for human correlative studies
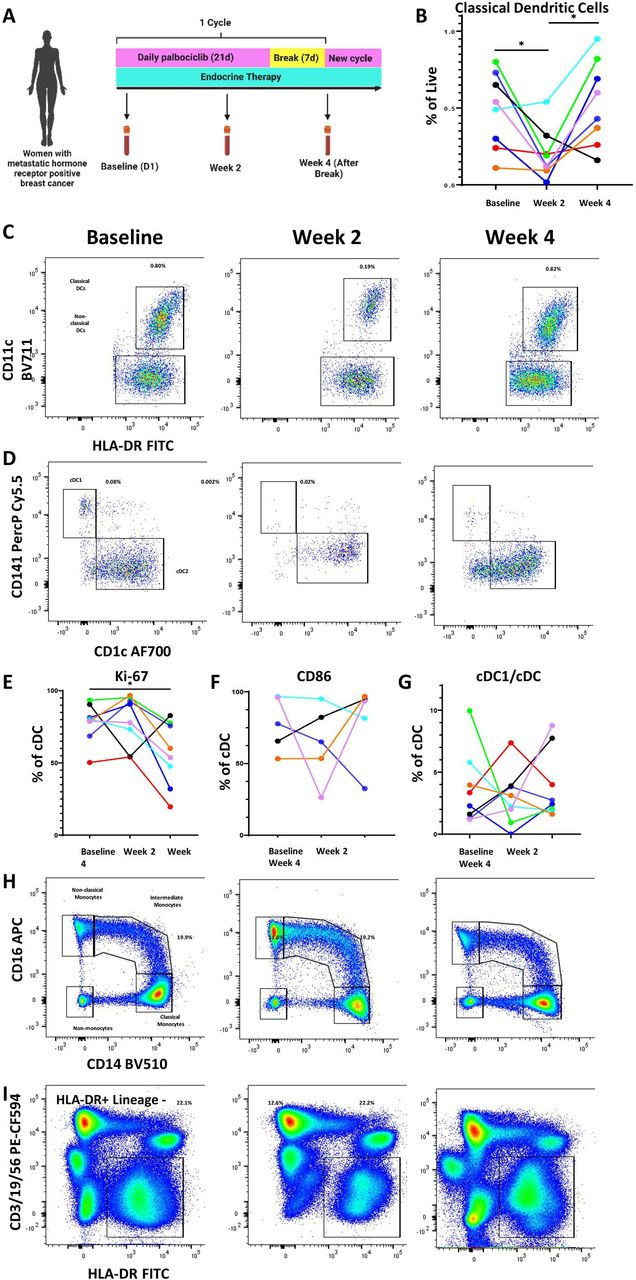 Figure 4
 Palbociclib reduces dendritic cells and other antigen-presenting cell populations in the peripheral blood of patients with metastatic hormone receptor-positive breast cancer. (A) Schema of peripheral blood collection in patients with metastatic breast cancer receiving palbociclib. Blood was drawn at baseline, after 2 weeks on treatment, and at the end of 4-week cycle, which was 1 week after treatment break. (B–D) Longitudinal change in classical dendritic cells (CD11c+HLA-DR+) and representative flow plots. (C,D) Representative flow plots of DC1 and DC2 subtypes of classical dendritic cells. (E–G) Longitudinal change in cDC1 proliferation as measured by Ki-67, activation as measured by CD86, and cDC1 fraction of classical dendritic cells. (H–I) Representative flow plots of monocytes and HLA-DR+/lineage—antigen-presenting cells. All percentages on representative flow plots are the percentage of live cells; for (H) this is a summation of classical, intermediate, and non-classical monocytes as a percentage of live cells. Different patients are represented by unique colors corresponding to them throughout the plots. Longitudinal changes were assessed by the Wilcoxon matched pairs signed-rank test, and significant results were indicated with * (p<0.05). cDC, conventional DC; DC, dendritic cells; FITC, fluorescein isothiocyanate; HLA-DR, human leukocyte antigen – DR isotype.
The standard cycle of therapy consists of 3 weeks on palbociclib followed by 1-week break. Endocrine therapy continues through this treatment period without cessation. Blood was collected at baseline prior to starting palbociclib, at 2 weeks after starting palbociclib, and at 4 weeks (after 1 week of palbociclib break). A quarter of the patients provided samples during their first cycle of treatment, whereas the remaining provided samples at the beginning, middle, and end of a subsequent treatment cycle. Peripheral blood mononuclear cells were isolated and stained for DC markers per gating strategy in online supplemental figure S4. Consistent with our preclinical studies, we observed a decrease in cDCs after treatment with palbociclib. Interestingly, we observed a rebound at week 4, time at which patients had been off of palbociclib for 1 week (figure 4B,C). This was also seen among the cDC1 subset known to be important for T cell-mediated immunity (figure 4D, online supplemental figure S5A). While proliferation, as measured by Ki67 staining, was not negatively impacted by palbociclib therapy in a significant pattern by 2 weeks, there was an overall statistically significant decrease of Ki67+cells by the end of the cycle compared with the beginning (figure 4E). Though the number and proliferation of cDCs were impacted, activation as measured by CD86 and antigen presentation capacity as measured by human leukocyte antigen – DR isotype (HLA-DR) expression were not impacted in any consistent manner (figure 4F, online supplemental figure S5B). Additionally, the fraction of cDC subsets was not affected by palbociclib treatment (figure 4G). Analysis of other antigen presentation subsets showed a similar pattern with a decrease in peripheral blood plasmacytoid DCs (online supplemental figure S5C), monocytes (summation of classical, intermediate, and non-classical monocytes) (figure 4H, online supplemental figure S5D), and HLA-DR-positive antigen-presenting cells (figure 4I, online supplemental figure S5E). These data suggest that the inhibitory effect of palbociclib on myeloid cells is likely upstream, on precursor cells in the BM. For patients whose clinical blood results were available at matching time points (online supplemental file 2), a decrease in absolute monocyte count (AMC) at 2 weeks and rebound after 1 week treatment break mirrored our flow cytometry findings for monocytes and DCs. Absolute neutrophil counts also generally showed a similar pattern but did not mirror the cDC trend as closely as AMC (online supplemental figure S5G). Absolute lymphocyte counts did not change across treatment or after treatment break (online supplemental figure S5H).
Adoptive transfer of ex vivo differentiated BMDC enhanced the responsiveness of CDK4/6i-treated tumors to ICBDC cells play an important role in initiating antitumor immune responses induced by immunotherapy.28 We hypothesized that palbociclib-induced reduction of DCs has a negative impact on immunotherapy response. Mice implanted with immunologically cold PYMT mammary tumors were treated with ICB (combined anti-PD-1 and anti-CTLA-4 antibodies) or matched isotype controls in combination with palbociclib or vehicle control (figure 5A). Palbociclib treatment alone, ICB treatment alone, or palbociclib treatment together with ICB caused similar tumor growth inhibition, which was modest, suggesting that the combination of ICB with CDK4/6i did not induce an additive or synergistic antitumor effect (figure 5B, online supplemental figure S6A,B). This result suggests that the addition of palbociclib to immunotherapy is not sufficient to enhance the antitumor immune responses in the studied PYMT breast cancer model, consistent with the immune cold nature of ER+breast cancer. However, we cannot exclude that similar treatment could be effective in immunogenic T cell-enriched tumor models reflective of immune hot cancers with pre-existing antitumor immune response.
留言 (0)