
記住我
Immunotherapies (IT) and immune checkpoint inhibitors (ICI) opened a new era in cancer treatment. ICI unleash antitumoral immune responses, leading to major clinical benefits in subgroups of patients. However, rate and duration of IT successes are variable among cancer types and patients. Indeed, in lung cancer antiprogrammed cell death protein 1 (anti-PD-1)/programmed death-ligand 1 (PD-L1) antagonistic antibodies offer a durable remission in 30% of patients.1 2 However, in colorectal cancer, the efficacy of anti-PD-1/PD-L1 was restricted to a small subset of patients presenting a high microsatellite instability status.3 4 Consequently, new IT targets and approaches are needed to achieve efficacy in a larger proportion of patients.
HVEM, or TNFRSF14, is a TNF-receptor family member largely expressed by healthy immune and non-immune cells and participates to immune homeostasis.5 6 HVEM is also upregulated in numerous solid and hematological malignancies such as melanoma,7 digestive cancers,8 9 or breast cancer.10 HVEM network of interactors is complex and induces either cell activation or inhibition.11 Indeed, HVEM binding to B and T lymphocyte attenuator (BTLA) and CD160 (BY55) triggers co-inhibitory signals whereas its binding to LIGHT (TNFSF14) and lymphotoxin-α are co-stimulatory . Similar to PD-1 and CTLA-4, BTLA is an important co-inhibitory receptor expressed by B and T cells.12 Therefore, targeting HVEM is a promising but complex IT strategy.13
In our study, we focused on lung and colorectal cancer that are two of the most worldwide common cancers in both men and women. In colorectal cancer, HVEM upregulation in malignant lesions is linked to tumor status and pathological stage, with an independent prognostic value.8 In lung cancer, HVEM expression seems to be a tumor driven mechanism, independent from the PD-L1 network that may contribute to immune escape.14
Our team previously described a monoclonal anti-HVEM monoclonal antibody (mAb) (anti-HVEM18-10) that preferentially inhibits HVEM interaction with BTLA and enhances γδ-T cells responses against lymphoma.15 Here, we further evaluate the CIS-activity and TRANS-activity of anti-HVEM18-10. CIS-activity represents the antibody binding on effector HVEM+CD4+ and HVEM+CD8+ T cells directly in the absence of huHVEM+ target cell lines. TRANS-activity is measured by checking immune cell activation in the presence of a HVEM+ cell line in co-culture. We also show the interest of anti-HVEM18-10 combination with other ICIs such as anti-PD-L1 mAb, although HVEM18-10 alone is sufficient to trigger T cell activation in the absence of PD-L1 expression. In order to better understand HVEM18-10 mAb effect in vivo, we developed an innovative syngeneic immunocompetent mouse model expressing human BTLA (huBTLA+/+) or both human BTLA and human HVEM (huBTLA+/+huHVEM+/+, (double KI (DKI)). Our experiments performed in both mouse models showed that anti-HVEM18-10 treatment was efficient to decrease tumor growth and strengthened local immune response. Moreover, the rechallenge of tumor-free mice (20% of treated mice) demonstrates that the immune response is durable with a marked memory T cells phenotype.
Altogether, our preclinical data validate anti-HVEM18-10 as a promising antibody to use in clinics alone or in combination with existing therapies (anti-PD-1/anti-PD-L1/anti-CTLA-4).
MethodsAntibodiesAnti-HVEM18-10 and anti-PD-L1 3.1 are homemade antibodies that have been described previously.15,16 Briefly, mAbs are murine IgG1 antihuman HVEM or PD-L1 mAb, produced as ascites and purified by protein A binding and elution with the Affi-gel Protein A MAPS II Kit (Bio-Rad, Marnes-La-Coquette, France). Mouse IgG1 isotype control was purchased from Miltenyi Biotec (Bergisch Gladbach, Germany).
Transcriptomic expression of HVEM and PD-L1To study the transcriptomic expression of HVEM and PD-L1 data were extracted from The Cancer Genome Atlas (TCGA) database containing 526 lung adenocarcinoma samples and 388 colorectal carcinoma samples. Tumor cell lines gene expression values were extracted from the Cancer Cell Line Encyclopedia. Data were normalized and expressed as log2(TPM+1) of raw value.
Co-culture and proliferation assaysAfter thawing and overnight resting in RPMI supplemented with 10% fetal calf serum, peripheral blood mononuclear cells (PBMCs) were stained with Cell Trace Violet (Thermo isher) according to manufacturer’s instructions. Co-culture assays were there performed during 72 hours and described in online supplemental material.
Knockin mouse modelGeneration and genotyping of B6-Tnfrsf14tm1Ciphe and BtlaTm1Ciphe are described in online supplemental material. Mice were bred and maintained under specific pathogen-free conditions at the CIPHE animal facility.
Experimental tumor growth experimentsSingle-cell suspensions of MC-38 or MC-38huHVEM colorectal cancer cells were injected (0.5×10⁶ for neo challenge, 2×10⁶ for rechallenge) subcutaneously in the right flank of huBTLA+/+huBTLA+/+ mice. Mice bearing tumor between 50 and 100 mm3 were then randomized at day 9 and mice were injected with an isotype control (2 mg/kg or 10 mg/kg) or anti-HVEM18-10 (2 mg/kg or 10 mg/kg) or CTLA-4 antibody (2 mg/kg) every 3–4 days with for a total of six injections.
Tumor preparation for mass cytometry and immunoprofilingTumors were resected from huBTLA+/+ and DKI mice which received anti-HVEM18-10, anti-CTLA-4, or isotype treatment. Tumors were collected and digested using the Tumor Dissociation Kit (Miltenyi Biotech). Single cells suspension was then prepared and stained then acquired on a Helios mass cytometer (Cy-TOF, Fluidigm) and analyzed using the OMIQ software platform (OMIQ). Protocol is detailed in online supplemental method.
Unsupervised CyTOF data clustering and phenotypic analysisCyTOF data files were exported (Helios program, Fluidigm), debarcoded and live cells were gated in FlowJo (Treestar, BD). Live cell.fcs files were exported and analyzed using OMIQ online platform (OMIQ).17 Detailed protocol for data clustering and phenotypic analysis is described in online supplemental method. All used panels are shown in tables 1–4.
Table 1Flow cytometry panel for HVEM expression on T cells subsets
Table 2Flow cytometry panel for proliferation assay
Table 3Panel for tumor infiltrating lymphocytes exploration with mass cytometry (Ext238)
Table 4Flow cytometry panel for lymph node phenotyping
ResultsHVEM is highly expressed on T cells and the blockade of HVEM in CIS enhances T cell activationWe first studied the effect of anti-HVEM18-10 blockade directly on T cells (CIS-blockade). PBMCs were isolated from healthy donors and stimulated for 72 hours with anti-CD3 in combination with anti-HVEM18-10 or an IgG1 control mAbs. We found that HVEM was highly expressed on activated CD4+ and CD8+ T cells (figure 1A,B). HVEM expression is increased on stimulation in CD4+ T cells (figure 1A), this effect was marked on CD4+ effector memory T cells (figure 1C). HVEM expression did not differ on CD8+ T cell, on stimulation or memory subtypes (figure 1B,D). HVEM is highly expressed on less differentiated T cells subsets (naïves and central memory (CM)) and tends to be less expressed on more differentiated subsets (effector memory (EM), EMRA[effector memory cells re-expressing CD45RA). Thus, HVEM expression was significantly upregulated on CD4+ EM, but not other T cell subsets following activation. T cell proliferation and activation marked by the expression of CD25 significantly increased on anti-HVEM co-stimulation compared with control (figure 1E–H). Taken together, our results show that CIS-HVEM blockade enhances T cell activation.
 Figure 1
 HVEM is highly expressed on T cells and the CIS-HVEM blockade enhance T cells activation. (A–H) Peripheral blood mononuclear cells (PBMCs) were isolated from healthy donors, and cultured for 72 hours with anti-CD3 (OKT3) stimulation alone (orange bars), with OKT3 stimulation and anti-HVEM18-10 treatment (blue bars/lines), or without any stimulation (black bars). HVEM expression was assessed in resting (black bars) and activated (orange bars) CD4+ (A), CD4+ T cells subsets (naïve, central memory (CM), effector memory (EM), and EMRA) (B), CD8+ (C), CD8+ T cells subsets (D) by flow cytometry on healthy donors (n=3). (E–H) PBMCs were incubated with OKT3 and anti-HVEM18-10 antibody (blue bars/lines) or a control monoclonal antibody (mAb) IgG1 (orange bars/lines). Proliferation profile of T cells was assessed by flow cytometry detecting Cell Trace Violet (CTV) (E, G for CD4+ and CD8+ T cells, respectively) or CD25 staining (F, H for CD4+ and CD8+ T cells, respectively). (E–H) One representative plot is shown for each T cell subset. Bar plots are the mean±SEM of four different healthy donor samples. (A–D n=3, E–H n=4). *P<0.05; **p<0.01; ***p<0.001 (Student’s t-test). ns, not significant.
HVEM expression is higher than PD-L1 in human lung and colorectal cancersNext, we decided to study the expression status of HVEM on tumor from different cancers. Transcriptomic data from the TCGA containing 525 adenocarcinoma samples and 300 colorectal carcinoma samples were extracted, and the expression of HVEM and PD-L1 was examined (figure 2A,B). We found that HVEM was highly expressed in both cancers. While PD-L1 expression was high in lung cancer and low in colorectal cancers. Interestingly, HVEM expression is greater than that of PD-L1 expression in both cancers (figure 2A,B). Next, we studied HVEM and PD-L1 transcriptomic expression (from the cancer cell line encyclopedia) and cell surface expression by cytometry in lung and colorectal cancer cell lines (figure 2C,D). HVEM and PD-L1 are heterogeneously expressed in lung cancer cell lines, we selected two lung cancer cell lines that expressed both genes (NCIH2291) or in large majority HVEM compared with PD-L1 (NCIH2405) for subsequent experiments (figure 2C). The vast majority of colorectal cancer cell line highly expressed HVEM whereas PD-L1 was expressed in lower amount (figure 2D). Reflecting these observations, we selected HVEM+PD-L1− HT29 cell line for subsequent experiments (figure 2D). These results were confirmed in NCIH2291 (HVEM+ PD-L1+), NCIH2405 (HVEM+ PD-L1−), and HT29 (HVEM+PD-L1−) by flow cytometry assessment of PD-L1 and HVEM surface expression (figure 2E,F).
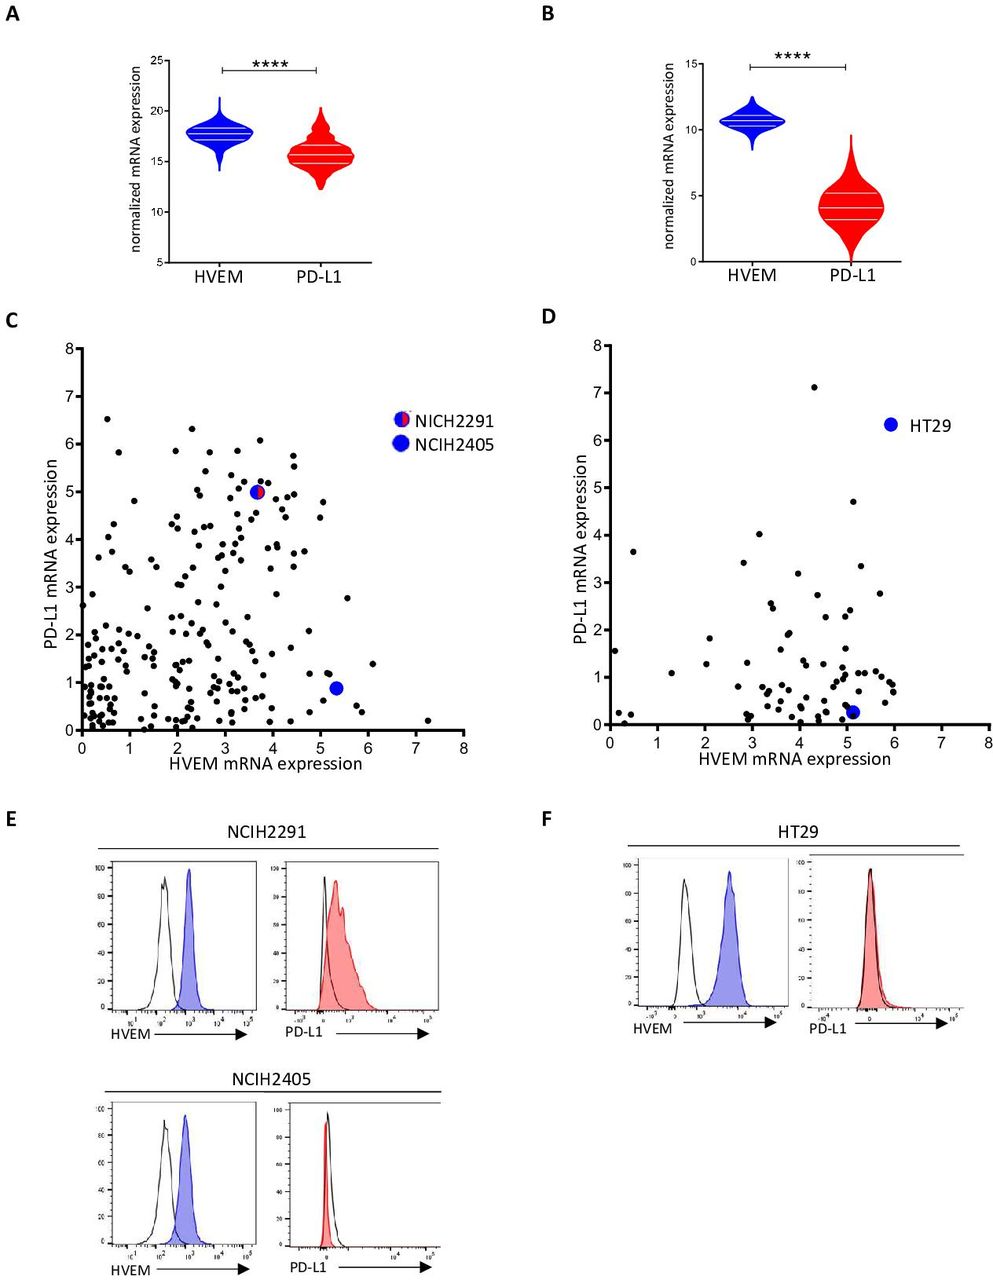 Figure 2
 HVEM is more expressed than programmed death-ligand 1 (PD-L1) in lung and colorectal cancers. HVEM and PD-L1 transcriptomic expression was analyzed in 526 lung adenocarcinoma samples (A) and 388 colorectal carcinoma samples (B). Normalized expression data were extracted from The Cancer Genome Atlas (TCGA) database (****p<0.0001). HVEM and PD-L1 transcriptomic expression was analyzed in lung (C) and colorectal (D) cancer cell lines. (C, D) Data are extracted from the Cancer Cell Line Encyclopedia (CCLE) and expressed in log2(TPM+1). HVEM and PD-L1 phenotypic expression on selected lung (E) (NCIH2291 and NCIH2405, respectively) and colorectal (F) cancer cell line (HT29). HVEM staining in dark gray and control isotype in light gray. mRNA, messenger RNA.
Anti-HVEM18-10 enhances T cells responses against lung cancer cell line NCIH2291Knowing the expression of HVEM among tumor cell lines allowed us to further test anti-HVEM effect. Co-cultures of PBMCs and the lung cancer cell line NCIH2291 (HVEM+ PD-L1+) were performed during 72 hours in the presence of anti-CD3 in combination with an IgG1 control or anti-HVEM18-10. The addition of anti-HVEM18-10 to the co-culture drastically increased proliferation ratio and CD25 expression of CD4+ and CD8+ T cells compared with control (figure 3A–D). Moreover, the addition of anti-HVEM18-10 to the co-culture also drastically increased the amount of procytotoxic cytokines tumor necrosis factor (TNF)-α and interferon (IFN)-γ as measured by ELISA (figure 3E,F). These results confirm an effect of the blockade of HVEM on CIS-T cell activation and TRANS -activation as well.
 Figure 3
 Anti-HVEM18-10 enhances T cells responses against NCIH2291. Adherent lung cancer cell line NCIH2291 was seeded in wells 24 hours before the experiment. Then we cultured peripheral blood mononuclear cells from healthy donors for 72 hours with OKT3 stimulation and treated or not with anti-HVEM18-10 antibody (blue bars/lines). (A–D) Proliferation profile of T cells by Cell Trace Violet (CTV) staining (A for CD4+ and B for CD8+ T cells) and CD25 expression (C for CD4+ and D for CD8+ T cells). (E, F) Tumor necrosis factor (TNF)-α (E) and interferon (IFN)-γ (F) secretion was measured by ELISA in culture supernatant. Bar plots are the mean±SEM of different healthy donor samples (A–D n=13; E–F n=10). *P<0.05; ***p<0.001; ****p<0.0001 (Student’s t-test).
Anti-HVEM18-10 triggers T cell activation, proliferation, and synergizes with anti-PD-L1Anti-PD-L1 antibody has been a real game changer in IT to treat patients with lung cancer.18 Therefore, we thought to test whether the combination of anti-HVEM18-10 to anti-PD-L1 could improve T cell responses in co-culture experiments with HVEM and PD-L1-positive lung tumor cell line. PBMCs were primed with suboptimal anti-CD3 dose, then activated with anti-HVEM18-10, anti-PD-L1, both antibodies (combo), or IgG1 control during 72 hours (figure 4A–D). The addition of anti-HVEM18-10 (blue bar) was sufficient to improve T cells proliferation and CD25 expression compared with control. Likewise, the anti-PD-L1 (red bar) also increased T cell activation and proliferation ratio compared with control. Interestingly, the combination of anti-HVEM18-10 and anti-PD-L1 (purple bar) in culture showed even greater effect on T cell proliferation and CD25 expression compared with the separate conditions. These results highlight the potential of anti-HVEM18-10 and anti-PD-L1 combination to strengthen T cell activation.
 Figure 4
 Anti-HVEM18-10 synergizes with anti-programmed death-ligand 1 (PD-L1) to enhance T cells responses against lung cancer cell line NCIH2291. Adherent lung cancer cell line NCIH2291 were cultured with peripheral blood mononuclear cells from healthy donors for 72 hours with CD3 stimulation and treated with anti-HVEM18-10 antibody (blue bars/lines) or not (black bars/line) (A–D) proliferation profile of T cells by Cell Trace Violet (CTV) staining (A for CD4+ and C for CD8+ T cells) and CD25 expression (B for CD4+ and D for CD8+ T cells). Bar plots are the mean±SEM of different healthy donors samples (n=13 for IgG1, anti-HVEM, and anti-PD-L1 conditions, n=3 for combo condition). *P<0.05; **p<0.01; ***p<0.001; ****p<0.0001 (Student’s t-test). ns, not significant.
Interestingly, we next tested whether anti-HVEM18-10 could enhance T cell response against PD-L1− lung and colorectal cancer cell line (online supplemental figure 1). Anti-HVEM18-10 was sufficient to improve CD4+ and CD8+ T cell activation with a marked increase of CD25 expression and proliferation in co-culture with either lung or colorectal cell line, validating the use of anti-HVEM18-10 with PD-L1− tumors for future IT treatments.
huBTLA+/+ and DKI mice show wild-type-like hematopoietic cell proportionsTo test whether the effect of anti-HVEM18-10 in vivo occurs via CIS-blockade or TRANS-blockade using preclinical tumor models, we developed KI mice model expressing either huBTLA+/+ or both huBTLA+/+/huHVEM+/+ or DKI (figure 5A). To produce huBTLA+/+ mice, exon 2 from wild-type mouse was substituted by human exon 2. Likewise, HVEM+/+ mice were developed by replacing exon 1 with human HVEM gene (tnfrsf14-001) exon 1. These mice were then crossed to obtain DKI mice. The presence of the insertion was confirmed by PCR and cytometry. The expression of human/mouse HVEM on T cells, DC (dendritic cells), Ly6C+ cells and neutrophil and BTLA on T cells and B cells was examined by cytometry (online supplemental figure 2A,B). Both HuBTLA+/+ and DKI mice showed the same number of cells in the spleen (figure 5B) and same proportion of T cells by cytometry. Other lymphoid and myeloid cells are also found in the same proportions in both models (figure 5C). Indeed, the frequencies of B cells, γδ-Tcells and natural killer cells were similar among mice models. Similarly, myeloid cell frequencies (PMN[Polymorphonuclear], cDC1, cDC2, macrophages, monocytes) remained unchanged among these models (figure 5D). Gating strategies for different cells subset are shown in online supplemental figure 2C. These observations allowed further in vivo tumor response studies with these new mouse models.
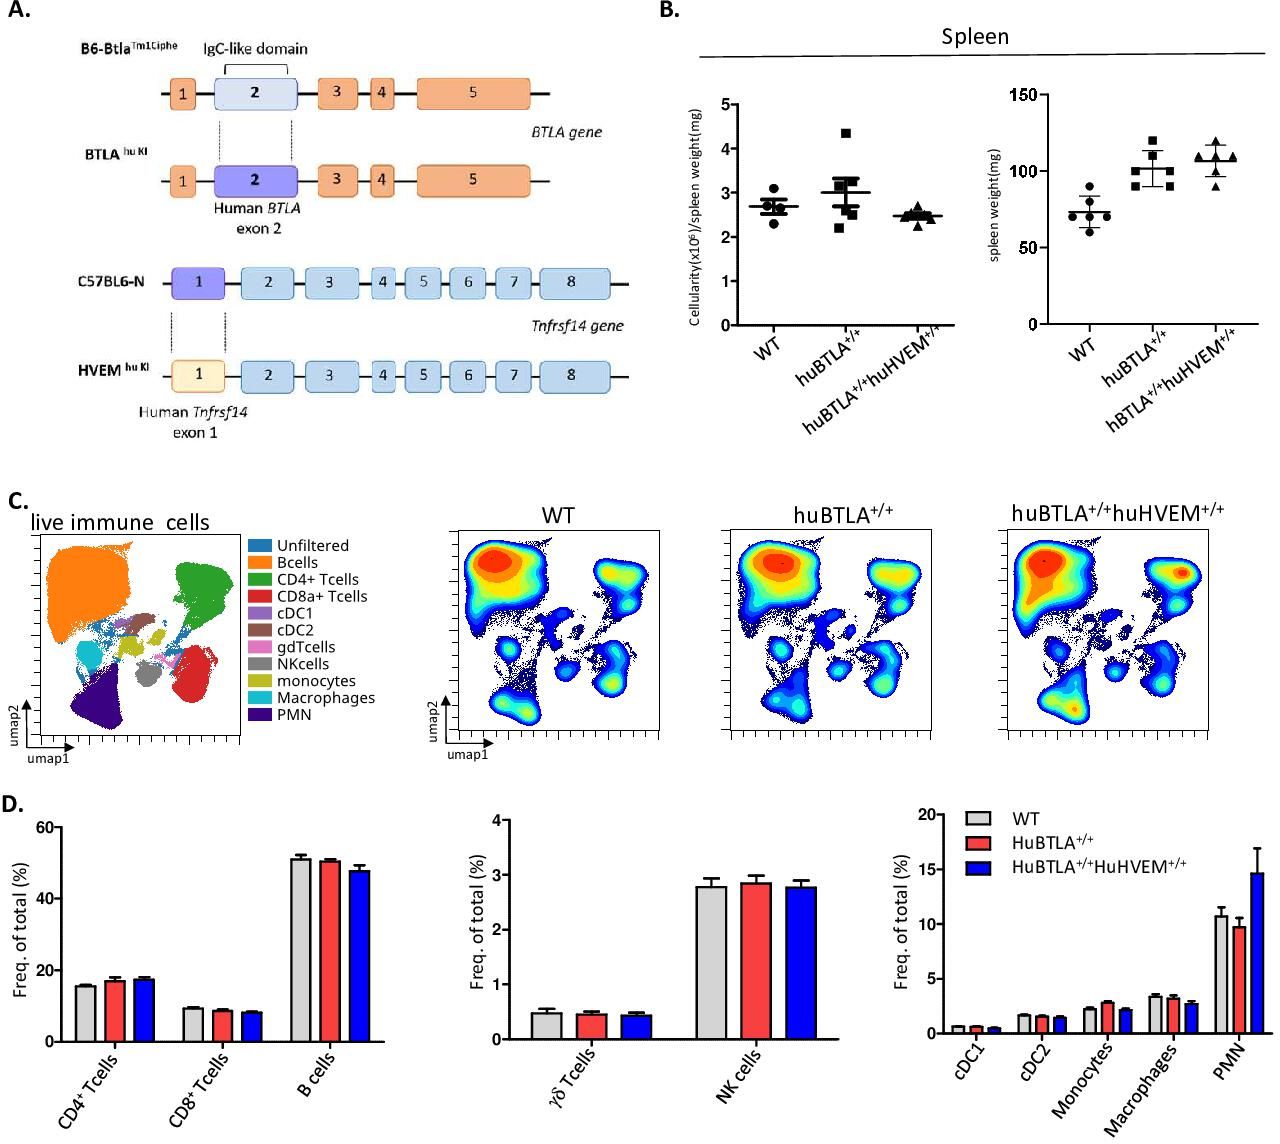 Figure 5
 Human (hu) B and T lymphocyte attenuator (BTLA) and double knockin (DKI) mice show the same hematopoietics cell homeostasis. (A) Representative scheme of huBTLA+/+huBTLA+/+ and huHVEM+/+ genetic modification. For huBTLA+/+huBTLA+/+, murine exon 2 was replaced by huBTLA exon 2 and for huHVEM+/+murine exon 1 was replaced by huHVEM gene exon 1. (B) Numbers of total cell per spleen weight for wild-type (WT), huBTLA+/+huBTLA+/+, and huHVEM+/+ is represented (left) spleen weight (mg) is represented on the right for six control (Ctrl), huBTLA+/+, and six huHVEM+/+huBTLA+/+ mice. (C) uniform manifold approximation and projection (UMAP) showing the distribution of immune cell subset within WT, huBTLA, and DKI mice. (D) Immune cell subset frequency was quantified in the three mice groups. Density UMAP representing major and minor cell subsets (bottom). NK, naturak killer.
Blocking trans-BTLA-HVEM binding in vivo is sufficient to decrease solid tumor growthWe then decided to challenge huBTLA+/+ mice with a colorectal cancer cell line MC-38 that is not expressing constitutively HVEM; 0.5×10⁶ MC-38 tumor cells were injected subcutaneously in the right flank of huBTLA+/+ mice. Mice bearing tumor between 50 and 100 mm3 were then randomized at day 9 and mice were injected with anti-HVEM18-10 or isotype control every 3–4 days with for a total of six injections (online supplemental figure 3B). As envisioned, tumor growth of parental MC-38 (HVEM-) injected with an isotype control or with anti-HVEM18-10 at 10 mg/kg did not show any significant decrease in tumor growth. We then transduced huHVEM in MC-38 cells and selected a clone that that was able to bind effectively anti-HVEM18-10 (namely: MC-38huHVEM; online supplemental figure 3A). MC-38huHVEM tumor cells were injected subcutaneously as previously described. Here, we observed a decrease in tumor growth at any dose of anti-HVEM18-10 used 2 and 10 mg/kg (figure 6B; online supplemental figure 3C). Moreover, 2 mice out of 10 in the 2 mg/kg dose and 1 out of 10 in the 10 mg/kg dose fully rejected the tumors. These three tumor free mice were rechallenged with fourfold more concentrated MC-38huHVEM tumors cell inoculate (ie, 2×10⁶ cells) in contralateral flank. All animals were monitored during 21 days postchallenge to ensure immunological memory persistence. In two of these three mice, the tumor was not measurable at day 21. However, after the euthanasia of these three mice at day 21, tumor mass was absent in their left flank revealing the presence of a scar tissue instead (figure 6C). Altogether, these data confirmed the in vivo efficiency of anti-HVEM18-10 to block trans-BTLA-HVEM binding.
 Figure 6
 Blocking trans-B and T lymphocyte attenuator (BTLA)-HVEM binding in vivo is sufficient to decrease solid tumor growth. (A) Scheme representing in vivo tumor experiments settings. (B) Measure of tumor growth showed as ratio to size of tumor at randomization day. Colorectal cancer cells MC-38huHVEM were injected (0.5×10⁶) at day 0 in human (hu)BTLA+/+ mice and isotype (ISO) control (ctrl) (black) or anti-HVEM18-10 antibody at 2 mg/kg (red) concentration were injected. (C) Tumor-free mice from B and C measure of tumor growth after MC-38huHVEM tumor cells rechallenge (2×10⁶). (B–C) n≥7; (D) n=3. **p<0.01 (two-way analysis of variance). mAb, monoclonal antibody.
Anti-HVEM treatment decreases tumor growth, exhausted CD8+ T cell, KLRG1- regulatory T cell infiltrate and increases EM conventional CD4+ T cell infiltrateThen, we investigated the effect of anti-HVEM on DKI lymphocytes (figure 7A). The proliferation of sorted spleen T cells was assessed after 72 hours of stimulations with coated anti-CD3 and anti-HVEM18-10 or isotype control at increasing concentration. The addition of anti-HVEM18-10 increased DKI T cells proliferation in a dose-dependent manner similarly to human T cells (figure 1), validating in vitro this new mouse model (figure 7A). The effect of anti-HVEM18-10 in vivo was then studied using DKI mice. DKI mice were challenged with 0.5×10⁶ MC-38huHVEM tumor cells which were injected subcutaneously as described previously. We observed a decrease in tumor growth when anti-HVEM18-10 was injected at 2 mg/kg (figure 7B). Moreover, 3 mice out of 12 in the anti-HVEM18-10 group completely rejected the tumors and were later investigated in rechallenge experiments. To understand the immune mechanisms underlying tumor reduction after anti-HVEM18-10 treatment, tumor infiltrating lymphocytes (TILs) phenotypes were investigated in anti-HVEM18-10-treated mice and isotype controls by mass cytometry. Tumor infiltrating T cells was mapped using UMAPs in anti-HVEM18-10 and isotype controls treated mice. Density analysis of UMAPs showed phenotypic variations between conditions (figure 7C), that were investigated by unsupervised analysis using T cell subset markers (online supplemental figure 4A–C). Next, a clustering of tumor infiltrating T cells was performed using the well-described PhenoGraph algorithm and the 19 identified clusters were projected on the UMAP highlighting the heterogeneity of intratrumoral T cells. Five clusters belonging to regulatory T (Treg) cells (CD4+CD25+FoxP3+), eight clusters belonging to conventional CD4+ T cells (conv. CD4+ T cells/non-Tregs) and six clusters belonging to CD8+ T cells were identified (figure 7D,E). Interestingly, while T cell clusters were very heterogeneous, only three clusters were significantly altered in anti-HVEM18-10 compared with isotype control treated mice (figure 7E–H and online supplemental figure 4B). These clusters were manually gated for validation in online supplemental figure 4D,E. First, cluster 13, a subset of KLRG1-CTLA-4+Ki67+ Tregs, was statistically decreased in anti-HVEM18-10 condition (figure 7F and online supplemental figure 4E). Cluster 11, composed of EM, CD44+CD62L- CD4+ conv. T cells, was significantly increased under anti-HVEM18-10 treatment (figure 7G and online supplemental figure 4E). In this cluster, EM CD4+ T cells did not exhibit marks of immunosuppression or exhaustion such as high levels of PD-1, TIM-3, or T cell immunoreceptor with Ig and ITIM domains (TIGIT). Therefore, these EM CD4+ T cells may favor antitumoral immune response. Third, cluster 17, an EM (CD44+CD62L-) CD8+ T cell subsets showed higher expression of PD-1 and expressed T-cell immunoglobulin and mucin containing protein-3 (TIM-3), Lymphocyte-activation gene 3 (LAG-3), and CTLA-4. Therefore, we labeled these EM CD8+ T cells as exhausted. Interestingly, these exhausted CD8+ T cells decreased under anti-HVEM18-10 treatment (figure 7H and online supplemental figure 4E). Taken together, our results demonstrate a loss in immunosuppressive T cell subsets (KLRG1- Tregs, and exhausted EM CD8+ T cells) and an increase in EM CD4+ T cells. These phenotypic changes contribute to the reduction of tumor growth and correspond to phenotypes observed in previous studies showing tumor reduction following immunotherapeutic treatments in mouse models.19 20
 Figure 7
 Anti-HVEM treatment decreases tumor growth, exhausted CD8+ T cell, KLRG1- regulatory T (Treg) cells infiltrate, and increases effector memory (EM) conventional (conv.) CD4+ T cell infiltrate. (A) T cells from double knockin (DKI) mice or wild-type (WT) were cultured with CD3 alone or with anti-HVEM18-10 at increasing concentration. T cells proliferation assessed by luminescence using Cell titerglo. (B) Measure of tumor growth showed as ratio to size of tumor at randomization day. Colorectal cancer cells MC-38huHVEM were injected (0.5×10⁶) at day 0, and isotype control (Iso ctrl) (black) or anti-HVEM18-10 antibody at 2 mg/kg (blue) concentration were injected. (C) UMAP analysis of anti-HVEM18-10 (blue) or Iso ctrl (Iso, gray). Density analysis revealed phenotypic modification between anti-HVEM treatment and Isotype treatment. (D) PhenoGraph clustering was performed on tumor infiltrating lymphocytes (TILs) from anti-HVEM18-10 and Iso ctrl-treated mice and represented as a UMAP. Nineteen meta-clusters were identified among T cells (top). Treg (light blue), conv. CD4+ T cell (dark blue), and CD8+ T cell (green) cluster gating on a UMAP (bottom). (E) Heatmap representation of marker expression among the 19 identified PhenoGraph meta-clusters. Cluster were associated with Tregs (light blue), conv. CD4+ T cells (dark blue), and CD8+ T cells (green). Bar charts represent cluster variation between anti-HVEM18-10 treatment compared with Iso ctrl in Tregs (F), conv. CD4+ T cells (G), and CD8+ T cells (H). *P<0.05; **p<0.01; ***p<0.001; ****p<0.0001.
Anti-HVEM-therapy builds a tumor-specific memory T cell response associated with tumor antigen responsive T cellsWe next decided to compare in vivo the effect of anti-HVEM response to a well-known checkpoint inhibitor anti-CTLA-4 on tumor growth and T cell activation. DKI mice were challenged with 2×10⁶ MC-38huHVEM tumor cells as previously described, then injected with an isotype control, anti-HVEM18-10 (2 mg/kg), or anti-CTLA-4 (2 mg/kg) at days 7 and 10. Tumor infiltrating and draining lymph node (LN) T cell phenotype was analyzed at day 14. As expected, the injection of anti-HVEM18-10 or anti-CTLA-4 decreased tumor growth and led to total tumor rejection in three mice under anti-HVEM and anti-CTLA-4 treatment (figure 8A and online supplemental figures 5A–C). Hence, tumor-free mice respectively from anti-HVEM and anti-CTLA-4 treatment were rechallenged with 6×10⁶ cells MC-38huHVEM tumors cells in contralateral flank. Interestingly, tumors did not grow in these mice 14 days after rechallenge. Therefore, we hypothesized that primary tumor rejection built an anti-tumor T cell memory response that led to rechallenge rejection. Hence, we compared T cell response in rechallenged mice following anti-HVEM18-10 and anti-CTLA-4 treatments. Draining LN were resected and dissociated then T cell phenotypes were assessed by flow cytometry. T cell mapping was drastically modified after rechallenge compared with neo-challenge as shown by density UMAPs (figure 8B). Then, memory T cell subsets were gated (using CD44 and CD62L expression) and neo-challenged and rechallenged mice treated with anti-HVEM or anti-CTLA-4 were compared. We found that rechallenged treated mice either for anti-HVEM18-10 or anti-CTLA-4 were enriched in EM CD4+ T cells (CD44+CD62-L-) compared with their neo-challenged counterpart and isotype control (figure 8C, left). This increase was significantly superior in rechallenged CTLA-4-treated compared with rechallenged HVEM-treated mice (figure 8C, left). Noteworthy, naïve CD4+ T cells decreased after rechallenge. Concerning CD8+ T cells, we found that rechallenged mice with anti-HVEM18-10 or anti-CTLA-4 showed more CM CD8+ T cells (CD44+CD62-L+) compared with their neo-challenged counterpart and isotype control (figure 8C, right and online supplemental figure 5D). This increase tended to be superior in rechallenged HVEM-treated compared with rechallenged CTLA-4-treated mice. Again, naïve CD8+ T cells decreased as well on treatments. Taken together, these results show an enrichment in memory CD8+ and CD4+ T cells in rechallenged conditions.
 Figure 8
 Anti-HVEM18-10 therapy builds a memory T cell response associated with CD4+ and CD8+ tumor antigen responsive T cells. (A) Tumor growth profile overtime following, isotype control (black), anti-CTLA-4 (blue), or anti-HVEM18-10 (red) treatment. (B) Lymph nodes (LN) were dissociated and cell stained for flow cytometry. UMAPs represent the phenotypic distribution of T cells within LN in isotype control mice (n=6), anti-HVEM18-10 (n=6), or anti-CTLA-4 (n=3) treated neo-challenged mice or anti-HVEM18-10 (n=3) or anti-CTLA-4 treated rechallenged mice (n=3). (C) Study of effector memory (EM), central memory (CM), and naïve conventional (conv.) CD4+ and CD8+ T cells among neo-challenged and rechallenged conditions (D) Study of immune checkpoint expression in conv. CD4+ T cells among neo-challenged and rechallenged conditions. (E) Study of immune checkpoint expression in CD8+ T cells among neo-challenged and rechallenged conditions. (F) Regulatory T (Treg) cells frequency among neo-challenged and rechallenged conditions. (G) Study of immune checkpoint expression in Tregs among neo-challenged and rechallenged conditions. (H) Study of CD49d+CD11a+ tumor-specific CD4+ and CD8+ T cells in neo-challenged and rechallenged conditions. *P<0.05; **p<0.01; ***p<0.001.
Next, we investigated activation marker expression on CD4+ and CD8+ T cells from LN (figure 8D,E and online supplemental figure 5E). In CD4+ T cells no modification in the expression of CD40L, IL-2Rβ, or 4-1BB was observed. However, the expression of inducible costimulator (ICOS) in rechallenged mice after anti-HVEM18-10 or anti-CTLA-4 treatment increased compared with controls. Similarly, CD69+CD4+ T cells were more abundant in rechallenged mice compared with controls. Noteworthy, CD69 overexpression was greater in anti-CTLA4 rechallenged mice compared with anti-HVEM rechallenged mice (figure 8D). In CD8+ T cells, an overexpression of IL2-Rβ in rechallenged mice compared with controls was observed. Here, IL2-Rβ expression was greater in anti-HVEM18-10 rechallenged mice compared with anti-CTLA-4 rechallenged mice (figure 8E). This suggests a better response to IL-2 or IL-15 and consequently more CD8+ T cell activation. Noteworthy, we did not notice any difference in the expression of CD69 on CD8+ T cells (figure 8E). Next, the Treg population within LNs after rechallenge was investigated. Treg frequency increased after rechallenge in both anti-HVEM18-10 and anti-CTLA-4 mice compared with anti-HVEM18-10 neo-challenged group (
留言 (0)