
記住我


Total knee arthroplasty (TKA) is a cost-effective procedure, but 8% to 26.5% of patients have substantial postoperative pain1. Periarticular corticosteroids (PAS)2–12 and intravenous corticosteroids (IVS)13–17 have been demonstrated to be effective in providing acute pain relief and better mobilization after TKA. The present study aimed to compare pain relief and functional recovery after TKA among groups that received IVS, PAS, or a combination of both (IVSPAS). We hypothesized that patients receiving IVSPAS would report less postoperative pain and have better functional recovery than those receiving IVS, PAS, or a saline solution placebo (P) alone.
Materials and MethodsThis parallel randomized clinical trial (RCT) was approved by the local research ethics committee and registered at ClinicalTrials.gov (NCT03901768). Written informed consent was obtained from the patients.
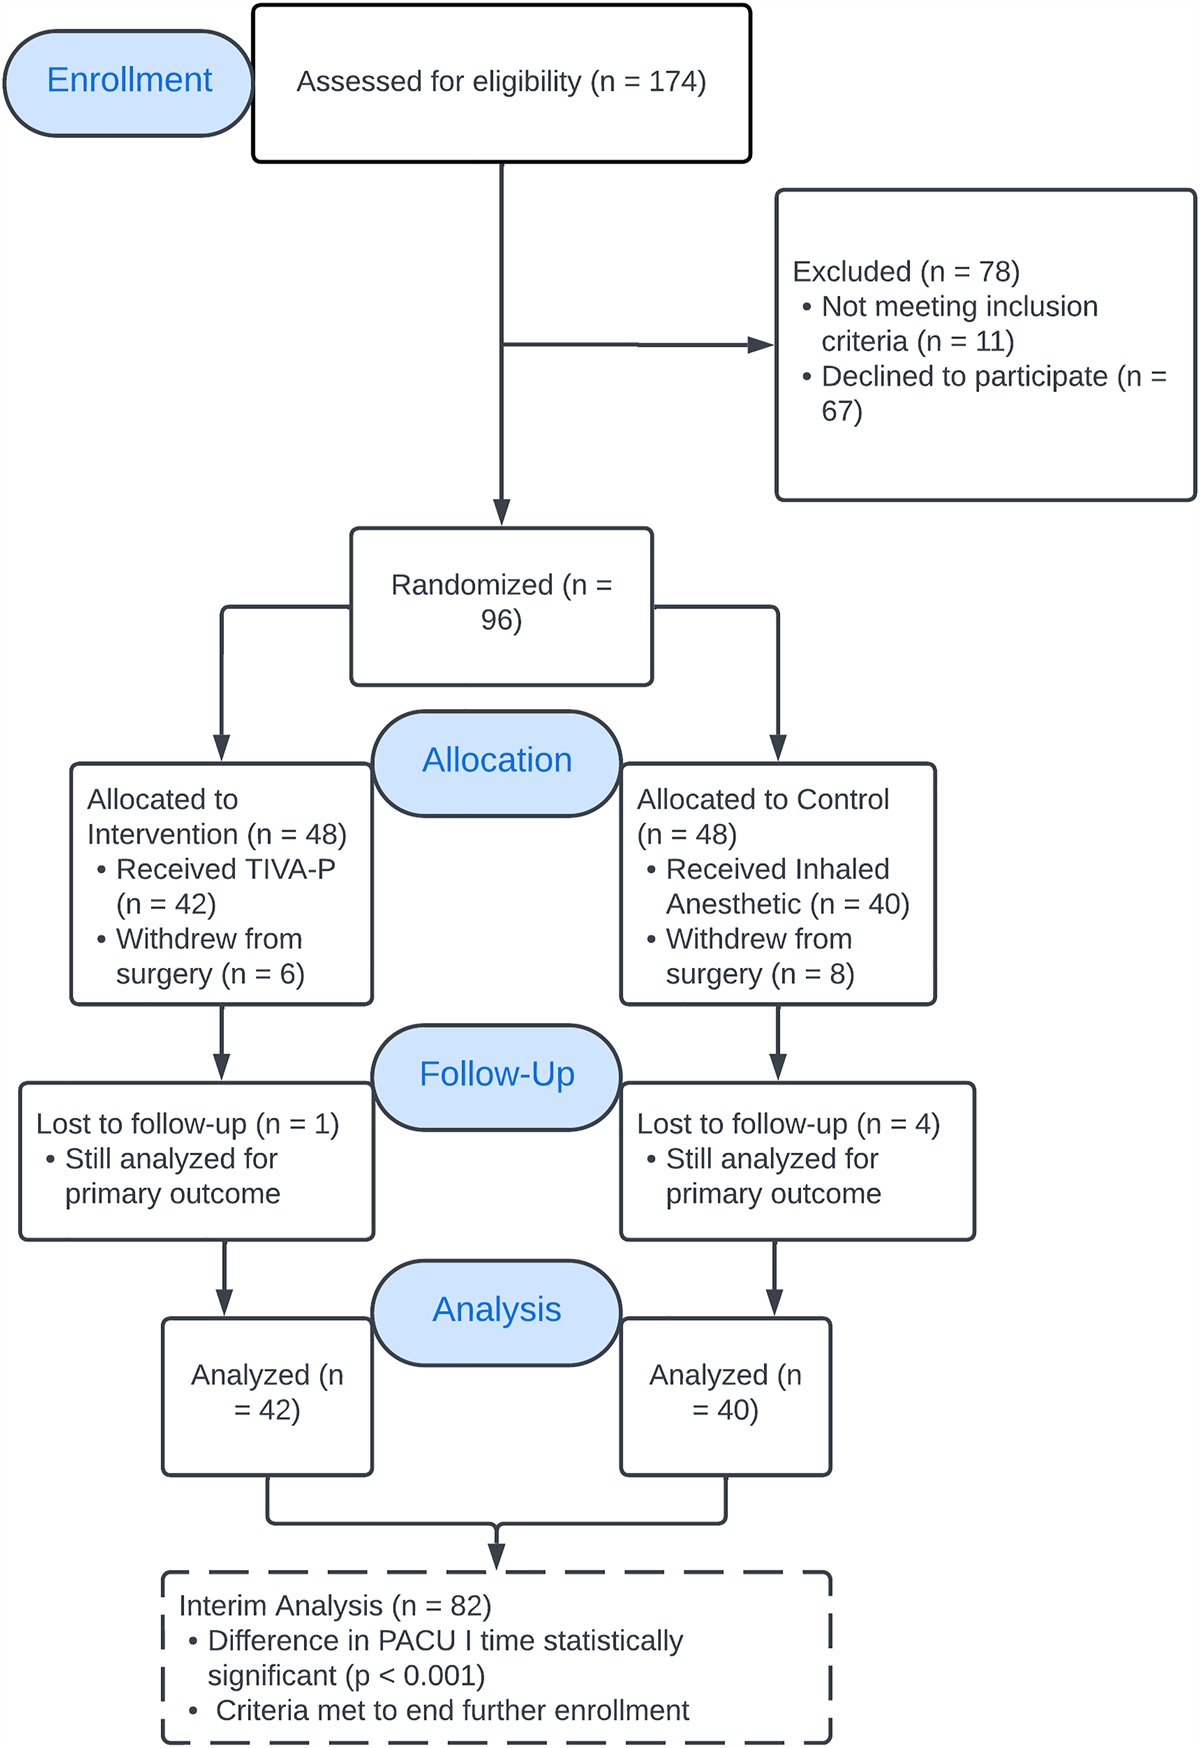
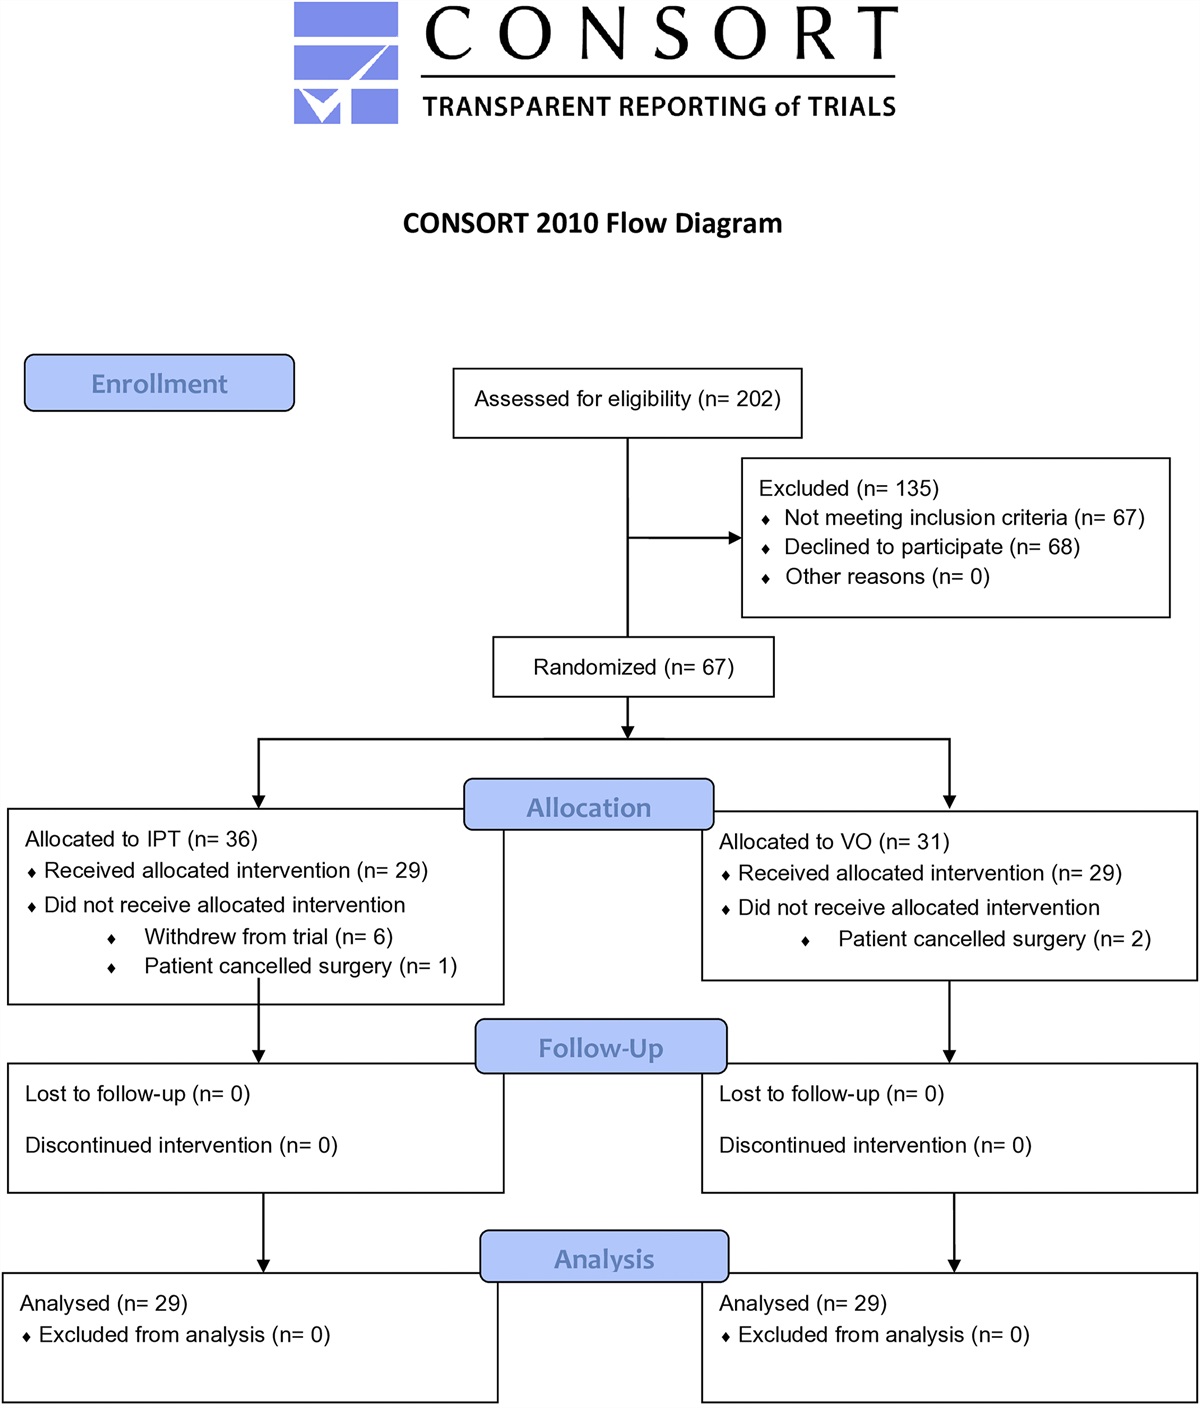
The CONSORT (Consolidated Standards of Reporting Trials) flow diagram is shown in Figure 1. Patients who underwent primary unilateral TKA were screened for eligibility. Patients who declined to give consent; had a history of chronic pain, insulin-dependent diabetes mellitus, or peptic ulcer disease; were chronic users of glucocorticoids, immunosuppressants, or immune-modulating agents, or of strong opioids such as morphine, fentanyl, hydromorphone, methadone, oxycodone, or meperidine; were a hepatitis B or C carrier; or had renal impairment (creatinine [Cr], >200 µmol/L) were excluded. The remaining patients were assigned to 1 of the 4 groups according to a computer-generated randomization sequence.
 Fig. 1:
 CONSORT diagram for the study.
All procedures were performed by the same surgical team using standardized surgical techniques involving a medial parapatellar surgical approach and a cemented posterior-stabilized prosthesis. Local infiltration analgesia (LIA) was administered by the surgeon using the technique described by Kerr and Kohan18. The standard regimen used in LIA was a mixture of 40 mL of 0.75% ropivacaine, 0.5 mL of 1:200,000 adrenaline, and 30 mg of ketorolac in 60 mL of 0.9% saline solution.
Patients in the P group received 4 mL of intravenous 0.9% saline solution and the standard LIA. Patients in the IVS group received 16 mg of intravenous dexamethasone (4 mL of a 4 mg/mL dexamethasone solution) and the standard LIA. Patients in the PAS group received 4 mL of intravenous 0.9% saline solution and the standard LIA plus 40 mg of triamcinolone (1 mL of a 40-mg/mL triamcinolone solution). Patients in the IVSPAS group received the standard LIA plus 1 mL of 40-mg/mL triamcinolone and 16 mg of intravenous dexamethasone. The patients and all outcome assessors were blinded to the group assignments.
The baseline range of movement, quadriceps power, and pain in the operatively treated knee on a numeric rating scale (NRS) were assessed by a physiotherapist 1 day before the surgery, and the blood glucose concentration was measured.
All operations were performed under spinal anesthesia using 2.4 mL of 0.5% hyperbaric bupivacaine. Patients were sedated with a target-controlled infusion of propofol; the target concentration was set to 0.3 to 1.0 mg/mL using the Marsh pharmacokinetic model19. Premedication was not administered.
Hemoglobin and glucose concentrations were measured at 1 and 2 hours after intravenous administration of the study drugs. NRS pain scores, both at rest and during maximal active knee flexion, were verbally reported by the patient and recorded by the nurses 4 times daily. Patient-controlled analgesia using morphine was administered for at least 3 days. A standardized multimodal analgesic regimen, consisting of 50 mg of pregabalin at night, 1 g of paracetamol 4 times daily, and 200 mg of celecoxib twice daily, was prescribed for 5 days.
The quality of recovery from surgery and anesthesia was measured on postoperative day 1 (POD1) using the Quality of Recovery (QoR) Questionnaire20. The glucose concentration was measured twice daily on POD1 and POD2. Perioperative complications, such as gastrointestinal bleeding, were assessed by the surgical team daily. Rehabilitation parameters were assessed by a physiotherapist who was also blinded to the group assignments. The knee range of movement and quadriceps power (assessed using the Medical Research Council scale for muscle strength) were assessed on the day of the operation and on the first 3 PODs. The Elderly Mobility Scale (EMS) score was measured on POD121. Walking distance was assessed on the first 3 PODs. Patients who fulfilled the discharge criteria, which included independent walking with or without walking aids, were discharged home around POD5, and the remaining patients were sent to the rehabilitation hospital. Wound and knee conditions were assessed daily during the inpatient stay and at 14 days, 6 weeks, and 3, 6, and 12 months postoperatively in the outpatient clinic for any clinical signs of surgical site infection (SSI), defined using the Centers for Disease Control and Prevention (CDC) guidelines, or periprosthetic joint infection (PJI), defined using the Musculoskeletal Infection Society criteria22,23.
The primary outcome measure was postoperative pain. A sample size calculation was performed on the basis of NRS pain scores after TKA in a local database, in which the mean pain score (and standard deviation) during maximal active flexion was 5.0 ± 2.8 on POD1. A sample size of 43 per group was found to be sufficient to detect a minimally clinically important difference (MCID) of 2.0 among the 4 treatment groups with 80% power at the 5% significance level. To account for potential dropouts, 45 patients were recruited per group. An adjustment for multiple comparisons was made in all pairwise comparisons to maintain a type-I error rate of <0.05.
Postoperative NRS pain scores were analyzed using the time-weighted average area under the pain-versus-time curve over the first 24, 48, and 72 hours postoperatively (AUCw). Comparisons of AUCw pain scores and parametric numeric variables across all 4 groups were performed using analysis of variance (ANOVA), and the Tukey test was used for post-hoc pairwise comparisons. Comparisons of nonparametric numeric variables across all 4 groups were performed using the Kruskal-Wallis test, and the Mann-Whitney U test was used for post-hoc pairwise comparisons. Comparisons of categorical variables across all 4 groups were performed using the chi-square test or Fisher exact test, and the same tests were used for the post-hoc comparisons. For the 6 post-hoc pairwise comparisons of nonparametric and categorical variables, the pairwise p values were multiplied by 6 to maintain the probability of false-positive outcomes at <0.05. All statistical analyses were performed using SPSS version 27 (IBM).
Source of FundingNo external funding was received for this study.
ResultsThe study was conducted between April 2018 and January 2022. A total of 194 patients were approached, 180 were recruited, and 178 were included in the data analysis (Table I). Six of the 194 patients were excluded because of changes in surgical technique; 4, because of hepatitis B infection; 2, because of a history of peptic ulcers; and 2, because they declined to participate. Of the 178 analyzed patients, 45 each were in the P and IVSPAS groups and 44 each were in the IVS and PAS groups; 1 patient in each of the latter groups had died. The severity of knee deformity in the coronal plane was defined by the mechanical tibiofemoral angle (MTA)24, with a positive value representing a varus deformity. Patients were followed at 6 weeks and 3, 6, and 12 months postoperatively for wound surveillance.
TABLE I - Demographics and Operative Data* Characteristic Group P (N = 45) Group IVS (N = 45) Group PAS (N = 45) Group IVSPAS (N = 45) Sex Male 12 (27%) 13 (29%) 12 (27%) 16 (36%) Female 33 (73%) 32 (71%) 33 (73%) 29 (64%) Age (yr) 78.7 ± 7.4 74.9 ± 9.0 74.3 ± 9.3 75.6 ± 7.8 Body weight (kg) 67.2 ± 13.3 68.8 ± 11.9 67.4 ±15.9 67.0 ± 12.7 Mechanical tibiofemoral angle (deg) 11.8 ± 7.1 9.5 ± 4.7 10.9 ± 5.9 11.5 ± 8.6 Side of TKA Right 24 (53%) 24 (53%) 14 (31%) 21 (47%) Left 21 (47%) 21 (47%) 31 (69%) 24 (53%) Duration of anesthesia (min) 123.6 ± 34.3 127.4 ± 32.4 128.4 ± 43.7 125.3 ± 32.3 Duration of surgery (min) 85.6 ± 22.3 94.8 ± 37.0 92.3 ± 40.8 90.7 ± 30.2 Intraoperative blood loss (mL) 100 [50-160] 100 [50-175] 100 [50-150] 65 [50-200] Tourniquet time (min) 42.2 ± 28.4 43.9 ± 31.3 47.0 ± 25.8 41.3 ± 23.4*The values are given as the count with the percentage in parentheses, the mean ± standard deviation, or the median with the interquartile range in brackets. P = placebo, IVS = intravenous corticosteroids, PAS = periarticular corticosteroids, IVSPAS = intravenous + periarticular corticosteroids.
Pain scores at rest differed significantly across the 4 groups during the first 24 and 48 hours postoperatively (p = 0.026 and p = 0.031, respectively). Compared with the P group, the pain scores were lower during the first 48 and 72 hours in the IVSPAS group (p = 0.034 and p = 0.043, respectively) and during the first 24 hours in the IVS group (p = 0.048) in the post-hoc comparisons (Tables II and III).
TABLE II - Postoperative NRS Pain Scores and Morphine Consumption* Outcome Group P (N = 45) Group IVS (N = 44) Group PAS (N = 44) Group IVSPAS (N = 45) P Value† Pain score at rest Preop. 2.2 ± 2.4 1.7 ± 2.3 2.2 ± 2.6 2.1 ± 2.5 0.760 0-24 hr postop. 2.1 ± 1.8 1.3 ± 1.2‡ 1.8 ± 1.7 1.3 ± 1.5 0.026 0-48 hr postop. 2.2 ± 1.6 1.5 ± 1.3 1.9 ± 1.7 1.3 ± 1.5‡ 0.031 0-72 hr postop. 2.2 ± 1.6 1.6 ± 1.2 1.6 ± 1.4 1.4 ± 1.6‡ 0.058 Pain score during maximal active knee flexion Preop. 6.3 ± 2.0 5.8 ± 2.5 5.8 ± 2.7 6.3 ± 2.0 0.531 0-24 hr postop. 5.0 ± 1.8 3.8 ± 1.7‡ 4.4 ± 1.8 3.9 ± 2.0‡ 0.007 0-48 hr postop. 5.6 ± 1.5 4.5 ± 1.6‡ 4.9 ± 1.7 4.3 ± 1.8‡ 0.001 0-72 hr postop. 5.8 ± 1.5 4.8 ± 1.6‡ 5.0 ± 1.5 4.3 ± 1.7‡ <0.001 Cumulative morphine consumption (mg) Through POD2 13 [7.5-19] 6.5 [3-13]‡ 7 [3.3-13]‡ 6 [2-10]‡ <0.001*The values are given as the mean ± standard deviation or the median with the interquartile range in brackets. Pain scores were calculated as the weighted mean area under the curve. P = placebo, IVS = intravenous corticosteroids, PAS = periarticular corticosteroids, IVSPAS = intravenous + periarticular corticosteroids, POD = postoperative day.
†Boldfaced values indicate a significant difference across the 4 study groups.
‡Significantly different from Group P in post-hoc testing.
*Adjusted p values were calculated by multiplying the pairwise p values by 6 to account for the number of post-hoc pairwise comparisons. Boldfaced values indicate a significant difference. P = placebo, IVS = intravenous corticosteroids, PAS = periarticular corticosteroids, IVSPAS = intravenous + periarticular corticosteroids, POD = postoperative day.
Pain scores during maximal active knee flexion differed significantly across the 4 groups during the first 24, 48, and 72 hours (p = 0.007, p = 0.001, and p < 0.001, respectively). Compared with P group, the pain scores were lower in the IVS and IVSPAS groups during the first 24, 48, and 72 hours (p ≤ 0.023 for all) (Tables II and III).
Cumulative morphine consumption over the first 2 PODs differed significantly across the 4 groups (p < 0.001). Patients in the IVS, PAS, and IVSPAS groups consumed significantly less morphine than those in the P group (p ≤ 0.032 for all) (Tables II and III). The QoR score differed significantly across the 4 groups (p < 0.001). Patients in the IVS and IVSPAS groups had significantly higher scores compared with those in the P group (p < 0.001 and p = 0.032, respectively) (Tables IV and V).
TABLE IV - Postoperative Physical and Hospitalization-Related Parameters* Outcome Group P (N = 45) Group IVS (N = 44) Group PAS (N = 44) Group IVSPAS (N = 45) P Value† Active knee flexion (deg) POD1 88.1 ± 12.2 91.1 ± 8.9 87.7 ± 15.5 90.3 ± 9.4 0.451 POD2 86.0 ± 11.5 89.8 ± 14.5 90.6 ± 10.7 91.1 ± 7.1 0.133 POD3 87.8 ± 9.8 89.5 ± 10.3 92.5 ± 10.9 93.6 ± 7.5‡ 0.020 Muscle power, 0-5 scale POD1 3 [3-4] 3 [3-4] 3 [3-4] 4 [3-4] 0.265 POD2 3 [3-3] 4 [3-4]‡ 3 [3-4] 4 [3-4]‡ 0.001 POD3 3 [2.5-3] 3 [3-4] 3 [3-4] 4 [3-4]‡ 0.012 Walking distance (m) POD1 19.4 ± 10.6 26.9 ± 13.7 26.6 ± 14.2 30.3 ± 15.7‡ 0.004 POD2 23.2 ± 13.5 32.3 ± 14.8‡ 33.9 ± 17.0‡ 34.2 ± 12.3‡ 0.001 POD3 24.8 ± 13.5 36.8 ± 16.7‡ 37.0 ± 16.3‡ 43.0 ± 15.7‡ <0.001 EMS, 0-10 scale POD1 4 [3-6] 4 [3-8.5] 5 [2-8] 6 [4-10]‡ 0.048 QoR, 0-18 scale POD1 14.1 ± 2.2 16.0 ± 2.2‡ 15.1 ± 2.2 15.4 ± 2.2‡ <0.001 Discharge destination 0.043 Home 17 (38%) 24 (55%) 26 (59%) 30 (67%)‡ Rehabilitation hospital 28 (62%) 20 (45%) 18 (41%) 15 (33%)*The values are given as the count with the percentage in parentheses, the mean ± standard deviation, or the median with the interquartile range in brackets. P = placebo, IVS = intravenous corticosteroids, PAS = periarticular corticosteroids, IVSPAS = intravenous + periarticular corticosteroids, POD = postoperative day, EMS = Elderly Mobility Scale, QoR = Quality of Recovery Questionnaire.
†Boldfaced values indicate a significant difference across the 4 study groups.
‡Significantly different from Group P in post-hoc testing.
*Adjusted p values were calculated by multiplying the pairwise p values by 6 to account for the number of post-hoc pairwise comparisons. Boldfaced values indicate a significant difference. P = placebo, IVS = intravenous corticosteroids, PAS = periarticular corticosteroids, IVSPAS = intravenous + periarticular corticosteroids, POD = postoperative day, EMS = Elderly Mobility Scale, QoR = Quality of Recovery Questionnaire.
Active knee flexion differed significantly across the 4 groups on POD3 (p = 0.020), with significantly better flexion in the IVSPAS group than in the P group (p = 0.027) (Tables IV and V). Quadriceps power differed significantly across the 4 groups on POD2 and POD3 (p = 0.001 and 0.012, respectively). Compared with the P group, quadriceps power was greater on POD2 and POD3 in the IVSPAS group (p = 0.005 and p = 0.007, respectively) and on POD2 in the IVS group (p = 0.003) (Tables IV and V).
The postoperative walking distance differed significantly across the 4 groups on the first 3 PODs (p = 0.004, p = 0.001, and p < 0.001, respectively). Compared with patients in the P group, those in the IVSPAS group walked significantly further on the first 3 PODs (p ≤ 0.003 for all) and those in the IVS and PAS groups walked significantly further on POD2 and POD3 (p ≤ 0.022 for all) (Tables IV and V). The EMS score differed significantly across the 4 groups (p = 0.048). Patients in the IVSPAS group had a higher EMS score than those in the P group (p = 0.036), suggesting better mobilization (Tables IV and V).
Compared with the P group, significantly greater glucose levels were found in the IVS and IVSPAS groups at 4, 8, 12, and 16 hours after intravenous administration of 16 mg of dexamethasone (p ≤ 0.003 for all). There were no significant differences beyond 16 hours (Fig. 2).
 Fig. 2:
 Mean blood glucose level and standard deviation over time in each group. An “a” indicates that the IVS group (intravenous corticosteroid) was significantly different from the P group (placebo). A “b” indicates that the IVSPAS group (intravenous + periarticular corticosteroid) was significantly different from the P group. A “c” indicates that the IVSPAS group was significantly different from the PAS group (periarticular corticosteroid).
A significantly higher percentage of patients were discharged home in the IVSPAS group than in the P group (p = 0.036) (Tables IV and V). No cases of gastrointestinal bleeding, SSI, or PJI were documented during the first 12 months of follow-up.
DiscussionThe present study is one of the first RCTs comparing IVS, PAS, and IVSPAS with a placebo control in TKA. The IVS and IVSPAS groups had similar pain relief. Compared with the P group (placebo), the IVSPAS group had significantly better rehabilitation parameters, including active range of knee flexion on POD3, muscle power on POD2 and POD3, walking distance on the first 3 PODs, and EMS and QoR scores on POD1. These improvements in rehabilitation and recovery parameters may have contributed to the higher percentage of patients who were discharged home in the IVSPAS group than in the P group, which has also been found in previous studies25–28. IVS was also demonstrated to be superior to placebo in reducing pain. PAS alone was not able to produce a significant reduction in pain, but it yielded a significant improvement in walking distance compared with placebo.
Previous studies have shown the importance of PAS in pain management after TKA2–12,29–32. However, the most recent meta-analysis showed that PAS did not provide pain relief and provided minimal improvement in range of knee movement33. This conclusion was based on the fact that the reduction in resting pain scores, assessed with a visual analog scale, after TKA was less than the minimal clinically important difference (MCID) of 0.9 point for patients undergoing TKA that was identified by Danoff et al. and Maredupaka et al.34,35. The present study also demonstrated that PAS yielded a nonsignificant reduction in pain scores compared with placebo.
The role of IVS in pain management after TKA has been confirmed in meta-analyses, which showed a significant reduction in postoperative pain and morphine consumption13–16. The present study also showed that IVS reduced postoperative pain scores and morphine consumption compared with placebo.
The next question is whether the intravenous or periarticular route of corticosteroid administration is better for pain control. To our knowledge, only 2 RCTs have compared both IVS and PAS with placebo36,37. Both studies showed that the pain relief provided by IVS and PAS was transient, only reaching significance at 24 hours postoperatively or within the first 24 hours. Furthermore, none of the differences in pain scores relativ
留言 (0)