
記住我


The best operative treatment for humeral shaft fractures remains subject to debate. The treatment options are intramedullary nailing (referred to throughout as nailing) and plate osteosynthesis (referred to throughout as plating), each with their advantages and disadvantages. Nailing is less invasive and may require less surgical time, but may be associated with rotator cuff symptoms. Plating allows anatomic reduction and fracture compression, but the more extensive surgical approach has a potential risk of radial nerve injury. Three meta-analyses reported ranges of pooled rates for both superficial and deep infections (1.6% to 2.3% after nailing compared with 1.7% to 7.7% after plating), secondary nerve palsy (2.5% to 6.4% after nailing compared with 2.9% to 6.9% after plating), and nonunion (3.6% to 9.2% after nailing compared with 1.1% to 8.6% after plating)1–3.
Although some studies showed no significant effect of treatment on functional shoulder scores4–6, both Li et al.7 and Yuan et al.8 showed higher Constant-Murley scores after plating than after nailing.
Because of heterogeneity in methodology, patient population, fracture type, and outcome measures across previous studies, it is undecided which treatment is more effective. Plating allows for anatomic reduction and fracture compression and avoids complications involving the rotator cuff, so we hypothesized that plating would result in earlier functional recovery and a lower complication risk compared with nailing. The aims of this study were to examine the effect of plating compared with that of nailing on functional recovery and complications in adults with a humeral shaft fracture.
Materials and Methods Setting and ParticipantsThis study used data from the operative treatment group of the HUMMER (HUMeral Shaft Fractures: Measuring Recovery after Operative versus Non-operative Treatment) study9. Twenty-eight hospitals that participated in this multicenter, parallel-group cohort study provided patients for the operatively treated group. The decision about surgical treatment was left to the discretion of the treating surgeon. All patients who were ≥18 years of age, had a humeral shaft fracture (OTA/AO type 12A or 12B, confirmed by radiography), and underwent a surgical procedure <14 days after hospital presentation were included after they provided written informed consent10. Patients with pre-trauma disability or additional trauma to the arm that could affect the outcome or with expected problems with maintaining follow-up were excluded. A full list of eligibility criteria is available in the published study protocol11. The local Medical Research Ethics Committee at each site exempted the study (no. MEC-2012-396).
Treatment Allocation and MaskingThe decision about which implant to use was left to the discretion of the treating surgeon. Participants and investigators were not blinded to the treatment. To reduce bias, follow-up measurements were standardized. Two assessors (I.B. and D.D.H.) independently evaluated the radiographs. Consensus was reached after discussion.
InterventionTreatment was provided on the basis of local protocols, and the surgical procedure was performed by certified, experienced, orthopaedic trauma surgeons. There were no study-specific requirements with regard to fracture reduction (open or closed), plating (open or minimally invasive), nailing (antegrade or retrograde), type and brand of the devices, and other elements of the surgical procedure, among others. With no evidence favoring a specific approach, the physical therapy and rehabilitation programs were also not standardized. Critical elements of treatment were recorded.
Assessments and Follow-upThe follow-up visits took place at 2 weeks (range, 7 to 21 days), 6 weeks (range, 4 to 8 weeks), 3 months (range, 11 to 15 weeks), 6 months (range, 6 to 7 months), and 12 months (range, 12 to 14 months) after the surgical procedure11. At each visit, clinical data were collected from the patients’ medical files. Also, shoulder and elbow ranges of motion were measured using a goniometer, and patients were asked to complete questionnaires on the level of pain, functional recovery, activity resumption, and health-related quality of life. The Constant-Murley score was determined at 6 weeks and subsequent visits. Anteroposterior and lateral radiographs of the humerus were made at presentation, after the operation, and at each study visit.
The Disabilities of the Arm, Shoulder and Hand (DASH) score served as the primary outcome measure12,13. The secondary outcome measures were the Constant-Murley score14, level of pain (on a visual analog scale [VAS]), analgesic drugs used, shoulder and elbow ranges of motion, time to resumption of work, resumption of activities of daily living (on a numeric rating scale [NRS]), health-related quality of life (Short Form-36 [SF-36] and EuroQol-5 Dimensions-3 Levels [EQ-5D-3L])15–17, the occurrence of complications and associated secondary interventions, and radiographic healing11. Nonunion was defined as a failure to heal at 6 months postoperatively with no progress toward healing seen on radiographs18. The patient-reported outcome measures have been proven to be reliable, valid, and responsive in the studied population and were available in Dutch19,20. The outcome measures are detailed in the published study protocol11.
Patient characteristics, injury-related details, and the number of physical therapy sessions were recorded11.
Statistical AnalysisThe HUMMER study was powered for detecting a 6-point difference in DASH score between the operatively treated group and the nonoperatively treated group, for which 95 patients per group were sufficient11. In order to allow for subgroup analysis and more advanced statistical modeling, a total of 400 patients were targeted. This analysis used only the operatively treated group.
Data were analyzed using the Statistical Package for the Social Sciences (SPSS) version 25 (IBM). All statistical tests were 2-sided, and analysis was by intention to treat. The HUMMER study is registered at the Netherlands Trial Register (NTR3617). Missing data were not imputed. Categorical data were analyzed using the chi-square test. Continuous data, which were all non-normally distributed according to the Shapiro-Wilk test, were analyzed using the Mann-Whitney U test. Significance was set at p < 0.05.
Continuous outcomes that were repeatedly measured over time were compared between treatment groups using linear mixed-effects regression models9. These multilevel models included fixed effects for the treatment group, age, sex, and fracture type and random effects for the intercepts of the model and time coefficient of individual patients. Explorative analyses showed that fracture location on the dominant side, smoking, radial nerve palsy at the time of the injury, and hospital were nonsignificant in all models; therefore, these covariates were not included in the final models. Finally, time was included as a factor because the outcome measures did not change linearly over time. The interaction between time and treatment group was included in the model in order to test for differences between the groups that varied over time. The estimated marginal mean with the 95% confidence interval (CI) at each follow-up time was computed for each treatment group. The means were compared post hoc using a Bonferroni correction for multiple testing. The absence of overlap of the 95% CIs around the marginal means was regarded as significant at p < 0.05.
Source of FundingThis study was supported by a grant from the Osteosynthesis and Trauma Care Foundation (number 2013-DHEL), which had no role in the conduct of the study.
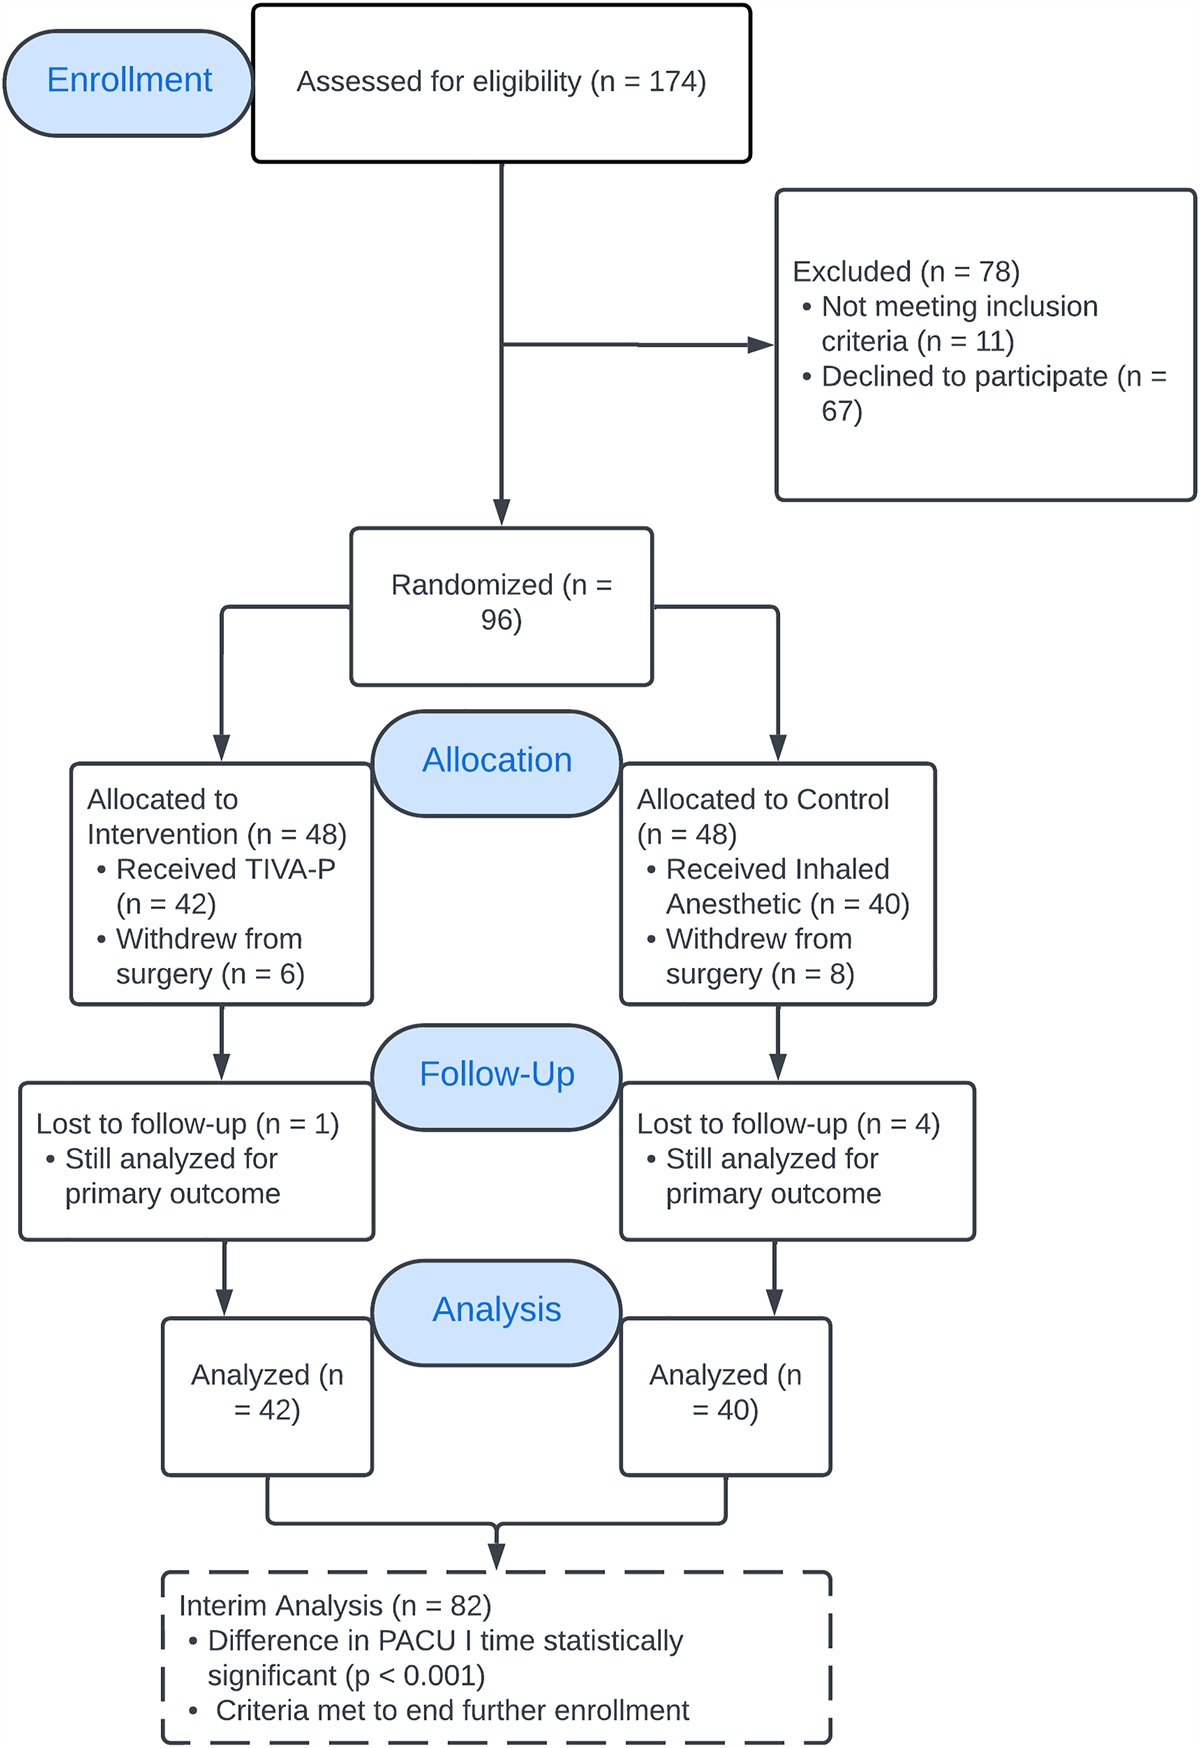
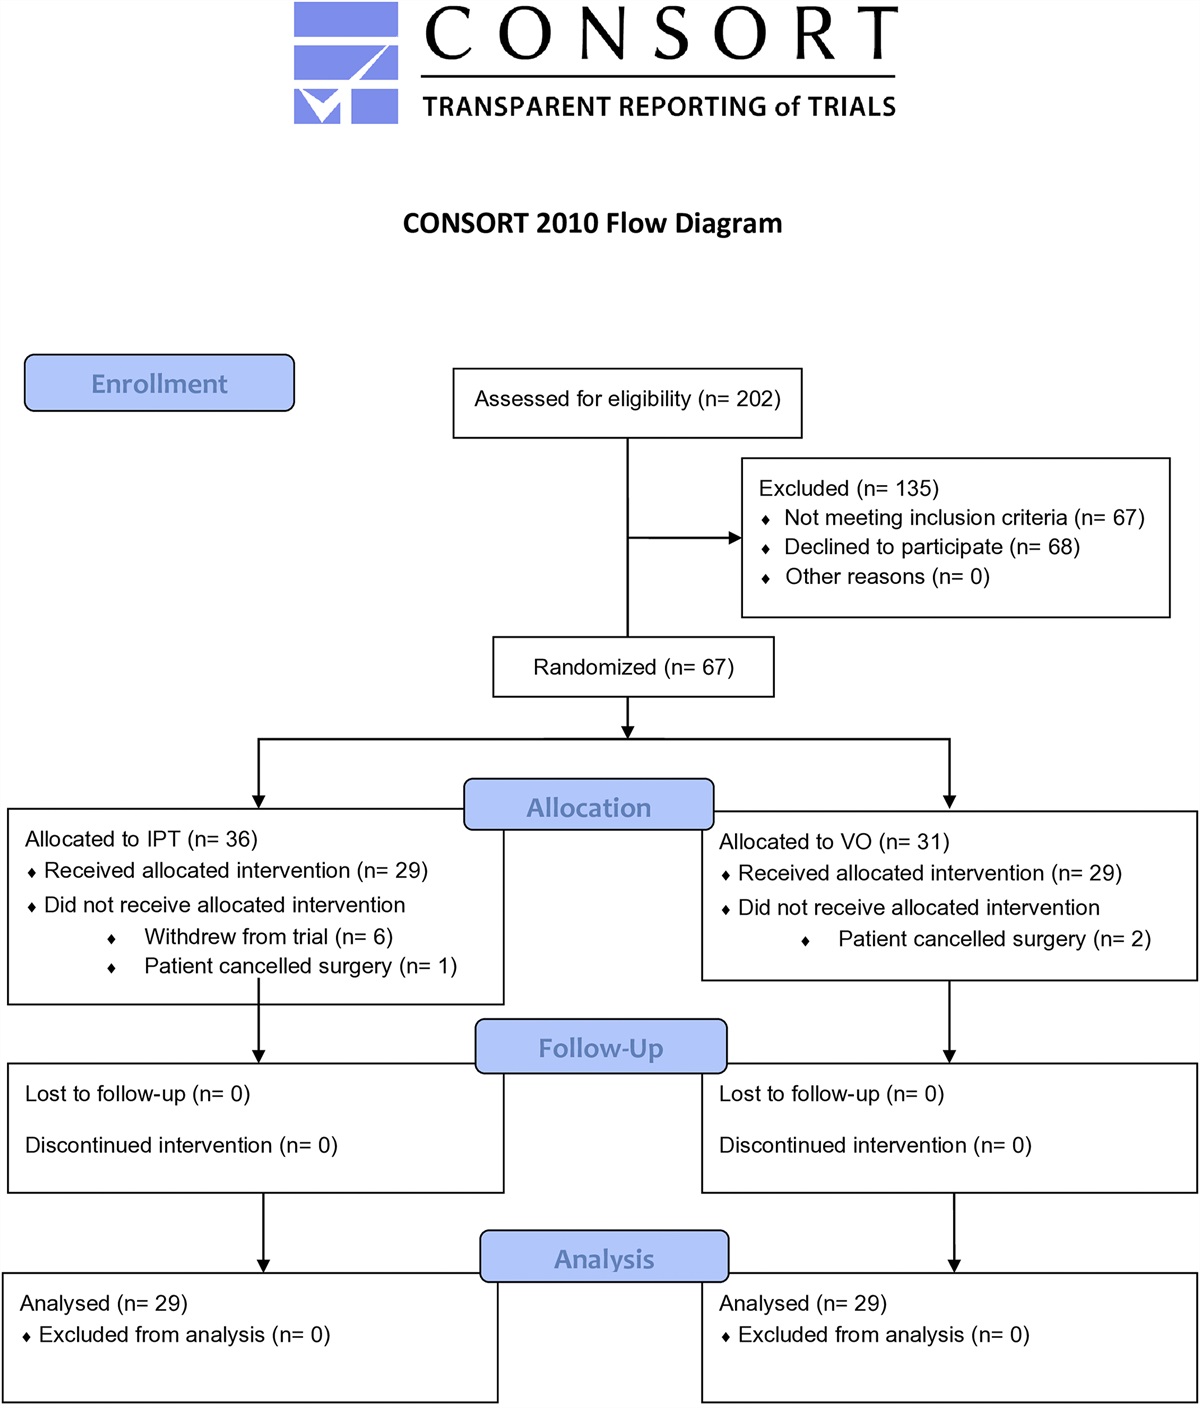
Results Patient and Injury CharacteristicsBetween October 23, 2012, and October 3, 2018, 245 patients of the HUMMER study underwent a surgical procedure: 76 patients (31.0%) underwent plating, and 169 patients (69.0%) underwent nailing (Fig. 1). Twelve patients were lost to follow-up due to mortality (n = 3) or withdrawal of consent.
 Fig. 1:
 Flowchart for the study. FU = follow-up.
The plating group had a younger median age at 43 years (P25 to P75, 25 to 61 years) than the nailing group at 57 years (P25 to P75, 40 to 68 years) (p < 0.001); the plating group also had a lower median body mass index (BMI) at 24.8 kg/m2 (P25 to P75, 22.5 to 28.3 kg/m2) than the nailing group at 26.3 kg/m2 (P25 to P75, 23.9 to 30.1 kg/m2) (p = 0.024) (Table I). Radial nerve palsy at presentation was more common after plating (10 patients [13.2%]) than after nailing (3 patients [1.8%]) (p = 0.001).
TABLE I - Patient, Injury, Treatment, and Admission Details of Study Participants by Treatment Group* All (N = 245) Plating Group (N = 76) Nailing Group (N = 169) P Value‡ Patients with Available Data Value† Patients with Available Data Value† Patients with Available Data Value† Patient characteristics Female sex 245 133 (54.3%) 76 38 (50.0%) 169 95 (56.2%) 0.407 Age (yr) 245 53 (35, 66) 76 43 (25, 61) 169 57 (40, 68) <0.001 BMI (kg/m 2 ) 244 26.1 (23.4, 29.9) 76 24.8 (22.5, 28.3) 168 26.3 (23.9, 30.1) 0.024 Smoking 245 55 (22.4%) 76 17 (22.4%) 169 38 (22.5%) 1.000 ASA class 3 or 4 245 13 (5.3%) 76 1 (1.3%) 169 12 (7.1%) 0.070 Comorbidities Any 245 115 (46.9%) 76 28 (36.8%) 169 87 (51.5%) 0.038 Diabetes 245 18 (7.3%) 76 4 (5.3%) 169 14 (8.3%) 0.597 Arthritis and/or arthrosis 245 15 (6.1%) 76 3 (3.9%) 169 12 (7.1%) 0.404 Osteoporosis or osteopenia 245 1 (0.4%) 76 0 (0.0%) 169 1 (0.6%) 1.000 Medication use 245 127 (51.8%) 76 32 (42.1%) 169 95 (56.2%) 0.053 No. of medications 128 2 (1, 4) 32 2 (1, 4) 96 3 (1, 5) 0.166 Injury characteristics Dominant side involved 245 116 (47.3%) 76 34 (44.7%) 169 82 (48.5%) 0.678 Fracture classification 245 76 169 0.334 A1 57 (23.3%) 20 (26.3%) 37 (21.9%) A2 43 (17.6%) 13 (17.1%) 30 (17.8%) A3 71 (29.0%) 16 (21.1%) 55 (32.5%) B1 51 (20.8%) 19 (25.0%) 32 (18.9%) B2 10 (4.1%) 2 (2.6%) 8 (4.7%) B3 13 (5.3%) 6 (7.9%) 7 (4.1%) Radial nerve palsy at presentation 245 13 (5.3%) 76 10 (13.2%) 169 3 (1.8%) 0.001 Additional injuries 245 26 (10.6%) 76 5 (6.6%) 169 21 (12.4%) 0.188 Ipsilateral arm 245 6 (2.4%) 76 1 (1.3%) 169 5 (3.0%) 0.669 Contralateral arm 245 4 (1.6%) 76 1 (1.3%) 169 3 (1.8%) 1.000 Admission and follow-up characteristics Surgical delay (day) 245 6 (2, 9) 76 6 (2, 9) 169 5 (2, 9) 0.499 Duration of surgery (min) 245 81 (65, 112) 76 113 (84, 134) 169 81 (57, 89) <0.001 Hospital length of stay (day) 245 2 (2, 4) 76 3 (2, 4) 169 2 (2, 4) 0.054 Discharge disposition Home 245 235 (95.9%) 76 76 (100.0%) 169 159 (94.1%) 0.196 Care hotel 6 (2.4%) 0 (0.0%) 6 (3.6%) Elderly care facility 1 (0.4%) 0 (0.0%) 1 (0.6%) Rehabilitation center 3 (1.2%) 0 (0.0%) 3 (1.8%) Other care facility admission 245 8 (3.3%) 76 0 (0.0%) 169 8 (4.7%) 0.061 Nursing home length of stay (day) 1 30 (30, 30) 0 NA 1 30 (30, 30) NA Care hotel length of stay (day) 4 8 (5, 25) 0 NA 4 8 (5, 25) NA Elderly care facility length of stay (day) 1 21 (21, 21) 0 NA 1 21 (21, 21) NA Rehabilitation center length of stay (days) 3 25 (24, 25) 0 NA 3 25 (24, 25) NA Physical therapy No. of sessions 217 25 (13, 48) 64 25 (8, 39) 153 26 (14, 51) 0.086*ASA = American Society of Anesthesiologists, and NA = not applicable. †The values are given as the number of patients, with the percentage in parentheses, or as the median, with the P25 to P75 in parentheses. ‡Bold represents significance.
A total of 121 surgeons operated on ≥1 patients: plating was performed by 47 surgeons and nailing was performed by 94 surgeons. All patients in the plating group were treated with a locking plate. The majority of patients in the nailing group (158 [93.5%]) were treated with an antegrade nail. Of the nails, 36 were an Expert Humeral Nail (DePuy Synthes); 44, a MultiLoc Humeral Nail (DePuy Synthes); 88, a T2 Humeral Nailing System (Stryker); and 1, a Titanic Elastic Nail (DePuy Synthes). The median duration of the surgical procedure was significantly longer (p < 0.001) after plating (113 minutes [P25 to P75, 84 to 134 minutes]) than after nailing (81 minutes [P25 to P75, 57 to 89 minutes]) (Table I). The other admission and follow-up characteristics, including the number of physical therapy sessions, were similar in both groups.
Patient-Reported Functional Outcome, Pain, and Activity ResumptionThe DASH score, Constant-Murley score, pain level, and ability to perform daily activities all improved over time in both treatment groups (Fig. 2, Table II; see also Appendix Supplemental Table S1). Table II provides the results of the multilevel model (i.e., the significance of treatment effects and estimated marginal means at 3 months, which was the time that a difference between the treatment groups was expected). Appendix Supplemental Table S1 shows the crude, unadjusted, values (median, P25 to P75, and univariate p value) and the adjusted values (i.e., estimated marginal means with 95% CIs) by follow-up time. The mean DASH score diminished from 48.9 points at 2 weeks to 11.7 points (95% CI, 7.6 to 15.7 points) at 12 months in the plating group and from 48.3 points at 2 weeks to 11.2 points (95% CI, 8.3 to 14.0 points) at 12 months in the nailing group (Fig. 2-A). Although treatment overall had no significant effect on the DASH score (p = 0.479), patients in the nailing group showed a faster functional recovery (p = 0.008) (Table II).
 Fig. 2:
 Figs. 2-A through 2-D Changes in functional outcome scores, pain, and activity resumption over time by treatment group. Higher scores represent more disability (DASH), better function (Constant-Murley), more pain (VAS), and a higher level of activity resumption (NRS). Data are shown as the estimated marginal mean with the corresponding 95% CI (shown as error bars), adjusted for age, sex, and fracture type, as calculated in the multivariable analysis. Blue lines represent the plating group; red lines represent the intramedullary nailing (IMN) group. Dashed lines represent the values of the contralateral side. *P < 0.05 (Bonferroni test). Fig. 2-A The DASH overall score. Fig. 2-B The Constant-Murley score of the affected arm. Fig. 2-C Pain (VAS) on the affected side. Fig. 2-D The extent to which patients resumed their activities at the pretrauma level (NRS) over time.
TABLE II - Treatment Effect Over Time and Outcome at the 3-Month Follow-up by Treatment Group* Effect†‡ Outcomes at the 3-Month Follow-up§ Treatment Interaction Plating Group (N = 76) Nailing Group (N = 169) F Value P Value F Value P Value Patient-reported outcome measures DASH score 0.50 0.479 3.45 0.008 21.9 (17.9 to 25.9) 23.0 (20.2 to 25.8) Constant-Murley score# 20.43 <0.001 4.88 0.002 61 (56 to 65)** 51 (48 to 54)** VAS pain score# 7.53 0.007 4.09 0.003 2.1 (1.5 to 2.7) 3.0 (2.6 to 3.4) Activity resumption 1.97 0.162 1.86 0.135 6.0 (5.3 to 6.7) 6.8 (6.3 to 7.3) Health-related quality of life SF-36 PCS 2.61 0.108 1.04 0.386 45 (43 to 47) 42 (41 to 44) SF-36 MCS 6.13 0.014 0.87 0.482 53 (51 to 56) 55 (53 to 57) EQ-5D US 1.97 0.162 2.17 0.071 0.79 (0.74 to 0.84) 0.76 (0.73 to 0.79) VAS pain 0.06 0.802 2.00 0.092 76 (72 to 80) 76 (73 to 78) Shoulder range of motion# (deg) Abduction 35.66 <0.001 7.89 <0.001 122 (114 to 131)** 97 (91 to 103)** Flexion 34.06 <0.001 7.68 <0.001 125 (117 to 134)** 104 (98 to 110)** External rotation 16.36 <0.001 8.18 <0.001 63 (58 to 69) 56 (52 to 59) Internal rotation 11.25 0.001 0.32 0.865 63 (58 to 68) 56 (53 to 60) Elbow range of motion# (deg) Flexion-extension arc 0.32 0.572 1.05 0.380 131 (125 to 136) 133 (129 to 137) Pronation-supination arc 0.14 0.712 1.73 0.141 165 (160 to 170) 166 (163 to 170)*MCS = Mental Component Summary, PCS = Physical Component Summary, and US = Utility Score. †Changes in the recovery pattern were assessed in the multilevel model. ‡Results are shown as the F-value for treatment and for the interaction term in the model (treatment × follow-up time) and their corresponding p value; significant p values are shown in bold. §Data of the outcomes at 3 months are shown as the estimated marginal mean, with the 95% CI in parentheses, after the 3-month follow-up adjusted for age, sex, and fracture type. #For the involved side. **The 95% CIs of the 2 treatment groups did not overlap (p < 0.05, per the Bonferroni test).
Similar to the DASH score, the Constant-Murley score showed a significant treatment effect in favor of the plating group (ptreatment < 0.001 and pinteraction = 0.002) (Fig. 2-B, Table II; see also Appendix Supplemental Table S1). Scores for the affected side increased from 52 points at 6 weeks to 76 points at 12 months in the plating group and from 38 points at 6 weeks to 70 points at 12 months in the nailing group. Significantly higher scores for the involved side were noted in the plating group at 6 weeks (52 compared with 38 points; p < 0.001) and 3 months (61 compared with 51 points; p < 0.001).
The plating group reported less pain (ptreatment = 0.007 and pinteraction = 0.003) (Fig. 2-C, Table II). The effect was most prominent at 6 weeks (2.2 after plating compared with 3.7 after nailing).
Treatment had no significant effect on activity resumption (ptreatment = 0.162 and pinteraction = 0.135) (Fig. 2-D, Table II). The resumption of work and sports activities was unaffected by treatment (see Appendix Supplemental Table S2). Treatment also had no significant effect on the health-related quality of life, except for the SF-36 Mental Component Summary (MCS) (ptreatment = 0.014 and pinteraction = 0.482) (Fig. 3, Table II; see also Appendix Supplemental Table S1).
 Fig. 3:
 Figs. 3-A through 3-D Changes in health-related quality of life over time by treatment group. Higher scores represent better quality of life. Data are shown as the estimated marginal mean with the corresponding 95% CI (shown as error bars), adjusted for age, sex, and fracture type, as calculated in the multivariable analysis. Blue lines represent the plating group; red lines represent the intramedullary nailing (IMN) group. Fig. 3-A SF-36 Physical Component Summary (PCS); the dashed lines represent the mean and the standard deviation (50 ± 10) that were used for normalizing the data. Fig. 3-B SF-36 Mental Component Summary (MCS); the dashed lines represent the mean and the standard deviation (50 ± 10) that were used for normalizing the data. Fig. 3-C EQ-5D utility score (EQ-US). Fig. 3-D EQ-VAS over time.
Shoulder and Elbow Ranges of MotionChanges in range of motion are shown in Figure 4, Table II, and Appendix Supplemental Table S1. Shoulder range of motion showed a significant treatment effect in favor o
留言 (0)