Cell culture
The RAW264.7 cells were incubated in a complete medium consisting of DMEM medium containing 10% fetal bovine serum, as well as 100 U/mL penicillin and 100 mg/mL streptomycin. This incubation took place in a 5% CO2 incubator at a temperature of 37 °C.
Preparation of conditioned medium
In this study, we weighed ES-PMMA and PMMA bone cement samples and then immersed them in the DMEM. Each gram of bone cement was added to 5 mL DMEM at 37 °C for 72 h. Afterward, we collected the immersion solution and centrifuged it at 5000 rpm for 10 min. We then collected the supernatant and filtered it through a 0.22 μm filter to obtain the bone cement extract with a concentration of 200 mg/mL. In order to create different concentrations of extract, the original extract was diluted with a complete medium resulting in four different concentrations: 25 mg/mL, 50 mg/mL, 75 mg/mL, and 100 mg/mL. Similarly, 4000 axAIU ES was fully dissolved in 1 ml of DMEM and then diluted with a complete medium to generate four different concentrations of ES: 100AxaIU/mL, 200AxaIU/mL, 300AxaIU/mL, and 400 AxaIU/mL.
Cell proliferation activity
Cell Counting Kit8 (CCK8) was used to determine the cell proliferation [18, 19]. RAW264.7 cells were seeded into 96-well plates at a density of 5 × 10³ cells per well and incubated at 37 °C with 5% CO2 for around 24 h. The cells were then divided into three groups: blank, control, and experimental groups (ES, PMMA, and ES-PMMA). The RAW264.7 cells in the experimental groups were cultured with their corresponding conditioned medium. In the control group, RAW264.7 cells were cultured with a complete medium, while the blank group contained only the complete medium without cells. After 24 h, the CCK8 reagent was added and incubated for an additional 4 h. The absorbance at 450 nm was then measured on a microplate reader for each group, which was repeated three times. The relative cell viability was calculated using the following formula:
$$\begin }\;(\%) & = \left( }_}}} - }_}}} } \right) \\ & \quad /\left( }_}}} - }_}}} } \right) \times 100\% . \\ \end$$
Cell treatment
The RAW264.7 cells were cultured in a complete medium at 37℃ and 5% CO2 for 24 h. Afterwards, they were incubated with 500 ng/mL LPS for an additional 24 h. The cells were then divided into five groups: the NC group (cells without LPS treatment), the LPS group, the LPS + ES group, the LPS + PMMA group, and the LPS + ES-PMMA group. After 24 h, the NC and LPS groups were switched to complete medium and cultured for an additional 24 h. Meanwhile, the LPS + ES, LPS + PMMA, and LPS + ES-PMMA groups were cultured with their respective conditioned medium for another 24 h.
RT-qPCR
RT-qPCR was used to detect the expression of inflammatory factors in each group [20, 21]. Cells were collected, total RNA was extracted from cells using TRIzol reagent, and cDNA was synthesized by operating according to the reverse transcription kit instructions (SureScript First-Strand cDNA Synthesis Kit). RT-qPCR experiments were performed using cDNA as a template to detect the expression levels of TNF-α, IL-6, iNOS, IL-10, and Arg-1. 2 × SYBR Green qPCR MasterMix was used for RT–qPCR on a Bio-Rad iQ5 Real-Time PCR instrument, and GAPDH was used as the reference gene. The reaction conditions were set as follows: 1 cycle at 95 °C for 10 min; 40 cycles at 95 °C for 15 s, 55 °C for 30 s, and 72 °C for 30 s. All RT-qPCR samples were repeated three times, the average cycle threshold (CT) value was taken, and the relative mRNA expression levels of the above genes in each group were calculated by the 2-ΔΔCT method. The primer sequences were designed and synthesized by Wuhan Jinkaruo Biological Engineering Co., Ltd. The specific primer sequences are shown in Table 1.
Table 1 The sequences of the primersFlow cytometry
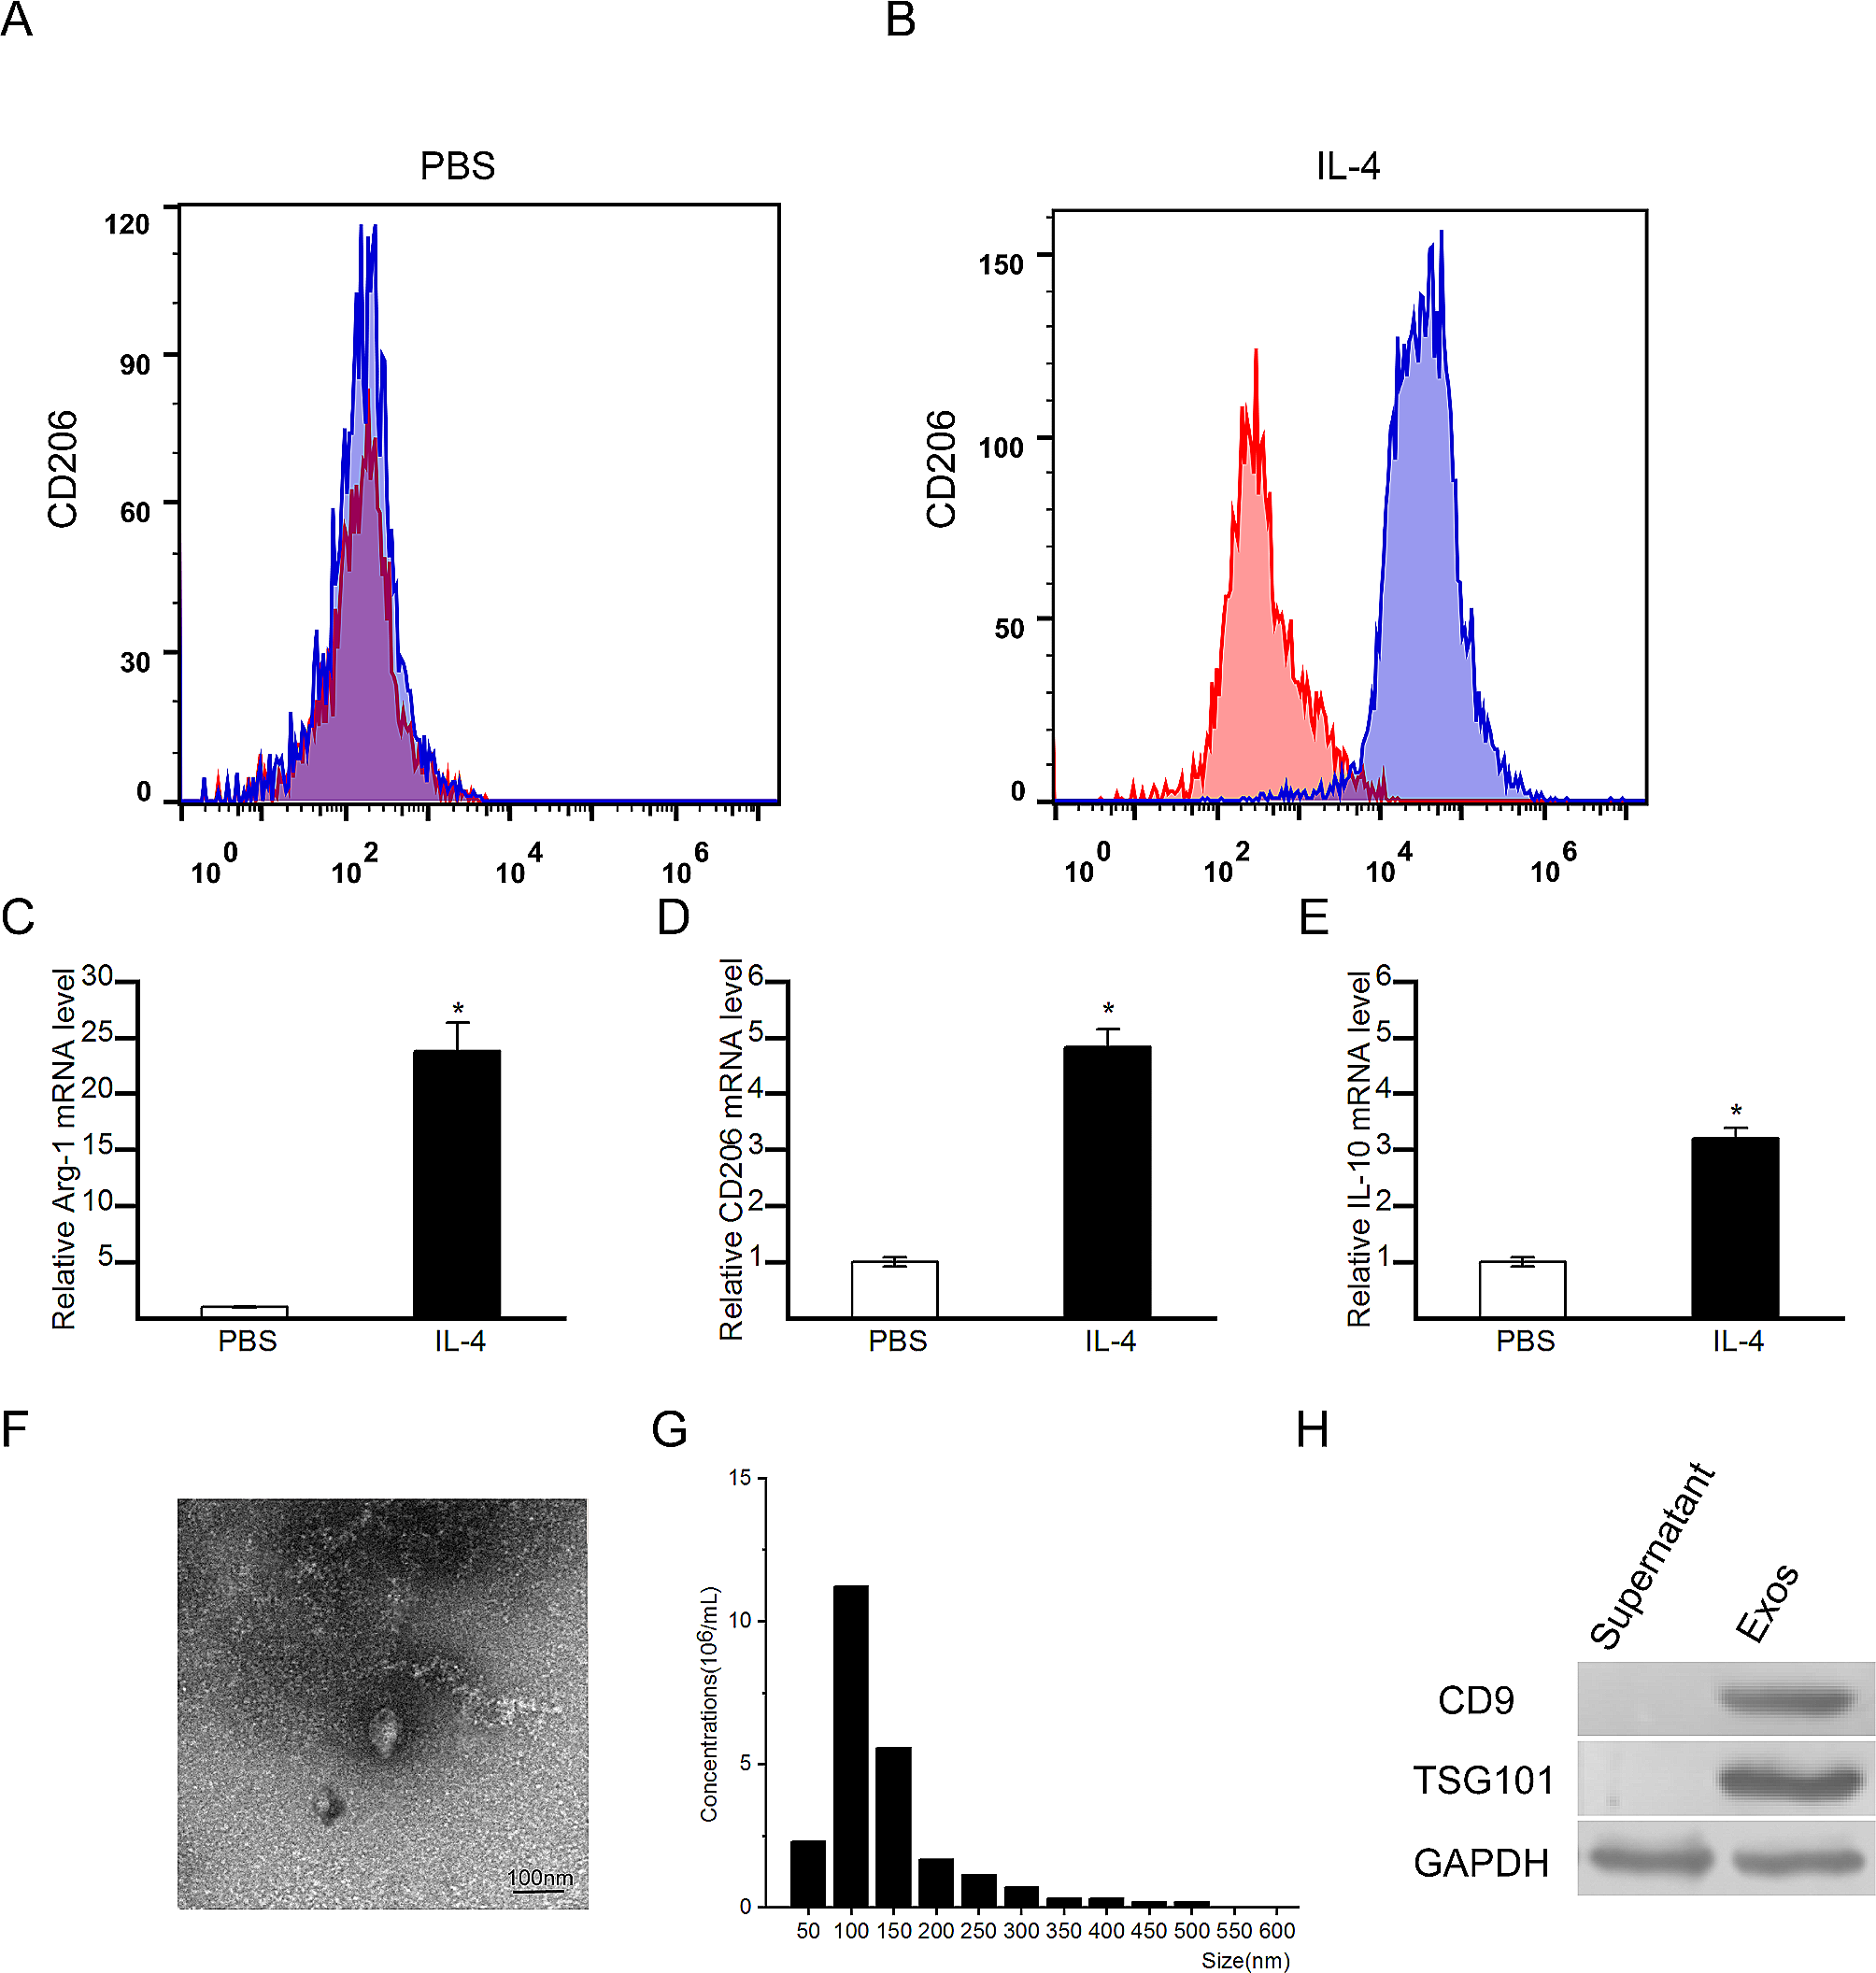
Flow cytometry was used to detect the expression of CD86 and CD206 in each group [22, 23]. The cells were collected, packaged at 1 × 10⁶ cells/tube, and centrifuged at 1000 rpm for 5 min. PBS was added and resuspended, centrifuged at 1000 rpm for 5 min, and repeated twice. FITC CD86, FITC CD206, and isotype control antibodies were added to each EP tube and incubated in a dark place at 4 ℃ for 30 min. After centrifugation at 1000 rpm for 5 min, the supernatant was discarded, resuspended in PBS, centrifuged at 1000 rpm for 5 min, and repeated twice to remove the unbound antibody. Flow cytometric data were acquired using a BD FACSCalibur, and data were analyzed with FlowJo software.
Western blot
Western blotting was used to detect the expression of TLR4/NF-κB signaling pathway-related proteins in each group [14, 20]. The cells were collected, lysed on ice for 30 min after washing with PBS, and centrifuged at 12 000 rpm for 15 min at 4 °C. After the determination of protein concentration by the BCA method, the appropriate amount of loading buffer was added to the protein samples and separated by electrophoresis on SDS polyacrylamide gel. Then the proteins on the gel were transferred to the PVDF membrane and blocked with 5% skim milk powder at room temperature for 2 h. Primary Anti-TLR4 antibody, Anti-p-NF-κB p65 antibody, and Anti-NF-κB p65 antibody (1: 1000) were added at 4 ℃ overnight, respectively. After washing the membrane, the corresponding secondary antibodies were added and incubated at room temperature for 2 h. After washing the film again and reacting with the luminescent reagent, the film was immediately placed in the exposure box, and the photosensitive film was exposed in a dark room for 1 min, and then developed and fixed. The films were scanned and imaged with an Epson Perfection V39 scanner. The gray value of the developed protein bands was measured by ImageJ software, and the relative protein expression was calculated using GAPDH as an internal reference.
Statistical analysis
Statistical analysis was performed using GraphPad Prism 9. All experimental data were expressed as mean ± standard deviation (mean ± SD). Comparisons between two groups were formulated by t-test, whereas comparisons among multiple groups were assessed by one-way analysis of variance followed by Tukey’s multiple comparisons test. P < 0.05 means that the difference was statistically significant.


留言 (0)