
記住我
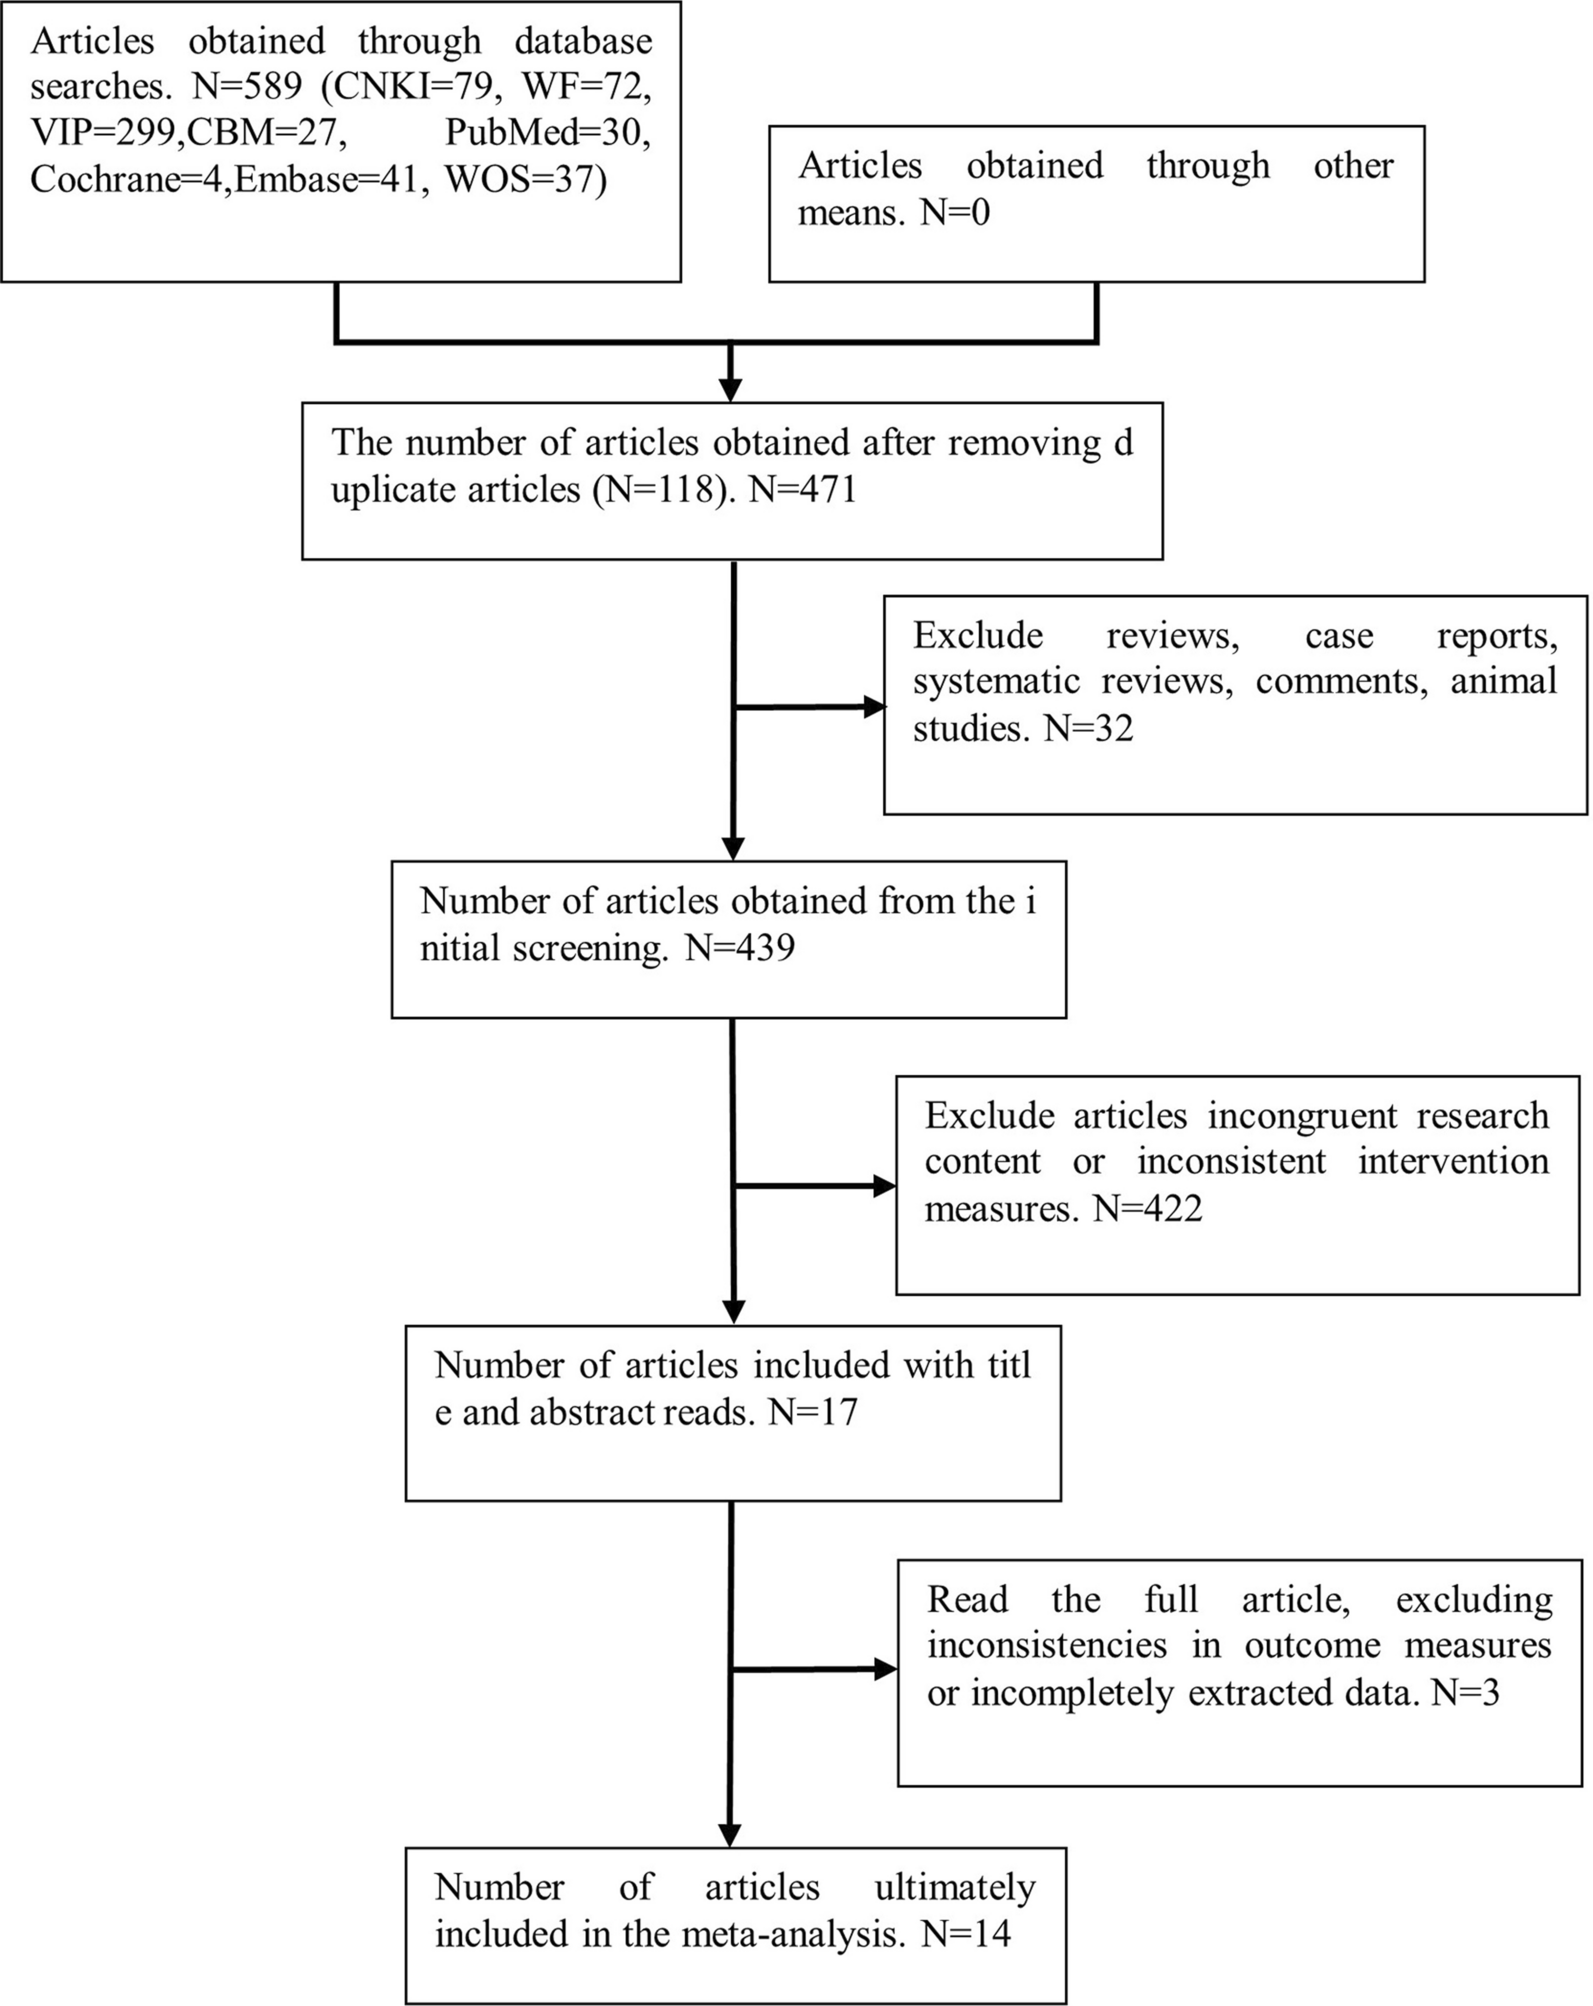


A diagram showing how to search databases and identify studies is shown in Fig. 1. By searching the database, 472 articles were obtained, and 366 were identified after excluding duplicates. Based on title and abstract, 347 of them were subsequently excluded, mainly because their objectives were irrelevant. Ten articles were further excluded from full-text review for the reasons illustrated in Fig. 1. The final analysis included nine RCTs [11,12,13,14,15,16,17,18,19] in total.
Fig. 1
Flowchart of literature search
Study characteristics and data qualityAn overview of the included studies is presented in Table 1. Overall, nine RCTs [11,12,13,14,15,16,17,18,19] including 2070 patients with OA contributed to the meta-analysis. These studies were all double-blind RCTs from the UK [14], China [11], France [12], Germany [15], Japan [16], New Zealand [17], the USA [19], and Australia [13, 18], which were published between 1992 and 2022. As for the diagnosis, three studies included patients with knee OA [13, 16, 19], four with hip or knee OA [11, 12, 15, 17], and the other two did not specify the sites of OA [14, 18]. The mean ages of the patients were 55 to 68 years, and the percentiles of men were 12–45%. A total of 1020 patients were allocated to the intervention group, who received a daily supplementation of n-3 PUFA of 350–2400 mg, and a total of 1050 patients were allocated to the control group of placebo or no additional treatment. The follow-up durations were 1 to 63 months. The arthritis pain was evaluated via visual analogue scale (VAS) in four studies [11, 14, 16, 18], and via Western Ontario-McMaster University Osteoarthritis Index (WOMAC) in five studies [12, 13, 15, 17, 19]. The joint function was evaluated via WOMAC in five studies [12, 13, 15, 17, 19], and with VAS [14], the Patients’ Global Assessment [11], and the Japanese Orthopaedic Association score [16] in the other three studies. Details of quality evaluation via the Cochrane Risk of Bias Tool for each included study are summarized in Fig. 2. All of the included studies were double-blind RCTs. Details of random sequence generation were reported in four studies [13, 15, 17, 19], and details of allocation concealment were also reported in four studies [13, 16, 17, 19]. No other publication biases such are those related to incomplete outcome data, selective reporting, or of other sources were detected.
Table 1 Characteristics of the included studiesFig. 2
Summarized details of study quality evaluation via the Cochrane Risk of Bias Tool
Meta-analysis of n-3 PUFA supplementation on arthritis pain in patients with OAMeta-analysis with nine studies evaluated the influences of n-3 PUFA supplementation on arthritis pain in patients with OA [11,12,13,14,15,16,17,18,19]. Significant heterogeneity was observed among these studies (p for Cochrane Q test = 0.01, I2 = 60%). Pooled results showed that n-3 PUFAs supplementation could significantly relieve the arthritis pain as compared to placebo (SMD: − 0.29, 95% CI − 0.47 to − 0.11, p = 0.002; Fig. 2A). Results of univariate meta-regression analysis failed to show the following variables may significantly contribute to the heterogeneity, including patient number, mean age, percentile of men, dose of n-3 PUFA, EPA, or DHA, and the follow-up duration (Table 2, p all > 0.05). Sensitivity analysis by excluding one study at a time showed consistent results (− 0.22 to − 0.34, p all < 0.05). Subgroup analysis showed that the improvement of pain after n-3 PUFA supplementation was consistent in studies with the symptom evaluated by WOMAC or VAS, in studies with n-3 PUFA supplementation < 1000 mg/d or ≥ 1000 mg/d, with EPA < 500 mg/d or ≥ 500 mg/d, with DHA < 500 mg/d or ≥ 500 mg/d, or with follow-up duration < 6 or ≥ 6 months (p for subgroup difference all > 0.05; Table 3). Interestingly, a more remarkable improvement in arthritis pain was observed in younger patients (< 65 years) than it in older patients (≥ 65 years, p for subgroup difference = 0.03; Table 3).
Table 2 Univariate meta-regression analysis for the effects of n-3 PUFA on joint pain in patients with OATable 3 Subgroup analysisMeta-analysis of n-3 PUFA supplementation on joint function in patients with OAPooled results of eight studies [11,12,13,14,15,16,17, 19] showed a significant improved joint function following n-3 PUFA supplementation in patients with OA (SMD: − 0.21, 95% CI: − 0.34 to − 0.07, p = 0.002; Fig. 2B) with mild heterogeneity (p for Cochrane Q test = 0.21, I2 = 27%). Sensitivity analysis by omitting one study at a time did not significantly affect the results (− 0.22 to − 0.34, p all < 0.05). In addition, subgroup analysis showed consistent results of studies with joint function evaluated by WOMAC or other scales (p for subgroup difference = 0.34, Table 3). Moreover, further subgroup analysis according to the mean age of the patients, daily dose of n-3 PUFA, EPA, and DHA, as well as the follow-up durations also showed consistent results (p for subgroup difference all > 0.05; Table 3).
Safety outcomeNo severe AEs related to the treatment n-3 PUFA were reported among the included studies. Pooled results with seven studies [11,12,13,14,15, 17, 18] showed that the incidence of treatment-related AEs was not significantly different between groups (OR: 0.97, 95% CI 0.64–1.45, p = 0.86, I2 = 0%; Fig. 2C).
Publication biasThe funnel plots for the meta-analyses of the influences of n-3 PUFA supplementation on arthritis pain, joint function, and the incidence of AEs are shown in Fig. 3A, B, C. These plots were symmetrical on visual inspection, reflecting low risks of publication biases. In addition, results of Egger’s regression tests also confirmed the low risks of publication biases (p = 0.26, 0.31, and 0.19, respectively) (Fig. 4).
Fig. 3
Forest plots for the meta-analysis of the efficacy and safety of n-3 PUFA supplementation in patients with OA; A, Forest plots for the meta-analysis of arthritis pain; B, Forest plots for the meta-analysis of joint function; and C, Forest plots for the meta-analysis of the incidence of treatment related AEs
Fig. 4
Funnel plots for the detection of the publication biases underlying the meta-analysis; A, Funnel plots for the meta-analysis of arthritis pain; B, Funnel plots for the meta-analysis of joint function; and C, Funnel plots for the meta-analysis of the incidence of treatment related AEs
留言 (0)