
記住我

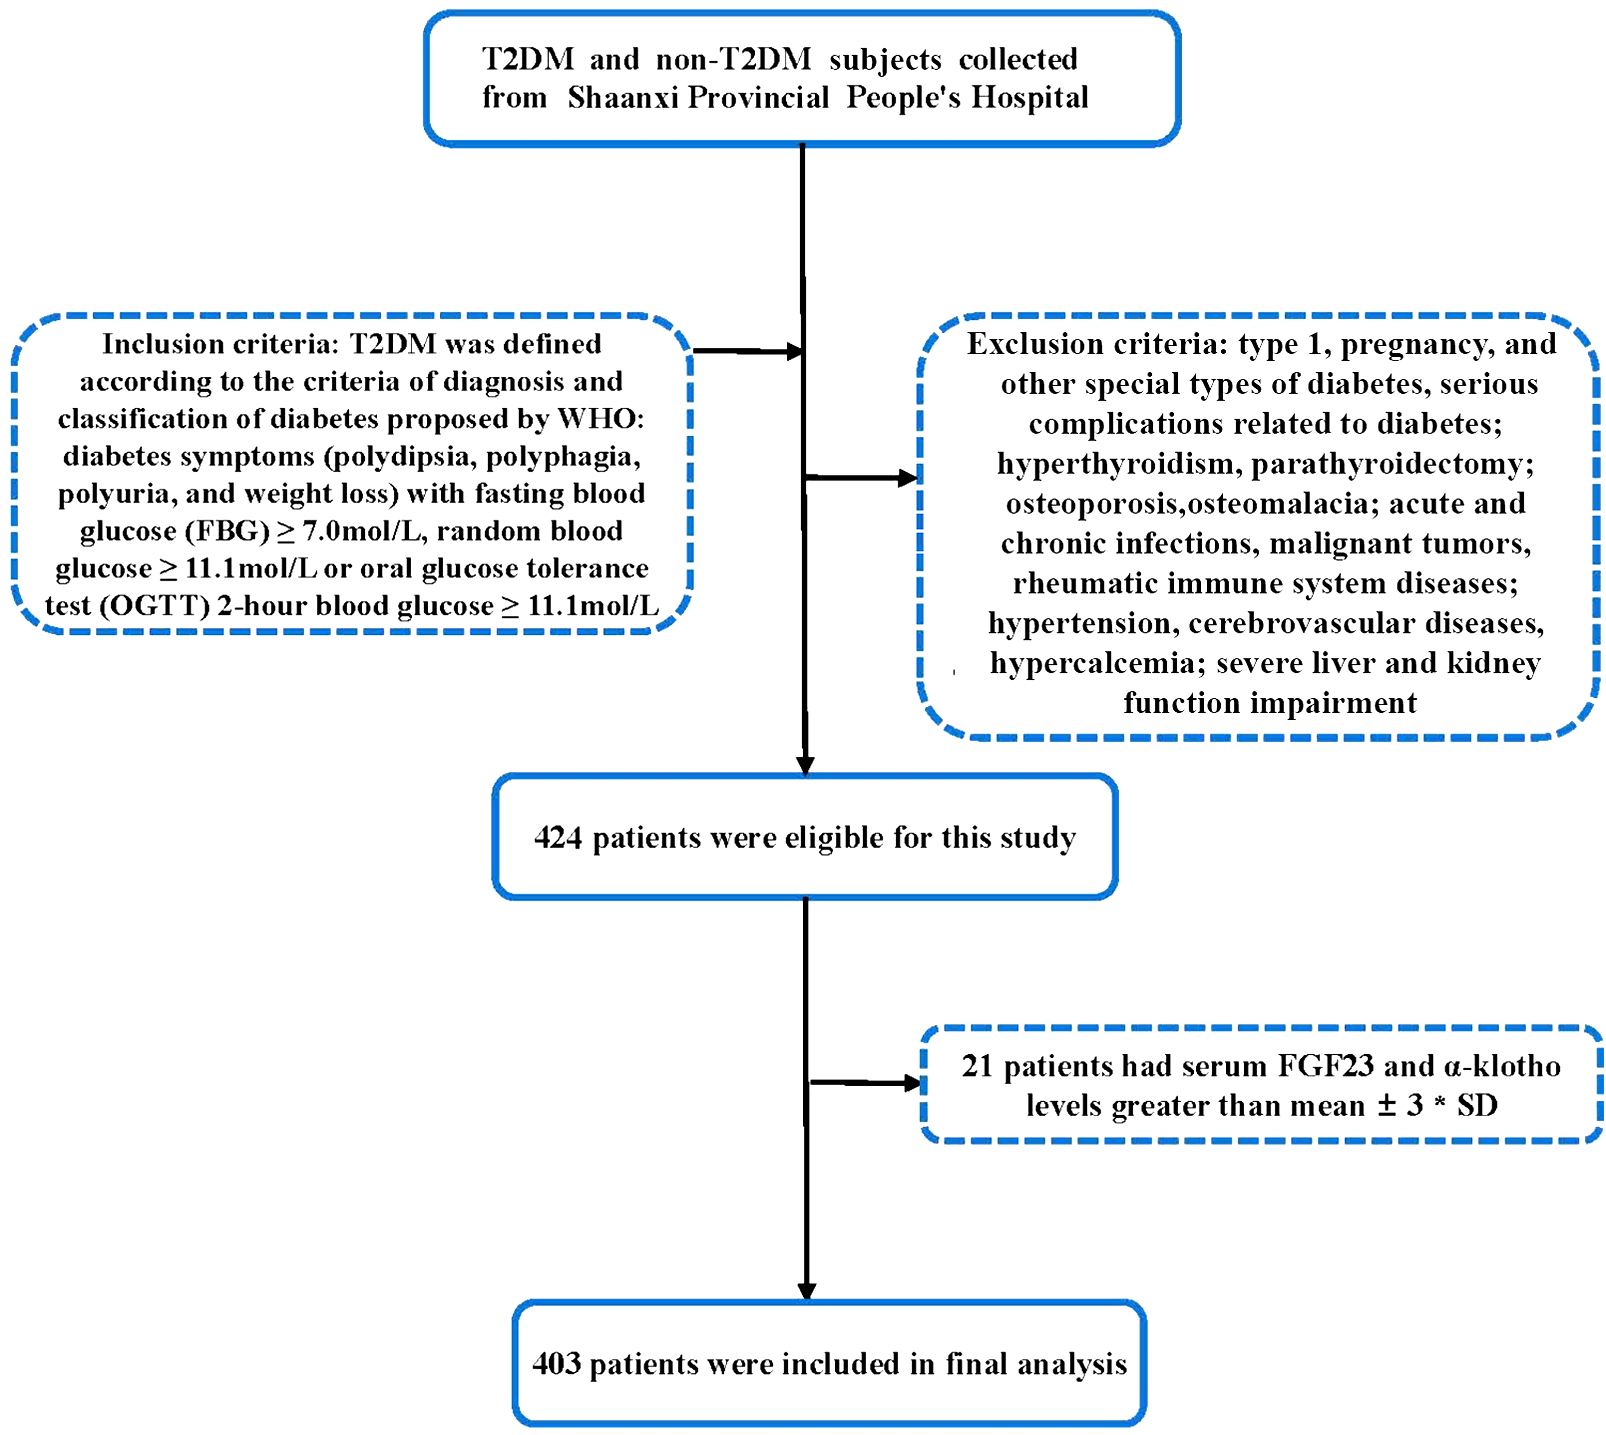
Initially, 85 patients were in evolocumab group and 372 patients were in control group (details in Additional file 1: Table S1). PSM was performed to balance potential confounders between two groups. Finally, a total of 170 patients (mean age 64 ± 10.6 [range 40–85] years; 131 men) were included (details in Fig. 1). Among those patients, 85 were in evolocumab group and 85 were in control group, respectively. There were no significant differences in clinical characteristics between the two groups at baseline (p > 0.05 for all, details in Table 1). The details of the pretest and posttest medication use are provided in Tables 1 and 2.
Fig. 1
Flow chart of inclusion and exclusion. CCTA, coronary computed tomography angiography; LDL-C, low-density lipoprotein cholesterol; T2DM, type 2 diabetes mellitus
Table 1 Clinical characteristicsTable 2 Laboratory findings and medication in use in evolocumab group and control groupBaseline and follow-up laboratory findingsTable 2 shows the laboratory findings between groups. There were no significant differences between groups at baseline. After 48-week treatment, TC (3.32 [2.18, 4.37] vs. 4.56 [2.78, 6.89], p < 0.001), LDL-C (2.02 [1.26, 2.78] vs. 3.34 [2.53, 4.14], p < 0.001), TG (1.38 [1.13, 1.58] vs. 1.56 [1.23, 2.11], p = 0.005) and Lp(a) (12.1 [5.6, 21.8] vs. 18.9 [13.2, 27.2], p = 0.002) were significantly decreased in evolocumab group. However, in this group, there were no significant difference between the baseline and follow-up with regards to HDL-C, HbA1c and CRP (p > 0.05 for all). In the control group, no significant difference were observed with respect to TC, HDL-C, LDL-C, TG, Lp(a), HbA1c and CRP (p > 0.05 for all).
After 48-weeks, the evolocumab group showed lower TC (3.32 [2.18, 4.37] vs. 3.81 [2.62, 5.89], p = 0.016), LDL-C (2.02 [1.26, 2.78] vs. 3.18 [2.63, 3.79], p < 0.001) and Lp(a) (12.1 [5.6, 21.8] vs. 18.9 [9.5, 28.2], p = 0.001) than the control group.
Baseline and follow-up CCTA parametersChanges in lesion characteristics between the baseline and follow-up findings are displayed in Table 3. At baseline, no significant difference were observed between groups. In the evolocumab group, compared with those at baseline, follow-up CCTA revealed increased total Agatston score but did not achieve the significant level (251.5 [157.6, 384.0] vs. 178.2 [96.5, 344.6], p = 0.057). The percentage of obstructive CAD decreased (35.2% vs. 51.8%, p = 0.044). In terms of high-risk plaque features, the prevalence of low-attenuation plaque and positive remodeling were significantly reduced (both p < 0.05, details in Table 3). In addition, the calcified plaque volume were significantly increased (188.3 [115.7, 361.0] vs. 129.3 [59.5, 238.3], p = 0.015), while the noncalcified plaque volume (107.5 [40.6, 180.6] vs. 125.0 [65.3, 269.7], p = 0.038) and necrotic volume (0 [0, 4.7] vs. 0 [0, 13.4], p < 0.001) were decreased. The total plaque volume showed mildly increased but did not get the significant level (289.2 [195.8, 582.3] vs. 223.4 [154.2, 573.7], p = 0.194). Furthermore, PCAT density was significantly attenuated in evolocumab group (PCATRCA: − 85.0 [− 89.0, − 82.0] vs. − 79.0 [− 83.5, − 74.0], p < 0.001; PCATLAD: − 83.1 [− 87.2, − 80.1] vs. − 76.9 [− 81.1, − 71.9], p < 0.001; PCATLMT: − 82.3 [− 86.3, − 79.2] vs. − 76.3 [− 80.6, − 71.3], p < 0.001; Fig. 2 and Additional file 1: Fig. S1).
Table 3 Baseline and follow-up CCTA findings in evolocumab group and control group: patient based analysisFig. 2
A representative case of a type 2 diabetes patients treated with evolocumab for 48-week. A–C The baseline LDL-C and Lp(a) level was 3.6 mmol/L and 64 mg/dL. Baseline CCTA revealed noncalcified plaque with moderate stenosis of middle left anterior descending artery. The total plaque volume was 132.2 mm3 and the PCAT density of right coronary artery was − 79HU. D–F After 48-week treatment, both the LDL-C and Lp(a) level were reduced to 1.5 mmol/L and 19 mg/dL, respectively. The follow-up CCTA revealed the lesion regression with mild stenosis. The follow-up total plaque volume decreased to 11.8 mm3 and PCAT density of right coronary artery attenuated to − 85HU. CCTA, coronary computed tomography angiography; HU, hounsfield unit; Lp(a), lipoprotein(a); LDL-C, low-density lipoprotein cholesterol; PCAT, pericoronary adipose tissue
Among the control group, there were no significant difference between baseline and follow-up in terms of total Agatston score, total plaque volume, calcified plaque volume, noncalcified plaque volume, necrotic volume, high-risk plaque features as well as PCAT density (p > 0.05 for all).
The interobserver agreement for total Agatston score, total plaque volume, calcified plaque volume, noncalcified plaque volume, necrotic volume, high-risk plaque features, and PCAT density were excellent (Additional file 1: Table S2).
Correlation analysisThe change in the calcified plaque volume inversely correlated with achieved LDL-C level (r = − 0.31, p < 0.001) and Lp(a) level (r = − 0.33, p < 0.001). There was a positive correlation between the change in noncalcified plaque volume and achieved LDL-C level (r = 0.65, p < 0.001) and Lp(a) (r = 0.68, p < 0.001). Furthermore, the changes of necrotic volume positively associated with achieved LDL-C level (r = 0.44, p < 0.001) and Lp(a) (r = 0.39, p < 0.001) either. However, the change of PCATRCA density only positively correlated with achieved Lp(a) level (r = 0.51, p < 0.001) but not LDL-C level (r = − 0.12, p = 0.11; Fig. 3). Similar finding were observed in PCATLAD and PCATLMT (Details in Additional file 1: Fig. S2).
Fig. 3
The correlation analysis. A–D The change in the calcified plaque volume inversely correlated with achieved LDL-C level (r = − 0.31, p < 0.001); There was a positive correlation between the change in noncalcified plaque volume and achieved LDL-C level (r = 0.65, p < 0.001); Similar finding were observed in the relationship between necrotic volume and achieved LDL-C level (r = 0.44, p < 0.001). However, the change of PCATRCA density did not correlated with achieved LDL-C level (r = − 0.12, p = 0.11). E–H There was a negative association between the change of calcified plaque volume and achieved Lp(a) level (r = − 0.33, p < 0.001); The change in the noncalcified plaque volume positively associated with achieved Lp(a) level (r = 0.68, p < 0.001); Similar finding were observed in the relationship between necrotic volume and achieved LDL-C level (r = 0.39, p < 0.001). In addition, the change in PCATRCA density positively correlated with achieved Lp(a) level (r = 0.51, p < 0.001). CCTA, coronary computed tomography angiography; Lp(a), lipoprotein(a); LDL-C, Low-density lipoprotein cholesterol; PCAT, pericoronary adipose tissue; RCA, right coronary artery
Causal mediation analysisCausal-steps approach showed: (i) evolocumab treatment was significantly associated with the reduction of Lp(a) level (β = − 9.58, 95% CI − 12.65 to − 6.50, p < 0.001); (ii) the change of Lp(a) level was correlated with the improvement of PCATRCA (β = 0.54, 95% CI 0.47–0.61, p < 0.001). The bootstrapping method showed: (i) the total effect of evolocumab on PCATRCA is − 6.63 (95% CI − 8.53 to − 4.99, p < 0.001); (ii) In addition, the change of Lp(a) level had a significant indirect effect (β = − 4.61, 95% CI − 6.11 to − 3.10, p < 0.001) and mediated 69.8% (p < 0.001) for the relationship between evolocumab and changes of PCATRCA. The mediation effects were also found in PCATLAD and PCATLMT (Details in Fig. 4).
Fig. 4
Mediation analysis of the change of Lp(a) level for the relationship between evolocumab treatment and change of PCAT density. A The total effect of evolocumab on change of PCATRCA density is − 6.63 (95% CI − 8.53, − 4.99, p < 0.001). The changes of Lp(a) level had a significant indirect effect (β = − 4.61, 95% CI − 6.11, − 3.10, p < 0.001) and mediated 69.8% (p < 0.001) for the relationship evolocumab treatment and change of PCATRCA density. B The changes of Lp(a) level had a significant indirect effect (β = − 4.40, 95% CI − 5.83, − 2.95, p < 0.001) and mediated 74.7% (p < 0.001) for the relationship evolocumab treatment and change of PCATLAD density. C The changes of Lp(a) level had a significant indirect effect (β = - 4.36, 95% CI − 5.79, − 2.89, p < 0.001) and mediated 66.1% (p < 0.001) for the relationship between evolocumab treatment and change of PCATLMT density. *Adjusted for age, gender, body mass index, hypertension, low-density lipoprotein cholesterol, total plaque volume, noncalcified plaque volume, calcified plaque volume, necrotic volume, as well as high-risk plaque features. CI, confidence interval; LAD, left anterior descending; LMT, left main trunk; Lp(a), lipoprotein(a); LDL-C, low-density lipoprotein cholesterol; PCAT, pericoronary adipose tissue; RCA, right coronary artery
Safety and tolerabilityAll of the patients adhere well to evolocumab. During the treatment of evolocumab, 5 (5.8%) patients presented with mild injection-site reactions, including injection-site erythema and muscle pain. None of the patients discontinued evolocumab due to injection-site reactions.
留言 (0)