
記住我

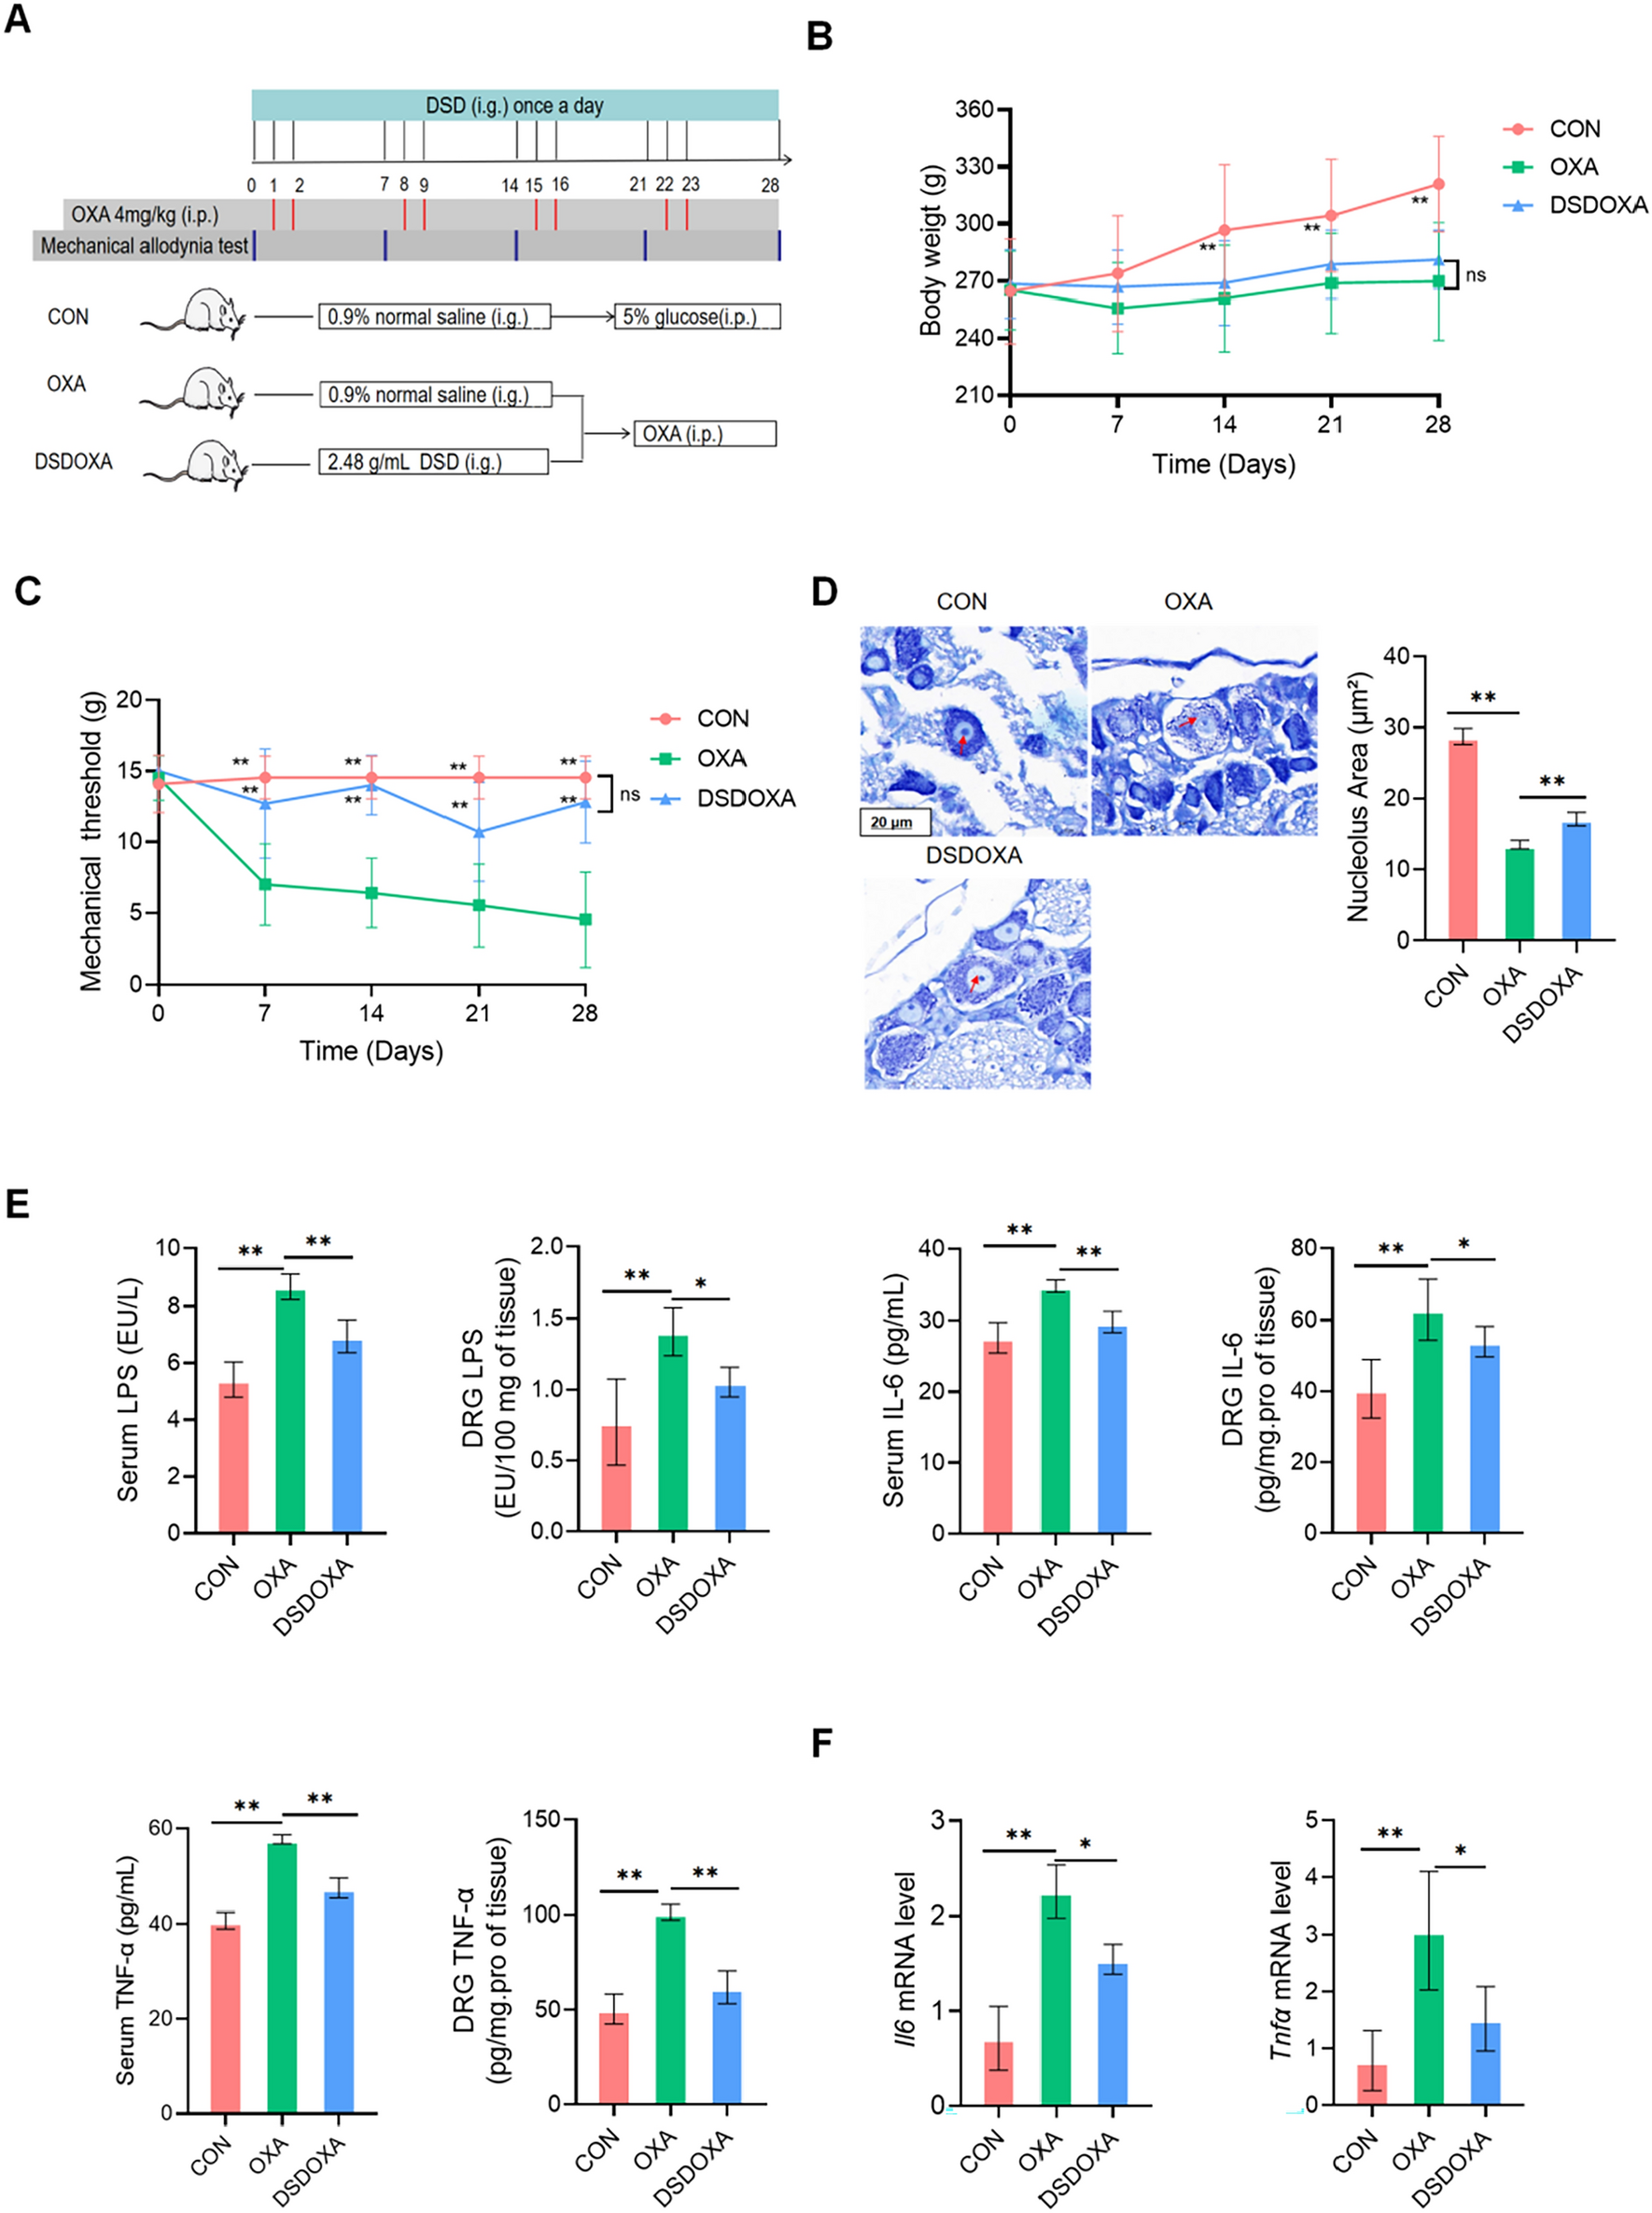


The number that remained alive at the end of the research in the three groups was 10, 9, and 12 respectively of group CC, PF, and GH. The body weight and survival rate of mice showed a significant decrease in the PF group (P < 0.01). GHSPT treatment group significantly increased body weight and survival rate at 21 days (P < 0.01, Fig.1A and B). At the end of the experiment, the lung weight and lung coefficient of the PF group were significantly higher than that in the CC group, while those in the GH group were decreased (P < 0.05, Fig. 1C and D).
Fig. 1
Effects of GHSPT on body weight, survival rate, lung weight and coefficient, and histological findings of the lung in bleomycin-induced PF mice. A Body weight changes of the mice at 11 weeks old. B Survival rate changes of the mice from 8 to 11 weeks old. C Lung weight changes of the mice at 11weeks old. D Lung coefficient changes of the mice at 11-week-old. E Representative light micrographs of the lung tissue (Hematoxylin Eosin; bar: 100 μm). F Representative light micrographs of the lung tissue (Masson’s Trichrome; bar: 100 μm). G Ashcroft score changes of lung histopathology in the mice. H Mass intensity (collagen area/total area) of pulmonary fibrosis in the mice. *P < 0.05, **P < 0.01 compared with CC group; #P < 0.05, ##P < 0.01 compared with PF group. CC: control group; PF: bleomycin-induced PF group; GH: GHSPT treated bleomycin-induced PF group. GHSPT: ginseng honeysuckle superfine powdered tea; PF: pulmonary fibrosis
Under light microscopy, the lung fibrosis and collagen content were significantly higher observed in the PF group than those of the CC group. A decreased level of fibrotic formation was observed in the lung of the GH group when treated with GHSPT (Fig. 1E and F). Moreover, the ashcroft score and mass intensity showed a significant increase in the PF group (P < 0.01). GHSPT treatment group significantly decreased the ashcroft score and mass intensity (P < 0.01, Fig. 1G and H).
Effects of GHSPT on the expression of E-cadherin and α-SMAGHSPT affects pulmonary EMT in BLM-induced PF, we investigated the expression of E-cadherin and α-SMA in the lung tissues of mice. By immunofluorescence, E-cadherin positive areas were decreased in the lung tissues of mice, and GHSPT nearly completely restored the E-cadherin-positive area in the lung tissues. By contrast, α-SMA-positive areas were considerably increased in the lung tissues of the PF group, while GHSPT significantly decreased the α-SMA-positive areas (Fig. 2A). To further investigate the effect of GHSPT on EMT, we measured the protein expression of E-cadherin and α-SMA by western blot. Consistently, GHSPT increased the protein expression of E-cadherin, and inhibited the protein expression of α-SMA in PF group (Fig. 2B, C and D, P < 0.01).
Fig. 2
Effects of GHSPT on the expression of E-cadherin and α-SMA of the lung in bleomycin-induced PF mice. A Immunofluorescence images of E-cadherin and α-SMA in the lung tissue (×200). B Western blot images of E-cadherin and α-SMA in the lung tissue. C, D Data were expressed as the expression ratio of E-cadherin/β-actin and α-SMA/β-actin. *P < 0.05, **P < 0.01 compared with CC group; #P < 0.05, ##P < 0.01 compared with PF group. CC: control group; PF: bleomycin-induced PF group; GH: GHSPT treated bleomycin-induced PF group. GHSPT: ginseng honeysuckle superfine powdered tea; PF: pulmonary fibrosis
Protein identification and potential targets of GHSPT in treating PFProteomics analysis showed that 525 proteins had significantly changed in the lung of untreated PF mice (Additional file 4: Table S1). Among them, 19 differential proteins were back-regulated to normal levels after GHSPT therapy (Fig. 3A, and Table 1). These results demonstrate that bleomycin-induced mice have significant effects on the lung proteins, but that these effects are reversed by GHSPT treatment in PF mice. The back-regulated proteins include peroxiredoxin-5, AFF4, PIKfyve, E3 ubiquitin-protein ligase PPP1R11, Amotl2 and GLP1R. Volcano plot and cluster heatmap indicating significantly altered proteins identified in the combined datasets. Proteins plotted against log-transformed fold change in abundance between the PF group and CC group (Fig. 3B and C), and between the GH group and PF group (Fig. 3D and E).
Fig. 3
Protein identification and potential targets of GHSPT in treating PF. A Proteomics analysis of 19 back-regulated proteins after GHSPT therapy in the lung tissue of PF mice. Volcano plot indicating significantly altered proteins identified in the combined datasets, B between PF group and CC group; C between GH group and PF group. Cluster heatmap indicating significantly altered proteins identified in the combined datasets, D between PF group and CC group; E between GH group and PF group. F A total of 821 and 328 targets of PF and potential active ingredients (GHSPT), respectively, and they shared 92 overlapping targets. G A total of 821 and 178 targets of PF and serum migrant compounds (GHSPT), respectively, and they shared 33 overlapping targets. CC control group, PF bleomycin-induced PF group, GH GHSPT treated bleomycin-induced PF group, GH1 potential active ingredients of GHSPT, GH2 serum migrant compounds of GHSPT, GHSPT ginseng honeysuckle superfine powdered tea, PF pulmonary fibrosis
Table 1 Identified significant differenced expression proteins of lung in the pulmonary fibrosis mice as reversed by Ginseng honeysuckle superfine powdered teaWe obtained 17 active ingredients in Panax ginseng C.A. Mey, 17 in Lonicera japonica Thunb, 8 in Wurfbainia villosa var. villosa, 5 in Citrus × aurantium f. deliciosa, 6 in Poria cocos, 88 in Glycyrrhiza uralensis Fisch. ex DC, 12 in Gardenia jasminoides J.Ellis, and 6 in Camellia sinensis (L.) Kuntze (Additional file 4: Table S2). We obtained 92 potential therapeutic targets of GHSPT (between potential active ingredients and PF), and 33 related targets of GHSPT (between serum migrant compounds and PF) (Fig. 3F and G, Additional file 4: Table S3,S4 and S5).
Identification of serum migrant compounds and botanical drugs‑active ingredients-drug targets network analysis of GHSPTThe overall distribution trend of all samples was observed through PCA analysis is shown in Additional file 4: Fig. S1. Based on the basis of standards and related literatures, 25 compounds from GHSPT in total were identified initially (Table 2). These compounds involved prenol lipids, flavonoids, isoflavonoids, iridoid glycoside, tetracyclic triterpenoids, organooxygen compounds, glycerolipids, linear 1, 3-diarylpropanoids, fatty acyls, carboxylic acids, and derivatives and imidazopyrimidines. According to previous research, above compounds might originate from Panax ginseng C.A. Mey, Lonicera japonica Thunb, Citrus × aurantium f. deliciosa, Poria cocos, Glycyrrhiza uralensis Fisch. ex DC, Gardenia jasminoides J.Ellis and Camellia sinensis (L.) Kuntze in GHSPT. The GHSPT-component- serum migrant compounds network was developed (Fig. 4A). The cluster heatmap of serum migrant compounds of GHSPT was shown in Fig. 4B.
Table 2 Characterization of serum bioactive ingredients of Ginseng honeysuckle superfine powdered tea by UPLC-Q-Exactive MS/MS Fig. 4
Identification of serum migrant compounds and botanical drugs‑active ingredients-drug targets network analysis of GHSPT. A GHSPT- component- serum migrant compounds network. B Cluster heatmap of serum migrant compounds of GHSPT. C Top 20 potential targets and related active ingredients number. GHSPT: ginseng honeysuckle superfine powdered tea. D Disease‑ potential active ingredients-target network of GHSPT. E Disease‑ serum migrant compounds-target network of GHSPT. F Botanical drugs‑potential active ingredients-drug targets network of GHSPT. G Botanical drugs‑serum migrant compounds-drug targets network of GHSPT
The top 20 potential targets include prostaglandin-endoperoxide synthase 2 (PTGS2), heat shock protein 90 alpha family class A member 1 (HSP90AA1), peroxisome proliferator-activated receptor gamma, proto-oncogene serine/threonine-protein kinase Pim-1, trypsin-1, mitogen-activated protein kinase 14, prothrombin, acetylcholinesterase, phosphatidylinositol-4, 5-bisphosphate 3-kinase catalytic subunit gamma isoform. PTGS2 and HSP90AA1 can interact with up to 113 and 80 related active ingredients (Fig. 4C). Disease‑potential active ingredients and serum migrant compounds-target networks were developed, involving 92 targets and 33 targets (Fig. 4D and E). Botanical drug‑potential active ingredients and serum migrant compounds-target networks were developed (Fig. 4F and G).
GO function enrichment analysisFor the analysis of BP, CC and MF of differentially expression proteins (DEPs) between CC group and PF group, majority of obtained proteins was involved in cellular process, metabolic process, and related to intracellular anatomical structure, cytoplasm, and included protein binding, catalytic activity (Fig. 5A). For the analysis of BP, CC and MF of proteins normalized by GHSPT treatment was involved in regulation of transcription by RNA polymerase III, endocytic vesicle, and peroxynitrite reductase activity (Fig. 5B). The subcellular localization of 525 DEPs was mainly in the cytoplasm (35.86%), membrane (25.55%), and mitochondrion (9.4%) (Fig. 5C). The subcellular localization of back-regulated proteins by GHSPT was mainly in the cytoplasm (31.82%), membrane (18.18%) and golgi apparatus (13.64%) (Fig. 5D).
Fig. 5
GO Function Enrichment Analysis. A Identified differential expression proteins between CC and PF groups. B Identified differential expression proteins between the GH group and the PF group. C Subcellular localization of differential expression proteins between CC and PF groups. D Subcellular localization of differential expression proteins between PF and GH groups. E GO analysis of targets of GHSPT (potential active ingredients) in treating PF. F GO analysis of targets of GHSPT (serum migrant compounds). CC control group, PF bleomycin-induced PF group, GH GHSPT treated bleomycin-induced PF group, GHSPT ginseng honeysuckle superfine powdered tea, PF pulmonary fibrosis
GO enrichment analyzed 92 drug targets of potential active ingredients and 33 drug targets of serum migrant compounds GHSPT in treating PF in BP, CC and MF (Fig. 5E and F). GO analysis of targets of GHSPT (potential active ingredients), BP-enriched targets mainly include response to cytokine, regulation of transcription by RNA polymerase III and regulation of apoptosis involved in tissue homeostasis. CC-enriched targets are related to intracellular anatomical structure, cytoplasm, and endocytic vesicle. Enriched MF mainly include enzyme binding, signaling receptor binding, catalytic activity, peroxynitrite reductase activity, and glucagon like peptide 1 receptor activity. GO analysis of targets of GHSPT (serum migrant compounds), BP-enriched targets mainly include cell population proliferation and inflammatory response. CC-enriched targets are related to extracellular region and cell periphery. Enriched MF mainly include enzyme binding and signaling receptor binding.
KEGG pathway enrichment analysisKEGG signaling pathways analyzed 525 DEPs in PF groups, and 19 proteins treated with GHSPT (Fig. 6A, B, Additional file 4: Table S6 and S7). The up-regulation or down-regulation of KEGG signaling pathways in the PF group was shown in Fig. 6C. The up-regulation signaling pathways mainly include apoptosis, lysosome, ferroptosis, and estrogen signaling pathway. The down-regulation signaling pathways mainly include fatty acid degradation, pyruvate metabolism, and propanoate metabolism. The up-regulation or down-regulation of KEGG signaling pathways in the GH group was shown in Fig. 6D. The up-regulation signaling pathways mainly include fatty acid elongation, ether lipid metabolism, and Wnt signaling pathway. The down-regulation signaling pathways mainly include amino sugar and nucleotide sugar metabolism and PI3K-Akt signaling pathway. In this study, the significantly enriched KEGG signaling pathways analyzed 92 drug targets of potential active ingredients and 33 drug targets of serum migrant compounds GHSPT (Fig. 6E and F, Additional file 4: Table S8). The enriched signaling pathways mainly include apoptosis, P53 and MAPK signaling pathway, ferroptosis, lysosome, phagosome, NOD-like receptor, and VEGF signaling pathway ether lipid metabolism and amino sugar and nucleotide sugar metabolism (potential active ingredients), and TNF, Toll-like receptor and C-type lectin receptor signaling pathways (serum migrant compounds).
Fig. 6
KEGG Pathway Enrichment Analysis. A: Identified differential expression proteins between CC and PF groups. B: Identified differential expression proteins between the GH group and the PF group. C: Up-regulation or down-regulation of KEGG signaling pathways in the PF group. D: Up-regulation or down-regulation of KEGG signaling pathways in the GH group. E: KEGG pathways analysis of targets of GHSPT (potential active ingredients) in treating PF. F: KEGG pathways analysis of targets of GHSPT (serum migrant compounds). CC: control group; PF: bleomycin-induced PF group; GH: GHSPT treated bleomycin-induced PF group. GHSPT: ginseng honeysuckle superfine powdered tea; PF: pulmonary fibrosis
PPI network analysisIn the PPI pathway-gene, and pathway-pathway network of 525 DEPs, the lysosome, apoptosis, ferroptosis, NOD-like receptor, VEGF, and estrogen signaling pathways were at the core (Fig. 7A, B and C). In the PPI pathway-gene network of 19 proteins treated with GHSPT, these networks were related to ferroptosis, ether lipid metabolism, and amino sugar and nucleotide sugar metabolism pathway (Fig. 7D). There are 92 nodes (representing targets of potential active ingredients) and 33 nodes (representing targets of serum migrant compounds) (Fig. 7E and F). The larger node indicates the greater degree value.
Fig. 7
PPI network analysis. A PPI pathway-gene (all) network between PF group and CC group. B PPI pathway-gene (part) network between PF group and CC group. C PPI pathway- pathway network between PF group and CC group. D PPI pathway-gene network between GH group and PF group. E PPI networks of 92 targets of GHSPT (potential active ingredients) for the treatment of PF. F PPI networks of 33 targets of GHSPT (serum migrant compounds) for the treatment of PF. CC control group, PF bleomycin-induced the PF group, GH GHSPT treated bleomycin-induced the PF group, GHSPT ginseng honeysuckle superfine powdered tea, PF pulmonary fibrosis
Validation of drug targets of proteomics and network pharmacology with western blotAmong regulated proteins, we validated four differentially regulated proteins identified in our LC-MS/MS analysis using western blot assays. Consistently, the protein expression of PIKfyve and AFF4 was up-regulated in the lung tissues of the PF group. Moreover, the expression of Amotl2 and GLP1R was lower in the PF group than those in the CC group. GHSPT inhibited the protein expression of PIKfyve and AFF4, and increased the protein expression of Amotl2 and GLP1R in the PF group (Fig. 8A, B, C, D and E). Among 92 drug targets of network pharmacology, HSP90AA1, MMP1, TGF-β1, JUN, P53, p-Akt (Ser473) and p-STAT3 (Ser727) were validated with western blot. It was found that the protein expression of HSP90AA1, MMP1, TGF-β1, JUN, P53, p-Akt (Ser473) and p-STAT3 (Ser727) in the lung of PF group was higher than that in the CC group. After treatment with GHSPT, the expression of those was lower than that in the PF group (Fig. 8F, G, H, I, J, K and L, and Fig. 8M). They were consistent with the results of network pharmacology and LC-MS/MS analysis.
Fig. 8
Validation of drug targets of proteomics and network pharmacology with western blot. A Western blot images of PIKfyve, AFF4, Amotl2, and GLP1R in the lung tissue. B–E Data were expressed as the expression ratio of PIKfyve/β-actin, AFF4/β-actin, Amotl2/β-actin, and GLP1R/β-actin (n = 3 per group). F Western blot images of HSP90AA1, MMP1, TGF-β1, JUN, P53, p-Akt, Akt, p-STAT3 and STAT3 in the lung tissue. G–M: Data were expressed as the expression ratio of HSP90AA1/β-actin, MMP1/β-actin, TGF-β1/β-actin, JUN/β-actin, P53/β-actin, p-Akt/Akt, and p-STAT3/STAT3 (n = 3 per group).*P < 0.05, **P < 0.01 compared with CC group; #P < 0.05, ##P < 0.01 compared with PF group. CC: control group, PF bleomycin-induced PF group, GH GHSPT treated bleomycin-induced PF group, GHSPT ginseng honeysuckle superfine powdered tea, PF pulmonary fibrosis
留言 (0)