


記住我


Recent advancements in single cell technologies have provided unprecedented opportunities in analysis of omics data. This allows researchers to probe biological functions at the cellular level while studying embryonic development, immune system or cancer (Griffiths et al., 2018; Papalexi and Satija, 2018; Wills and Mead, 2015). Existing technologies include DROP-seq (Macosko et al., 2015), SMART-seq2 Picelli et al. (2013) and 10x Genomics, which allow measuring mRNA expressions at single cell resolution (scRNA-seq). Most recently, technologies have further scaled up to produce data assays from multiple modalities. This has provided several views of the same cell of interest, thereby refining our definitions of the cellular identity. Multi-omics studies provide better understanding of the underlying biological mechanisms active during disease growth and progression, which were otherwise hidden due to the inclusion of a single omics. They also help us understand the effect of one omics layer on the other (Seal et al., 2020). A few such methods include CITE-seq (Stoeckius et al., 2017) and REAP-seq Peterson et al. (2017) which enable paired measurement of RNA and cell surface proteins. ATAC-seq (Buenrostro et al., 2015) measures chromatin accessibility while other methods like, SNARE-seq (Chen et al., 2019), sci-CAR (Cao et al., 2018) and SHARE-seq Clyde (2021) measure paired gene expression and chromatin accessibility. ScNMT (Clark et al., 2018), on the other hand, integrates single cell chromatin accessibility, DNA methylation and transcriptomics data. However, integration of various modalities of data does not come without its challenges (Lähnemann et al., 2020). High data dimension, sensitivity associated with each platform, zero-inflation due to dropouts (Jiang et al., 2022), and technical batch effects (Luecken et al., 2022) account for the stochasticity and noise in the data. An appropriate organization and analysis of these multi-modal datasets involve clever way of their integration and demand efficient computing paradigm.
At present, several methods exist that can perform the task of integration of single cell omics modalities. Seuratv3 (Stuart et al., 2019) can integrate various single cell omics datasets including RNA-seq, protein expression, chromatin and spatial data, and transfer information between them. Seuratv4 (Hao et al., 2021) provides multi-modal single cell analysis using “weighted nearest neighbor” method. MOFA+ (Argelaguet et al., 2020), based on Bayesian Group Factor Analysis, is another method that generates a low-dimensional representation of the data by integrating two or more omics among gene expression, DNA methylation and chromatin data. In recent years, several neural network-based methods have been developed for the task of single cell multi-omics integration. One such method, GLUE (Cao and Gao, 2022), integrates unpaired samples from single cell multi-omics data and also predicts regulatory interactions. Other methods, like scJoint (Lin et al., 2022) and scMVP (Li et al., 2022), can integrate scRNA-seq and scATAC-seq data. The former is a semi-supervised framework which allows label transfer and joint visualization, while the latter extracts a latent representation from the integrated data using a modified variational autoencoder model. TotalVI (Gayoso et al., 2021), on the other hand, uses an encoder function to learn a joint representation of the data and Bayesian inference to build a latent embedding from single cell RNA and protein expressions. Multigrate (Lotfollahi et al., 2022) develops an alternative pipeline for integrating CITE-seq and single cell ATAC-RNA data for both paired and unpaired samples. It has been used to map multimodal queries to reference atlases and impute missing values. Other standard omics integration methods include UINMF (Kriebel and Welch, 2022), MUON (Bredikhin et al., 2022), scMOC (Eltager et al., 2021) and SIMBA (Chen et al., 2021). A comprehensive review of major single cell multi-omics integration methods can be found in (Stanojevic et al., 2022).
With single cell multi-omics analysis, we can now comprehend the mechanisms underlying complex disease states and progressions at a cellular resolution. It has provided us multiple views of the same patient and cognizance into the individual’s health status. Some diseases, though being rare (often referred to as a rare disease (RD)), cumulatively affect quite a substantial percentage of patients. Overall, there are more than 7,000 variants of RDs. RDs affect patients’ and their families’ quality of life, and have significant societal impact. Due to the rarity of each RD, it is extremely difficult to properly diagnose and treat these individuals, as well as engage them into research to upgrade therapies. With the advancements in omics technologies, molecular understanding of RDs has improved over time leading to their rapid diagnosis. To combine multi-omics data from various technologies, Artificial Intelligence (AI)-based integration techniques are, nevertheless, becoming more and more necessary. Deep learning (DL) methodologies to integrate and query data from several heterogeneous sources may also be utilised to dramatically accelerate the discovery of efficient RD therapies (Bottini et al., 2021). A detailed review (Lee et al., 2022) exploring 332 articles on the application of DL on RDs indicate the rising demand for the use of DL for advancements in diagnosis and therapeutics of RDs.
There are, however, challenges to be addressed while using DL for multi-omics analysis for health and disease. Although different omics measurements are recorded against the same set of cells, they encode different features related to the underlying transcriptional states and activities. Existing methods to handle these datasets are not always capable of extracting features relevant to a biologically significant problem, including cell-type classification/clustering, biomarker identification, disease prediction and drug discovery. Furthermore, sparsity and noise in the data along with differences in platforms producing such high-dimensional datasets and the presence of batch effects add to the complexity of analysis (Lance et al., 2022). An inherent feature of multi-omics data in concern is its complex, non-linear, layered structure. The architecture of a deep neural network also resembles such layered non-linearity. The output from each layer is multiplied by its weight vector to compute the weighted sum, and a non-linear function is then applied over the weighted sum for each node in the layer. The non-linear output is then passed on to the next layer. Thus, deep learning models facilitate learning complex features in an unsupervised manner. However, existing neural network-based methods for single cell multi-omics integration are computationally expensive since they involve substantial amount of parameter training. Further, even though pre-processing of single cell data involves steps that may include scaling/normalization using a specific data distribution, methods for integration of such pre-processed data should be free from making assumptions about data distribution, which is not the case with most of the existing integration models.
All these problems discussed above have encouraged us to develop a robust integration method for single cell multi-omics integration that can be applied to health and disease analysis. Hence, in this work, we have introduced a novel Unsupervised neural network for single cell Multi-omics INTegration (UMINT). UMINT is competent enough to integrate different single cell omics layers of high dimensions with ease. It produces a latent low-dimensional embedding that can extract relevant features from the data, which facilitate further analyses. It can also reconstruct the data with high accuracy. Further, UMINT does not make assumptions about the distribution of data, and can integrate a variable number of omics modalities. In addition, UMINT owns a light-weight architecture and is thus computationally far less expensive than some of the existing unsupervised neural network based methods (like those based on autoencoder networks), used for single cell multi-omics integration. The performance of UMINT has been demonstrated on multiple publicly available healthy and disease datasets. These comprise four CITE-seq datasets, one of which contains cells from MALT tumor, a rare variant of malignant lymphoma. We have benchmarked the results against several existing state-of-the-art algorithms used for single cell multi-omics integration, which fall under different categories. In-silico experimental results compare favourably for UMINT against these state-of-the-art methods. Additionally, the performance of UMINT has been validated through integration of an auxiliary multimodal single cell paired gene expression and ATAC-seq (chromatin accessibility) data. Finally, as a further extension to this work, UMINT has been used to integrate bulk multi-omics data with more than two omics layers, which it has been able to execute with ease. Thus, UMINT’s ability to integrate widely heterogenous omics data (CITE-seq, paired RNA-seq and ATAC-seq) with varying number of omics layers boosts its utility as a powerful integration model and makes it completely fit in with the status quo.
The remaining part of this article has been organized as follows. Section 2 explains the methodology behind the proposed single cell multi-omics integration technique, called UMINT. Section 3 describes in silico experimental results obtained on different datasets used in this work and provides a detailed comparison against other existing methods for single cell multi-omics integration. In Section 4, the strengths and limitations of the proposed method are discussed along with concluding remarks.
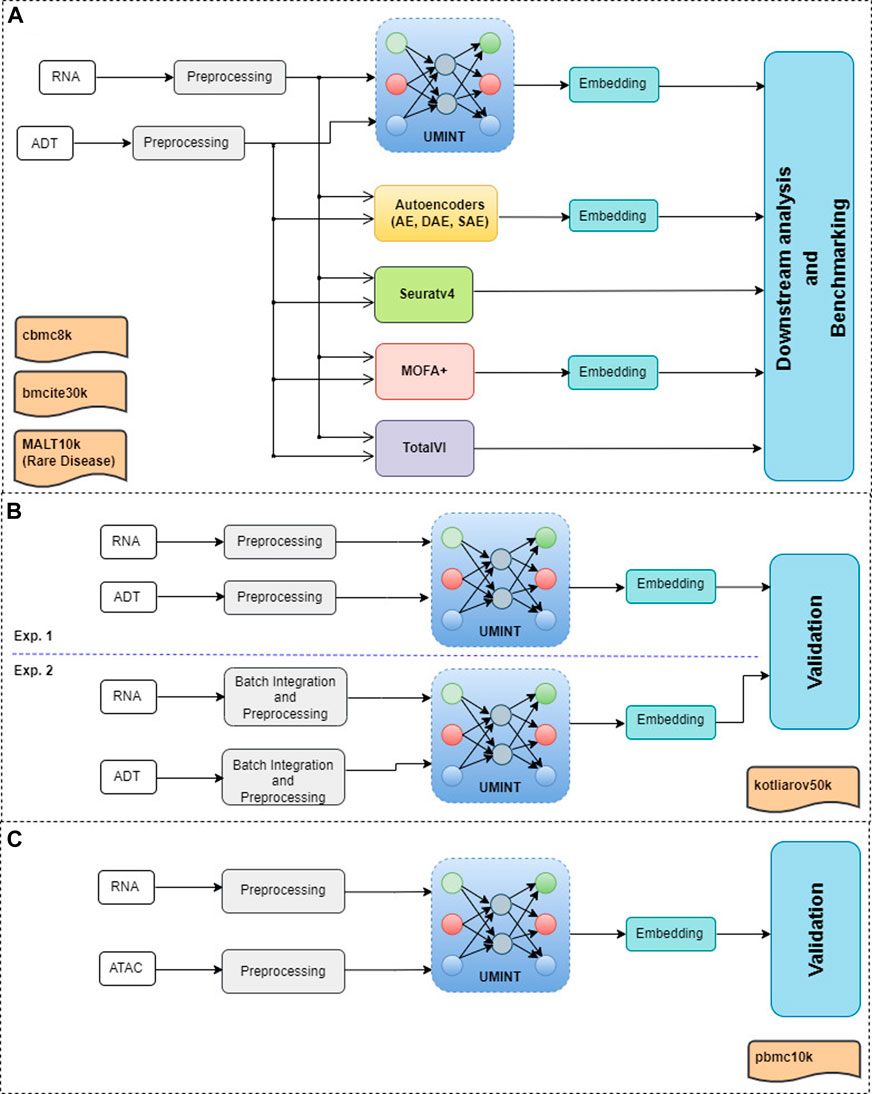
2 MethodologyThis section describes the datasets used in the experiments, the methodology used for data pre-processing and the proposed neural network model, called UMINT, for single cell multi-omics integration. Figure 1 shows a graphical abstract illustrating the overall workflow of the methods used for single cell multi-omics integration, and the procedures conducted for preprocessing, embedding, validation and benchmarking performed in this work.
FIGURE 1. A graphical abstract showing the overall workflow of the methods used for evaluation and benchmarking of the proposed method for single cell multi-omics integration, called UMINT. Panel (A) shows the primary experiments conducted in this work, as described in Section 3.1 and Section 3.2. Each modalities in cbmc8k, bmcite30k and MALT10k have first been preprocessed using Seuratv4. The preprocessed datasets have been fed as input to UMINT, Autoencoder-based methods (AE, SAE and DAE), Seuratv4, MOFA+ and TotalVI. Seuratv4 and TotalVI are capable of producing a latent low-dimensional embedding and subsequently find cell clusters. The embedding produced by UMINT, AE-based methods and MOFA + have been subjected to k-means and hierarchical clustering. The clustering performance of all the methods have then been compared. Panel (B) shows the experiments conducted for kotliarov50k, where preprocessed data from each modality without batch integration (Exp. 1) and with batch-integration (Exp. 2) done using Seuratv4 SCTransform () have been separately fed as input to UMINT, and the clustering performance on the embeddings generated by UMINT in both these cases have been compared, as explained in Section 3.3. Panel (C) depicts the experiments carried out on pbmc10k, where the two modalities (RNA and ATAC) have been preprocessed using MUON and the integrated embedding produced by UMINT has been assessed for its clustering performance, as explained in Section 3.4.
2.1 Data acquisition and pre-processingInitially, four publicly available CITE-seq datasets, viz., cbmc8k (Stoeckius et al., 2017), MALT10k (Li et al., 2021), bmcite30k (Stuart et al., 2019) and kotliarov50k (Kotliarov et al., 2020), have been used in this work. MALT10k dataset consists of cells from a MALT tumor, a rare kind of malignant lymphoma (Oh et al., 2006). The datasets have been downloaded as count matrices and pre-processed via Seuratv4 (Hao et al., 2021). For scRNA-seq part in these datasets, we have normalized them by library size to sum up to 10,000, applied a logarithmic transformation, extracted highly variable genes, and finally scaled them linearly (with default parameters). The protein expressions/antibody-derived tag (ADT) datasets have been normalized using the centered log-ratio transformation (Stoeckius et al., 2017). Three proteins, viz., CCR5, CCR7 and CD10, have been removed from cbmc8k dataset due to poor abundance. The first three datasets, viz., cbmc8k, MALT10k and bmcite30k, have been used to evaluate the performance of UMINT and compare the results against other state-of-the-art algorithms. The fourth dataset, viz., kotliarov50k, contains filtered cells with highly variable genes only. It has been preprocessed via Seuratv4 and used to assess other performance criteria of the proposed methodology. Another auxilliary single cell multimodal dataset, downloaded from 10x Genomics, has been used at a later stage of the work. It contains paired ATAC and gene expression data from human PBMCs with granulocytes removed through cell sorting (processed with ARC 1.0.0 pipeline). It has been preprocessed via MUON (Bredikhin et al., 2022), and used to evaluate the performance of UMINT on paired RNA-seq and ATAC-seq data. The summary of the single cell multi-omics datasets used in this work have been listed in Table 1.
TABLE 1. Summary of datasets used for evaluation of UMINT.
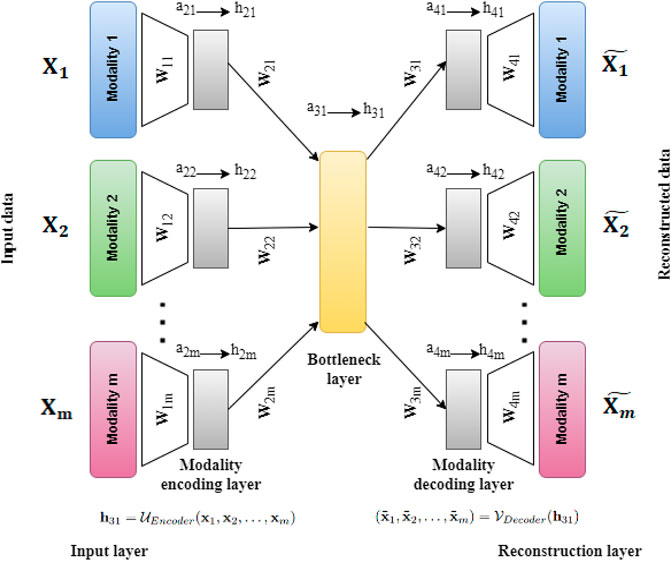
2.2 Unsupervised neural network for single cell multi-omics INTegration (UMINT)In this work, we have developed a deep Unsupervised neural network for single cell Multi-omics INTegration (UMINT). UMINT is a non-recurrent feed-forward neural network that is efficient enough to integrate variable number of omics layers and extract a latent embedding at a reduced dimension. The network structure of UMINT represents a novel neural network architecture as shown in Figure 2.
FIGURE 2. Architecture of UMINT showing propagation of input data through the network. Eq. 1 shows how the Modality encoding layer encodes each modality fed as input to UMINT. At the Bottleneck layer, integration of these modalities is performed using Eq. 2. The encoding process that combines the above mentioned steps is represented in Eq. 3. Eq. 4 shows how the Modality decoding layer tries to decode individual modalities and produce reconstructions. The decoding process is represented in Eq. 5. Once a reconstruction is produced, the loss is calculated using Eq. 6. The error is then propagated backwards through the network and the trainable parameters are updated accordingly.
Let X1, X2, …, Xm be m datasets corresponding to m different omics modalities having n samples (cells) each with d1, d2, …, dm features (RNAs in case of gene expression data, ADTs in case of protein expression data or Peaks in case of transposase-accessible chromatin data) respectively. The UMINT architecture consists of two sub-architectures - an encoder and a decoder. The encoder accepts data from multi-omics datasets presented to the Input layer, transports them through one or more Modality encoding layer(s) and integrates them in the final layer, known as the Bottleneck layer. The decoder accepts the embedded output from the Bottleneck layer, transports them through one or more Modality decoding layers and finally tries to reconstruct the original data at the Reconstruction layer. In this work, we have used only one layer each for modality encoding and decoding. However, UMINT may contain multiple such layers based on the requirement. In order to improve generalization capability and reduce dimension of the latent embedding, the number of neurons at the Bottleneck layer has been kept smaller than the number of neurons in the Input layer.
2.2.1 Forward propagationThe Input layer of UMINT consists of m different modules, each of which accepts input from a data modality. The number of neurons in each of the modules in the Input layer is equal to the dimensions of the individual data modalities d1, d2, …, dm respectively. In this layer, UMINT tries to find a suitable projection for each of the data modalities that may be good enough to get integrated in subsequent layers. Each module in the first Modality encoding layer shares a dense connection with the corresponding modules of the Input layer. The first Modality encoding layer containing m modules thus accepts data from m modules in the Input layer as input, and obtains m different projections. Let aji and hji be the input to and the output from the ith module in the jth layer respectively. Then, for the Input and Modality encoding layers, we have
a1i=xih1i=a1ia2i=W1ih1i+b1ih2i=ReLUa2i(1)where xi is a sample in ith modality, and ReLU(y) = max(0, y). The term W1i denotes the weights between ith module of the Input layer and ith module of the first Modality encoding layer, and b1i denotes the bias terms of the nodes in ith Modality encoding layer. Finally, the outputs from the Modality encoding layer(s) are projected onto a lower dimensional space in the Bottleneck layer. The final Modality encoding layer and the Bottleneck layer are fully connected. If W2i represents the weights between the ith module of the final Modality encoding layer and the Bottleneck layer, then we have
a31=∑i=1mW2ih2i+b21h31=ReLUa31(2)where b21 denotes the bias terms of the nodes in Bottleneck layer. This concludes the process of encoding. The overall function of the encoder network can thus be represented as
h31=UEncoderx1,x2,…,xm(3)Reconstruction of the original data is done by the decoder network in exactly the opposite manner to that of encoding. The integrated embedding coming out of the Bottleneck layer is projected onto the Modality decoding layer(s) which consists of the same number of modules as that in the Modality encoding layer(s). The number of neurons in each module of the Modality decoding layer is identical to that used in the modules in the Modality encoding layer. The last layer of the decoder is the Reconstruction layer which tries to reconstruct the original data from the respective modules in the final Modality decoding layer. The process of decoding can be expressed as
a4i=W3ih31+b3ih4i=ReLUa4ia5i=W4ih4i+b4ih5i=a5i=x̃i(4)where Wji and bji represent weights and biases for the ith module in the jth layer respectively. Thus, the decoder function is given by
x̃1,x̃2,…,x̃m=VDecoderh31(5)where x̃i denotes the reconstruction for xi.
2.2.2 Objective functionIn this scope of work, UMINT has been initially used to integrate scRNA-seq and single cell protein expression data. Subsequently, it has been used to integrate scRNA-seq and ATAC-seq data. Thus, for each dataset, paired RNA and ADT assays, or paired RNA and ATAC assays form the inputs to different modules of the Input Layer of UMINT. For each cell x, UMINT tries to find an optimal reconstruction x̃ of the input data retaining as much information as possible, thereby minimizing the reconstruction error ‖x−x̃‖. The reconstruction error is contributed by reconstruction loss from each modality. In order to avoid biasness arising out of number of dimensions in the input modalities, we have introduced a balancing parameter λi. Additionally, in order to limit over-fitting, we have used an L1 regularization on the nodes’ activities to allow sparsity of nodes’ outputs and an L2 regularization on the weight values since L2 regularization tries to shift weight values towards zero. Both L1 and L2 regularizations minimize the model complexity. In this work, L1 and L2 regularizations have been controlled using regularization parameters α and β respectively. The objective function thus becomes
LUMINT=1n∑i=1mλi‖Xi−X̃i‖2+∑i=1m∑j=24α‖hji‖1+β‖Wji‖2(6)Values of the regularization parameters α and β have been set to 0.0001 and 0.001 respectively, as recommended in literature (Chaudhary et al., 2018). UMINT has been trained for 25 epochs using Adam Optimizer (Kingma and Ba, 2017) with a batch size of 16 and Eq. 6 as the loss function. During the forward pass, the data is fed as input to the encoder. A lossy reconstruction of the input data is produced by the decoder at the Reconstruction layer. The error value is then propagated backwards, and the weights and biases are updated for a better reconstruction in the next forward pass.
2.3 Latent low-dimensional embedding and clusteringAt the outset of this work, the proposed integration model, called UMINT, has been used to integrate RNA and protein expression data. Once trained to reconstruct the input data, UMINT is capable of learning a latent low-dimensional embedding that extracts relevant features from the integrated data. Here, we have used UMINT to extract a latent embedding of 64 dimensions. This latent embedding has been used in the subsequent step for downstream analysis in order to explore its effectiveness. We have used agglomerative hierarchical clustering and k-means clustering algorithm on this latent embedding to cluster the cell-types for each of the datasets used in the study. The performance of UMINT has then been compared against existing benchmark methods used for multi-omics integration. We have used two measures, viz., Adjusted Rand Index (ARI) and Fowlkes Mallows Index (FMI) scores, to measure the degree of agreement between the actual and predicted cell-types, for all the methods used in comparison including UMINT. The actual cell types corresponding to the ground truth data have been obtained from the corresponding source datasets mentioned in Table 1.
For two sets of cluster labels, the overlap between them is represented by a contingency table C = [cij], where cij indicates the total number of points belonging to both ith cluster of the first set and jth cluster of the second set. ARI is an external cluster validity index, and is thus defined as
ARI=∑ijcij2−∑ipi2∑jqj2/N212∑ipi2+∑jqj2−∑ipi2∑jqj2/N2(7)where pi = ∑jcij, qj = ∑icij and N = ∑ijcij respectively. An ARI value close to 1 indicates good resemblance between two clusters. Similarly, FMI, another external evaluation index used to measure the similarity between two sets of cluster labels, is defined as
where TP, FP and FN denotes the count of True Positives, False Positives and False Negatives respectively. The FMI score lies between 0 and 1, and a high value implies a good similarity between two clusters.
At a subsequent stage of the work, UMINT has been evaluated on another multiome dataset containing paired gene expresssion and ATAC-seq data. After preprocessing each modality and reducing them to highly variable features, UMINT has been used to extract a latent 64-dimensional embedding by integrating the RNA and ATAC assays. This latent embedding has been further subjected to agglomerative hierarchical clustering and k-means clustering. The embedding quality has been assessed using external evaluation criteria like, ARI and FMI, as explained above.
3 ResultsUMINT has been applied on a variety of datasets containing cells from both healthy donors as well as donors with a disease, and its performance has been evaluated over multiple steps as depicted in the graphical abstract shown in Figure 1. Initially, it has been benchmarked on three CITE-seq datasets, viz., cbmc8k, MALT10k and bmcite30k, where cbmc8k and bmcite30k contain cells from healthy samples, and MALT10k contains cells from rare lymphoma (MALT). The latent embedding produced by UMINT has been first compared with that produced by Autoencoder (AE)-based architectures. Subsequently, the UMINT-generated embedding has been compared with three other state-of-the-art single cell multi-omics integration methods. Section 3.1 and Section 3.2 describe results of comparison of UMINT against AE and other state-of-the-art methods on these three datasets. Thereafter, UMINT has been further tested for its performance on another CITE-seq dataset kotliarov50k having multiple batches. For evaluating the batch correction performance of UMINT, we have performed two different experiments on kotliarov50k dataset, with and without batch integration. Finally, as an extended utility, UMINT has been used to integrate paired gene expression and ATAC-seq data. The integrated embedding generated by UMINT has then been validated through clustering techniques. Additionally, UMINT has been validated on a bulk multi-omics cancer dataset for integration and classification.
3.1 Comparison with autoencoder-based unsupervised neural network modelsAn AE network (Hinton and Salakhutdinov, 2006), which is an unsupervised neural network used for dimension reduction, being the closest resemblance to UMINT, we have first compared it with a regular AE network and its variations, viz., Denoising AE (DAE) and Sparse AE (SAE), both in terms of architectural difference and performance.
3.1.1 Comparison with autoencoder-based models with respect to number of trainable parameters and execution timeSimilar to an AE network, UMINT also tries to reconstruct the original input as explained in Section 2.2. However, there is a difference between the two. The input layer in AE shares a dense connection with the first hidden layer, whereas, the connections between the Input layer and the first Modality encoding layer in UMINT is not dense. This reduces the number of parameters to be trained, drastically. Although, in this work, UMINT has been used to integrate single cell RNA and protein expression data, it is quite capable of integrating any number of omics layers. Let us consider that the input to UMINT consists of data from m modalities having n samples each with d1, d2, …, dm dimensions respectively. As shown in Figure 2, UMINT consists of the same number of modules in the Modality encoding layer as that in the Input layer. If the number of neurons in each of the module of this Modality encoding layer are n1, n2, …, nm respectively, then the total number of trainable parameters (TPUMINT) between the Input layer and the Modality encoding layer in the encoder network becomes
Considering an input of similar dimensions, if an AE network is employed to achieve this same task of integration, the number of trainable parameters (TPAE) between the input layer and the first hidden layer becomes
TPAE=∑i=1mdi∑i=1mni(10)Thus, the reduction in the number of trainable parameters (TPReduction) in the encoder network is given by
TPReduction=TPAE−TPUMINT=∑i=1mdi∑j=1,j≠imnj(11)A reduction in the number of trainable parameters by the same amount is also available at the Reconstruction layer of the decoder network. Hence, the total reduction (TPTotalReduction) in the number of trainable parameters in UMINT is given by
TPTotalReduction=2×TPReduction=2×∑i=1mdi∑j=1,j≠imnj(12)This is a massive improvement over AEs considering more than one modality of data to be integrated. UMINT network reduces to a regular AE network if a single modality is used which, however, does not serve the purpose of integration.
We have further recorded the execution time taken by both UMINT and the different variations of AE for integration of single cell multi-omics data. This experiment has been repeated multiple times with different training and test datasets to ensure stability of results. As shown in Figure 3, we have observed that integration using UMINT has been much faster as compared to that obtained using different AE-based networks, like a regular AE, DAE and SAE. Thus, we can say that UMINT not only has a light-weight architecture than AE-based networks, but it is also computationally less expensive than them.
FIGURE 3. Comparison of execution time taken for single cell multi-omics data integration by UMINT with that taken for integration by different variations of AE.
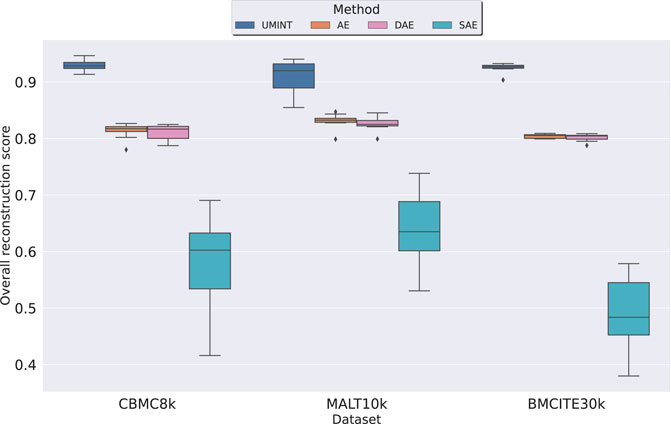
3.1.2 Comparison with autoencoder-based models with respect to performanceInitially, the performance of UMINT has been compared with that of a standard AE and its variations (DAE, SAE) with respect to their reconstruction capability and the strength of the latent low-dimensional embeddings produced at the bottleneck layer by each network. As mentioned earlier, RNA and protein expression data form the input to different modules of the Input Layer of UMINT which has then been used to reconstruct the input data. On a similar note, RNA and protein expression data have been stacked together to form the input to the AE-based networks. The AE-based networks reconstruct the combined input by passing it through a series of layers. In the process, they learn to extract useful features at the bottleneck layer, where a latent embedding of 64 dimensions is produced, similar to UMINT. The models UMINT, AE, DAE and SAE have been trained keeping all hyper-parameter values identical. For each modality, the amount of correlation between the original data and its reconstruction, has then been computed for UMINT and all the AE-based models using Pearson correlation coefficient. We have then defined an Overall Reconstruction Score (ORS) to assess the reconstruction performance of UMINT against that of the AE-based models, based on the omics modalities used for integration as follows
where ρi is the Pearson correlation coefficient value between the pairwise distances in the original ith data modality and the pairwise distances in its reconstructed counterpart. As shown in Figure 4, we have observed that UMINT has outperformed all the AE-based networks with respect to overall reconstruction of the omics modalities, for all the three datasets used for evaluation, with Median Correlation Coefficient (MCC) values and corresponding p-values as recorded in Supplementary Table S1. All the experiments have been repeated multiple times with different training and test datasets divided in a 80 : 20 ratio. The results of the test for statistical significance thus obtained, have made us infer that UMINT is capable of producing better overall reconstructions than AE-based methods.
FIGURE 4. Comparison of performance of UMINT with that of a regular AE, and its variations DAE and SAE with respect to overall reconstruction of RNA and ADT modalities in cbmc8k, MALT10k and bmcite30k datasets.
Thereafter, we have compared the latent low-dimensional embedding produced by UMINT with that produced by a standard AE and its variations. Once trained to create a lossy reconstruction of the input, the latent representation has been extracted from the bottleneck layer of UMINT and all AE-based models. Cell-type clustering on this latent embedding using k-means and agglomerative hierarchical clustering has been performed to validate the effectiveness of UMINT and compare it with AE-based models using ARI and FMI scores, as discussed earlier.
We have observed that for cbmc8k and bmcite30k datasets, the latent representation produced by UMINT has been more representative of the cell clusters when compared with that of AE-based methods. For MALT10k dataset, when hierarchical clustering algorithm is used, UMINT embedding has produced similar ARI and FMI scores to that obtained on embedding produced by AE-based methods. This is indicated by both ARI and FMI scores as shown in Figures 5A–D. Median ARI (MARI), Median FMI (MFMI) scores along with the corresponding p-values obtained using UMINT and the AE-based models on these three datasets for both hierarchical and k-means clustering algorithms have been shown in Supplementary Table S2. All the experiments have been repeated multiple times with different training and test datasets to ensure stability of the results.
FIGURE 5. Comparison of clustering performance of UMINT against that of AE-based methods when agglomerative hierarchical clustering is used, as measured by (A) ARI and (B) FMI; (C) and (D) show clustering performance of UMINT compared to AE-based methods, as measured by ARI and FMI respectively, when k-means clustering algorithm is used.
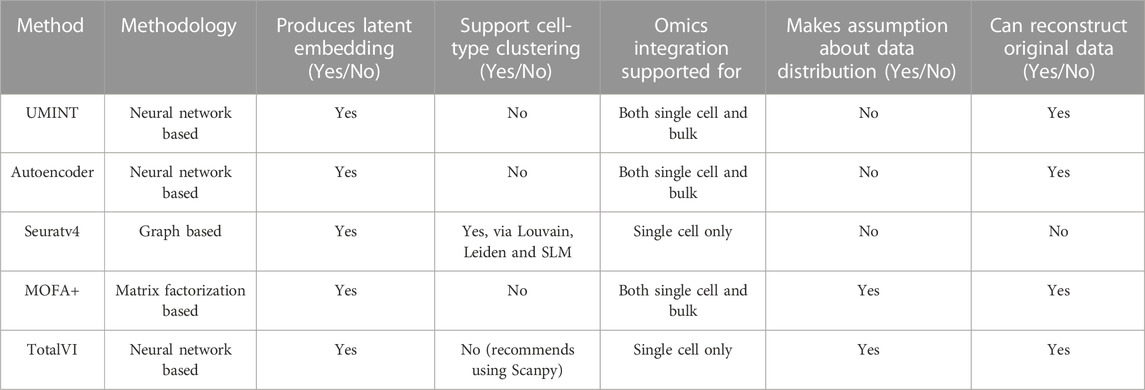
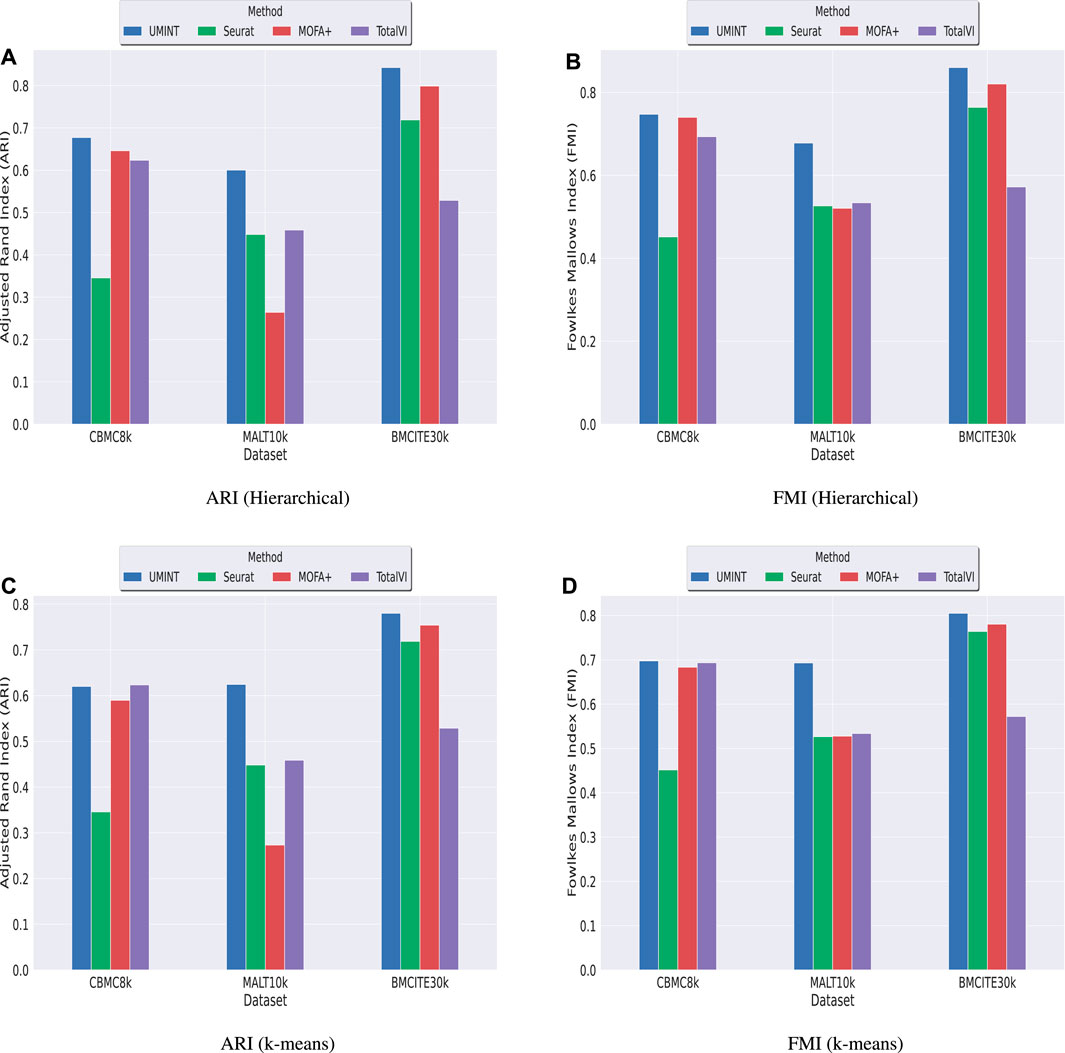
3.2 Comparison with other state-of-the-art methods for single cell multi-omics integrationSubsequently, we have compared the performance of UMINT with three other state-of-the-art methods - Seuratv4 (Hao et al., 2021), MOFA+ (Argelaguet et al., 2020) and TotalVI (Gayoso et al., 2021). We have chosen these three methods since they represent three different categories of algorithms - Graph based, Matrix factorization based and Neural network based, developed for single cell multi-omics integration (Stanojevic et al., 2022). To ensure a fair comparison between all these methods, we have followed the same preprocessing pipeline for all the datasets used for comparison. The effectiveness of UMINT has once again been demonstrated by clustering the cell-types on the latent low-dimensional embedding produced by it. It may be mentioned here that Seuratv4 is capable of producing an integrated low-dimensional representation through weighted-nearest neighbor analysis, and also find cell clusters from the integrated embedding using Louvain (Blondel et al., 2008), Leiden (Traag et al., 2019) or SLM (Waltman and Van Eck, 2013) community-detection algorithms. TotalVI, on the other hand, integrates the data through variational inferencing and autoencoding, and uses the standard Scanpy (Wolf et al., 2018) pipeline for clustering on the latent embedding. MOFA+, however, only produces a low-dimensional representation of the integrated data, as in the case of UMINT. The methods used in this work for comparison have been compared theoretically in Table 2. Thus, for Seuratv4 and TotalVI, we have extracted the cluster labels, while for MOFA+, we have extracted the factors representing the low-dimensional embedding and used hierarchical and k-means clustering on the same, similar to UMINT, as illustrated in the graphical abstract shown in Figure 1. Interestingly, UMINT has outperformed all three methods in terms of ARI and FMI scores, validated both by hierarchical and k-means clustering. Figure 6 shows the average ARI and FMI scores obtained using UMINT plotted against the scores obtained by the three benchmark methods.
TABLE 2. A theoretical comparison between UMINT and other methods used for comparison.
FIGURE 6. Comparison of clustering performance of UMINT against Seuratv4, MOFA+ and TotalVI when agglomerative hierarchical clustering is used, as measured by (A) ARI and (B) FMI; (C) and (D) show performance of each method, as measured by ARI and FMI respectively, when k-means algorithm is used for clustering.
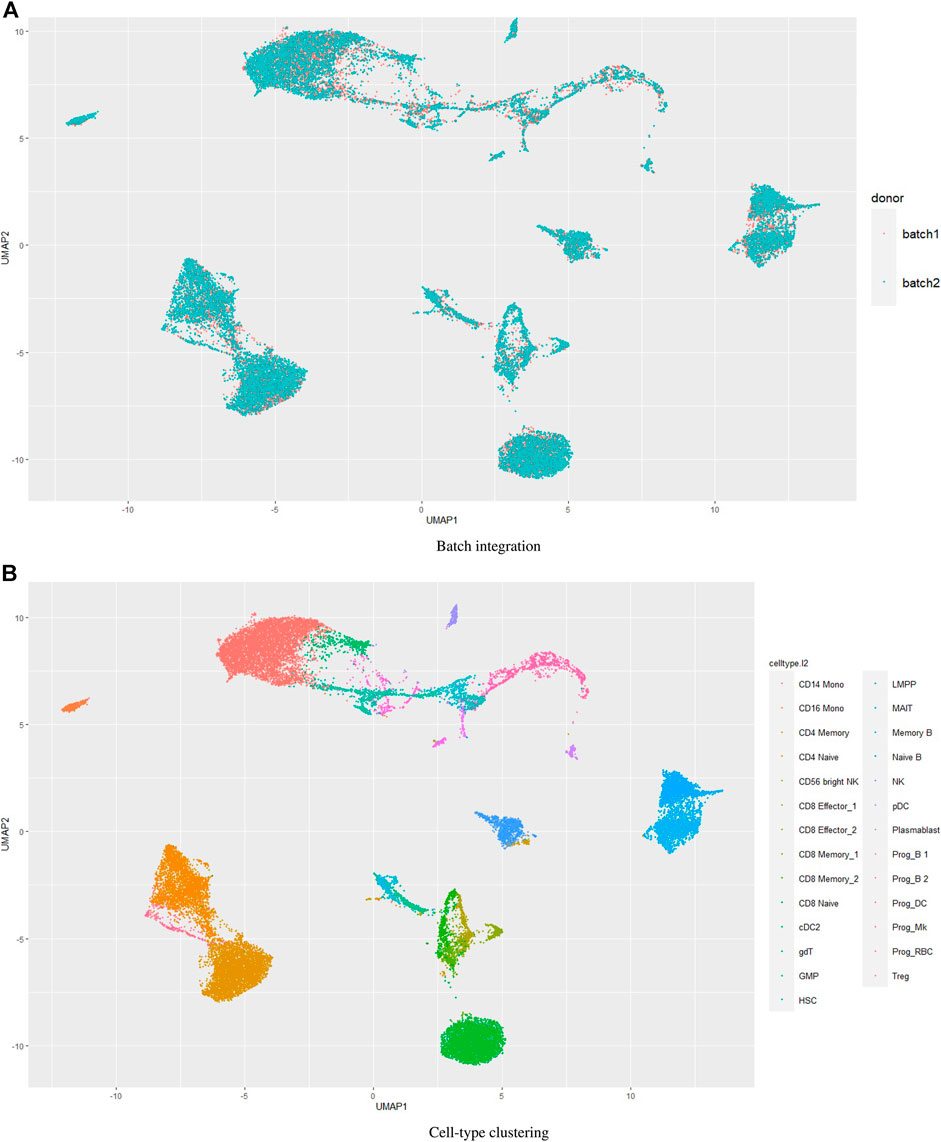
3.3 Performance of UMINT on multi-batch datasetsBatch effects in single cell datasets pose great challenges in data integration and compromises the results (Haghverdi et al., 2018; Tran et al., 2020). We wondered how UMINT would perform when there are batches in the data. The dataset bmcite30k used in this work contains two batches. However, we have not performed batch integration on this dataset. Figures 4–6 show the performance of UMINT on bmcite30k dataset when no batch integration has been performed. We have further observed that batches present in the bmcite30k projection by UMINT have been well integrated and are thus inseparable. Additionally, cell clusters obtained on UMINT projection are cohesive and well separated too. Thus, we can say that besides cell-type clustering, UMINT may have the potential to integrate batches in data efficiently, as shown in Figure 7. However, validation on a single dataset might not establish the strength of UMINT in terms of batch correction since the bmcite30k dataset itself may not have strong batch effects.
FIGURE 7. Performance of UMINT on bmcite30k dataset with respect to (A) batch integration, (B) cell-type clustering.
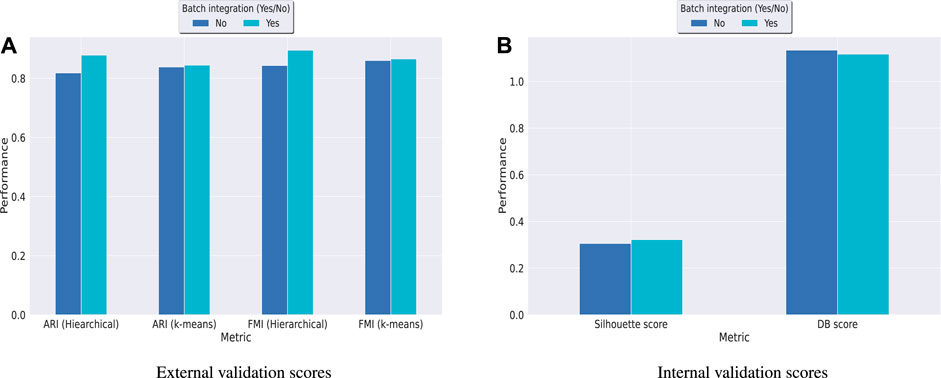
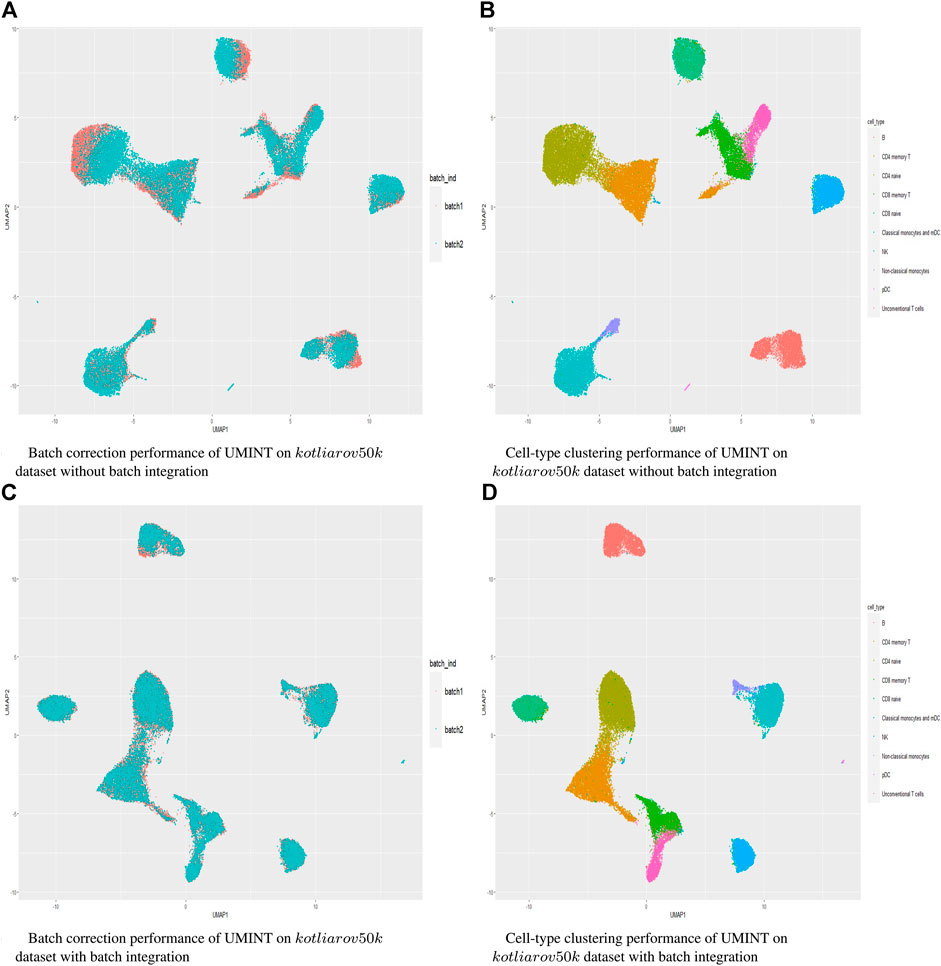
Hence, in order to reinforce our findings, we have performed a few more experiments on another dataset kotliarov50k. This dataset, collected from (Lotfollahi et al., 2022), contains filtered data for 52,117 cells with highly variable genes (3,999), and two batches of RNA and protein expressions each. Moreover, it contains expression values for 87 proteins, a lot more than the three other datasets used in this work. We have first integrated batches using Seuratv4 SCTransform () (Hao et al., 2021) module with default parameters and fed the batch integrated RNA and ADT datasets to UMINT. The low-dimensional embedding produced by UMINT has then been evaluated for clustering and batch integration performance. In another experiment, we have fed the preprocessed RNA and ADT datasets (without batch integration) into UMINT, and evaluated the low-dimensional embedding produced by it for clustering and batch integration performance too. Apart from two external validity indices, we have used two internal validity indices - silhouette coefficient (Rousseeuw, 1987) and Davies Bouldin (DB) index (Davies and Bouldin, 1979) to measure the clustering performance of the UMINT-generated embeddings on the omics data with and without batch integration. Interestingly, we have observed that when the UMINT embedding has been generated from the RNA and ADT data without batch integration, the ARI, FMI, Silhouette and DB scores achieved have been quite close to those achieved when UMINT embedding has been generated from batch integrated RNA and ADT data, as shown in Figure 8. Thus, it is clear that even without batch integration, UMINT can extract most relevant features from the data that can act as input to further downstream investigations. However, the UMINT-generated embedding obtained on batch integrated data has shown better batch correction performance than that obtained on data without batch integration. From Figures 9A, C, it can be observed that batches in kotliarov50k data remain separable if batch integration is not performed on the dataset explicitly. This explains why performance on kotliarov50k dataset without explicit batch correction is not as good as that on the same dataset with batch correction. Thus, there is further scope of improvement for UMINT in terms of batch correction performance. Figures 9B, D show cell-type clustering performance of UMINT on the kotliarov50k dataset, without and with batch integration respectively.
FIGURE 8. Clustering performance of UMINT-generated embeddings obtained from RNA and ADT data with and without batch integration on the kotliarov50k dataset as measured by (A) external validity indices and (B) internal validity indices.
FIGURE 9. (A) and (B) show batch correction and clustering performance of UMINT on the kotliarov50k dataset without batch integration; (C) and (D) show similar results on the kotliarov50k dataset with batch integration.
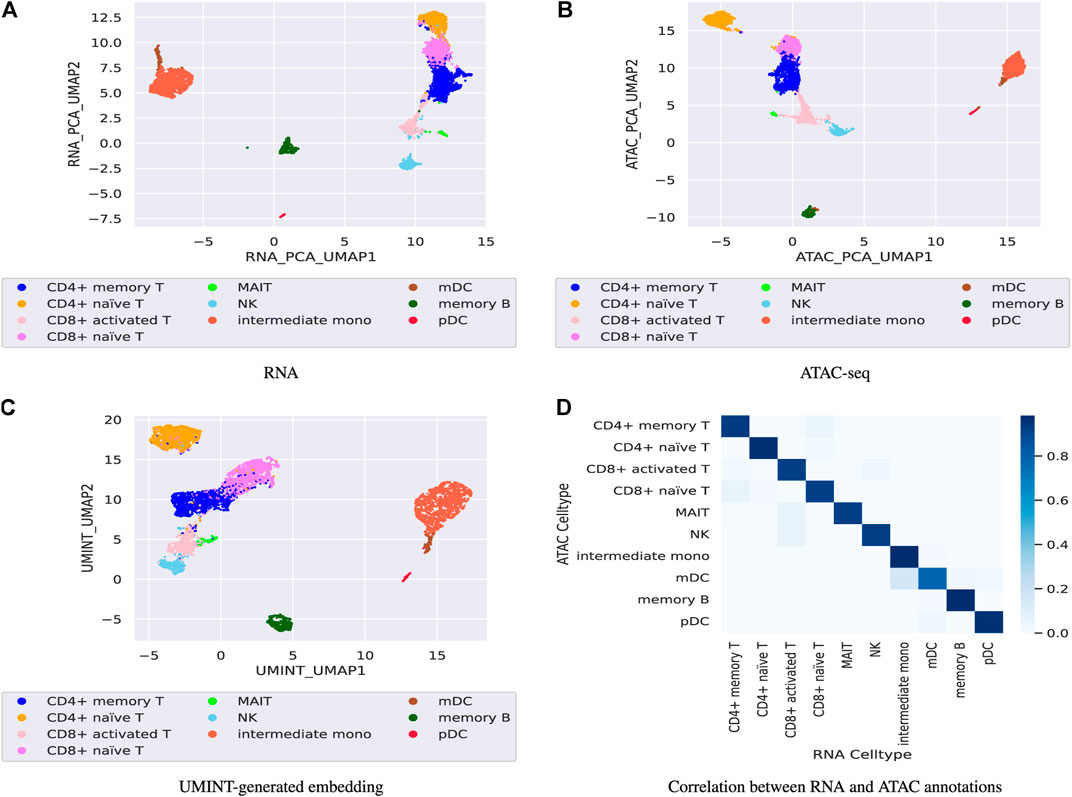
3.4 Performance of UMINT on paired RNA-seq and ATAC-seq dataFinally, the performance of UMINT has been assessed on another multiome dataset containing paired gene expression and ATAC-seq assays. This pbmc10k dataset has been first preprocessed via MUON (Bredikhin et al., 2022) and reduced to highly variable features only. These reduced datasets have been further processed to match the cells in the two modalities. The two paired assays, RNA and ATAC, have then been fed as input to UMINT, which has successfully extracted a latent low-dimensional embedding out of the integrated data. In order to validate the embedding quality, we have used both hierarchical and k-means clustering techniques on the UMINT-generated embedding and measured the clustering performance using ARI and FMI scores. The average scores over multiple runs of this experiment has been reported in Table 3, which shows that the UMINT-generated embedding has been pretty efficient in clustering the cell-types. The UMAP-projections on the individual modalities (after PCA-based dimension reduction) and on the embedding produced by UMINT have been illustrated in Figures 10A–C respectively. Cell-type annotation for the UMAP plot on the UMINT-generated embedding has been performed using the RNA-annotations since the ATAC annotations highly correlate to the RNA annotations as shown in Figure 10D. Thus, we can say that besides CITE-seq data, UMINT is competent enough to integrate paired RNA-seq and ATAC-seq assays too.
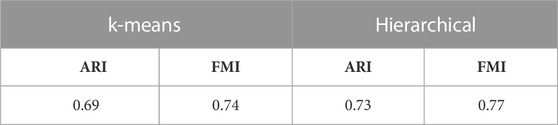
TABLE 3. ARI and FMI scores obtained on applying k-means and hierarchical clustering on the UMINT-generated latent embedding of pbmc10k multiome dataset.
FIGURE 10. Figures (A), (B) show UMAP projections on the individual RNA-seq and ATAC-seq data respectively after PCA-based dimension reduction while, Figure (C) show UMAP projection on the UMINT-generated latent embedding of pbmc10k multiome dataset. Figure (D) shows the correlation between the RNA and ATAC annotations.
3.5 Performance of UMINT on bulk multi-omics dataAs an extension to this work, in order to support the claim that UMINT can integrate a variable number of omics layers, we have further assessed UMINT for its integration performance on bulk expression datasets with more than two modalities. TCGA multi-omics data for Liver Hepatocellular Carcinoma (LIHC) from TCGA portal (now relocated to Genomic Data Commons https://gdc.cancer.gov/), have been used for this purpose. Pre-processed datasets have been collected from our earlier work (Seal et al., 2020) in which we tried to estimate gene expression surrogates from genetic and epigenetic features through a DL pipeline. This dataset contains three omics layers - DNA methylation (DNAm), Copy Number Variation (CNV) and RNA-seq. It contains 404 paired samples out of which 359 are cancer and 45 are normal. The procedures conducted in this separate experiment and their corresponding results have been described in Supplementary Section S2.
4 Discussion and conclusionIn this work, we have introduced a novel deep Unsupervised neural network for single cell Multi-omics INT
留言 (0)