
記住我
Among malignancies, breast cancer has been a significant cause of tumor-related deaths around the world.1 Although the recurrence rate of early-stage breast cancer has gradually decreased with improved treatment, nearly 30% of patients with primary breast cancer still progress to incurable metastatic breast cancer in 10 years, according to our own database.2
Immune checkpoint inhibitors (ICIs) (ie, programmed death-ligand 1 (PD-L1) or cytotoxic T-lymphocyte antigen 4) bring new promise in cancer treatment by their ability to improve overall survival among patients, especially those with metastatic or locally advanced breast cancer (ABC).3–6 Given the near doubling survival benefit of ICIs for some patients with metastatic triple-negative breast cancer (TNBC), ICIs is being widely explored in several clinical studies for different stages of breast cancer, and even is recommended in neoadjuvant setting of high-risk TNBC in order to improve the cure rate. However, it is worth noting that ICIs therapy is only beneficial to a small proportion of patients with breast cancer (20% to 40%), and also has non-negligible toxicity and even a 0.2% to 0.3% risk of treatment-related death. Therefore, it is of great clinical value to precisely target the beneficiary population of ICIs.
Although previous studies suggest that some biomarkers such as PD-L1,4 tumor mutation burden (TMB),6 stromal tumor infiltrating lymphocytes (TILs),7 and microsatellite instability/defective mismatch repair (MSI/dMMR) can predict the population of immunotherapy benefit, invasive biopsies were needed to acquire these biomarkers and the accuracy are not ideal. Hence, it is important to explore innovative methods for more accurate and non-invasive prediction of their efficacy.
One of the non-invasive prediction modalities is to integrate the use of radiomics analysis. Since biomedical images could reflect the cellular and molecular properties of tissues, the radiomics could be used to analyze and translate medical images into quantitative data.8 The quantitative imaging features could be extracted by machine learning in a high-throughput manner and further adopted to evaluate tumor microenvironment (TME) and heterogeneity.9 Radiomics-based biomarkers have made achievements in auxiliary diagnosis and prognosis assessment recently, encouraging studies have been reported on the potential utility of radiomics for predicting response to ICIs in lung cancer and melanoma.10–12 The non-invasive property and reliability of radiomics provide us with an innovative method to predict immunotherapy response. However, no radiomic biomarkers have been reported in predicting the response of ICIs-based therapies in breast cancer so far.
In view of this, this multicentered study was conducted to develop a machine learning based radiomics model that could accurately predict immunotherapy benefit and optimize treatment decisions for patients with ABC.
MethodStudy designIn this study, a total of 240 patients with ABC who received ICIs-based therapy in three academic medical centers, as Sun Yat-sen Memorial Hospital (SYSMH), Sun Yat-sen University Cancer Center (SYSUCC), and the First Affiliated Hospital of Sun Yat-sen University (FAHSYSU), from February 2018 to January 2022 were retrospectively analyzed. To improve data quality and model robustness, 61 of these patients were recruited from two phase II prospective clinical studies (NCT03394287 and NCT04303741),13 14 which were designed to explore the efficacy and safety of anti-programmed cell death protein-1 (PD-1) monoclonal camrelizumab plus anti-angiogenic therapy apatinib with or without chemotherapy in advanced TNBC. One study (NCT03394287) investigated the efficacy and safety of chemotherapy-free regimens ‘camrelizumab in combination with apatinib’ in the front-line (1–3 lines) treatment of advanced TNBC, showing an objective response rate (ORR) of 43.3%. The other study (NCT04303741) investigated the efficacy and safety of eribulin in combination with camrelizumab and apatinib in the second or later line treatment of advanced TNBC, which showed that the combination regimen still achieved an ORR of 37.0% and a median progression-free survival (PFS) of 8.1 m in these heavily pretreated patients with TNBC. The other 179 patients were enrolled from a multicentered retrospective database of patients with ABC receiving anti-PD-1 antibodies in combination with chemotherapy±anti-human epidermal growth factor receptor 2 (HER2) treatment±antiangiogenic therapy. These 240 patients were further divided into a training cohort and an independent validation cohort according to need. In order to better reflect the balance of multicentered data and the principle of random data assignment, we randomly divided the patients with breast cancer from SYSUCC, the medical center with the largest sample size, into two groups. Then, 50% of the patients from SYSUCC together with the patients from SYSMH, totaling 171, were established as the training cohort, and the other 50% of the patients of SYSMH together with the patients from FAHSYSU, totaling 69, were established as the validation cohort (table 1, figure 1).
Table 1Demographics and clinicopathologic characteristics of the training cohort and the testing cohort
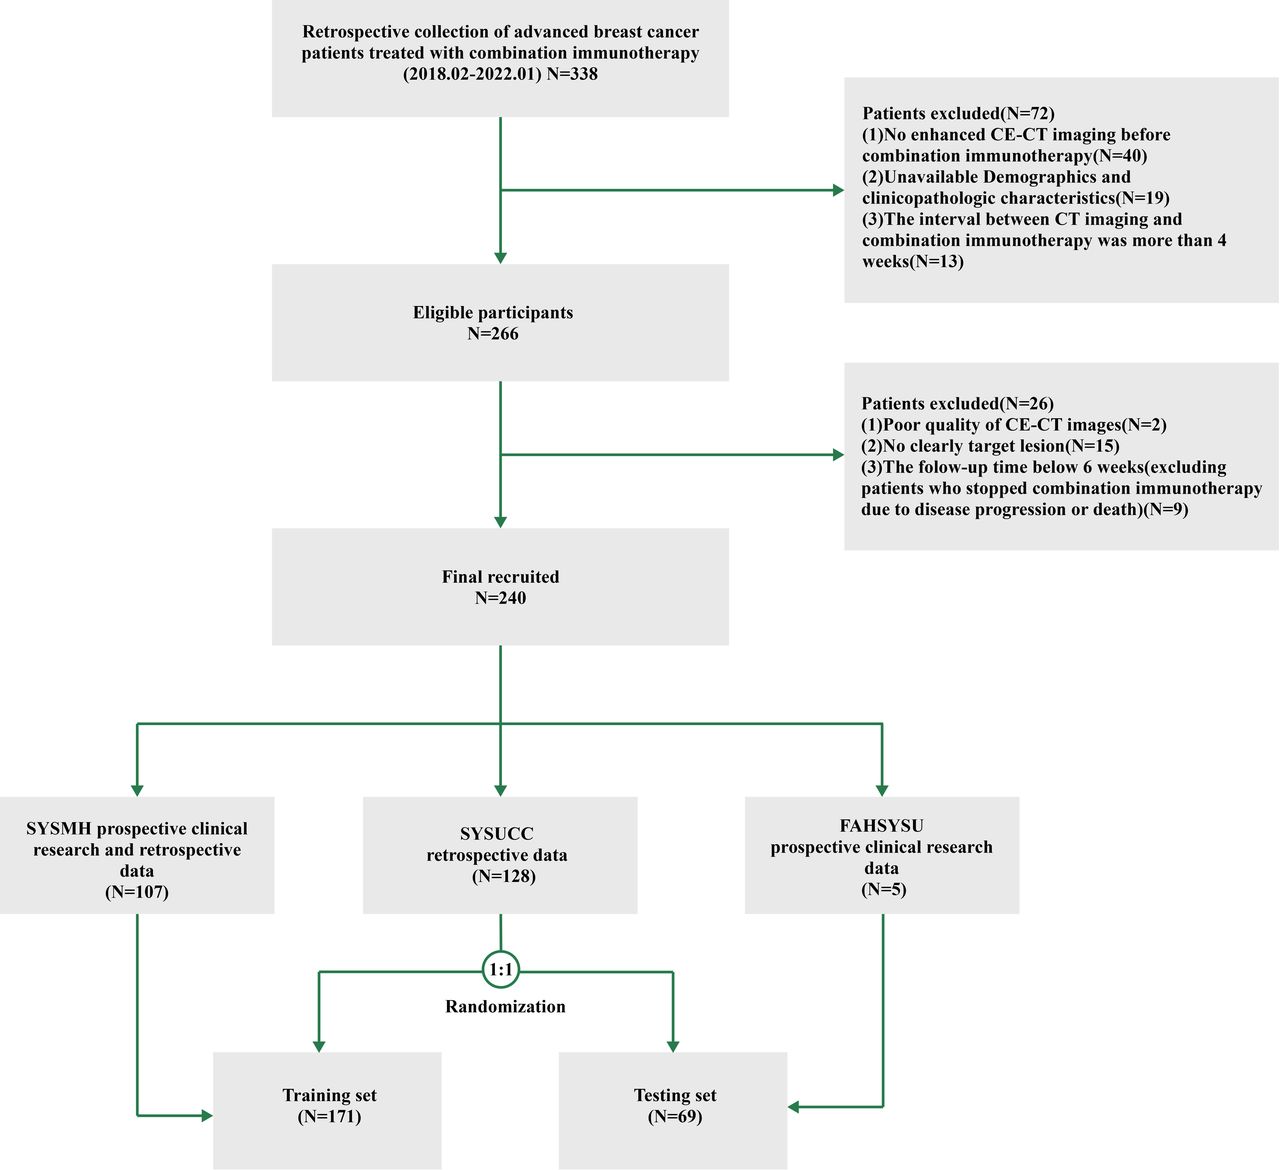 Figure 1
 Flow chart of the study. Patients from Sun Yat-sen Memorial Hospital (SYSMH) prospective clinical trials and retrospective clinical trials and half of the patients from Sun Yat-sen University Cancer Center (SYSUCC) as the training set (128 patients from SYSUCC were randomized 1:1 into two groups). The First Affiliated Hospital of Sun Yat-sen University (FAHSYSU) prospective clinical trials and the other half of the SYSUCC retrospective data as the validation set. The ratio of training set and validation set is about 5:2. CECT, contrast-enhanced CT.
The inclusion criteria were (1) patients with pathologically proven ABC, (2) patients who received ICIs-based therapies and (3) patients who underwent CT scan within 1 month before ICIs-based treatment. Exclusion criteria were (1) patient lacks measurable lesions according to RECIST V.1.1 criteria; (2) samples of poor-quality or inadequate, and (3) incomplete data on baseline clinicopathological features or follow-up data (online supplemental appendix S1). This study’s primary outcome was response to immunological combination treatment as measured by RECIST V.1.1 criteria,15 with definition of complete response (CR), partial response (PR), stable disease (SD), and progressive disease (PD). In this study, patients with PR and CR were categorized as ‘responsive’, whereas patients with SD and PD were categorized as ‘non-responsive’.
Clinicopathological dataPatients’ clinicopathological information was acquired from the hospital information system at each study center. Clinical information includes patients’ age, body mass index (BMI), menopausal status, prior treatment history, combination regimen with ICIs, lines of previous therapy in the context of metastatic disease, hematologic indicators, blood biochemical indices, and tumor metastatic burden. Pathological information included tumor pathological type, (estrogen receptor progesterone receptor and HER2 status), Ki67 proliferation index, and PD-L1 expression status.
In this work, PD-L1 expression was assessed using the Combined Positive Score (CPS), which has been used in previous study.3 According to this protocol, CPS was defined as the number of PD-L1+ cells regardless of cell types (including tumor cells, lymphocytes, and macrophages) divided by the total number of tumor cells, then further multiplied by 100. PD-L1 positivity was defined as ≥10 of CPS. Quantitative and qualitative PD-L1 staining was conducted using the DAKO Link 48 platform and the Food and Drug Administration-approved DAKO 22C3 antibody.
CT imaging data acquisitionPatients underwent contrast- enhanced CT (CECT) examinations within 1 month prior to immunotherapy. The CT images were exported in DICOM format through image archiving and communication system (PACS) retrieval in the radiology department of each center. Patients were scanned with multi-slice spiral CT (GE Medical Systems, Siemens, Philips, Toshiba, United Imaging Healthcare, etc) of the neck, chest and abdomen. The majority of CECT scans tube voltage were 120 KeV, with automatic tube current modulation technique. Reconstruction using standard convolution kernel with 1.25 mm layer thickness (median 1.25 mm; range 1.0–2.0 mm). Each CT image is reconstructed in a 512×512 pixels image matrix. To eliminate image differences between images acquired by different CT instruments, all CT images were first resampled to the same image spacing of 1 mm × 1 mm × 1 mm using cubic spline interpolation to standardize the pixel size.16 The details information of CT scan parameters is provided in supplementary material (online supplemental table S1).
Tumor segmentation and image feature data extractionThe lesions of the patients were segmented in accordance with RECIST V.1.1 criteria. We defined criteria for the segmentation of several targets in ABC, selecting two maximum two-dimensional diameter visceral metastases, bone metastases soft tissue lesions or lymph node target lesions. With no more than two target lesions per organ or site, distinct sites are prioritized for tumor segmentation, beginning with visceral metastatic lesions.
Two experienced radiologists (Xiaohui Duan and Zhuo Wu, both of whom are senior doctors in the radiology department with over 10 years of professional experience) independently viewed and segmented the above image using 3D slicer (V.4.11, https://www.slicer.org). In the event of any inconsistencies, a third senior radiologist consulted with both investigators and made the necessary adjustments.
The CT image features were extracted by radiomics extension module in 3D slicer,17 18 including four aspects of intensity features, shape features, texture features, and image filtering features, with a total of 1130 features. The initial features consist of 107 original features, 279 LoG (Laplacian of Gaussian) features, and 744 wavelet features. The original features include 14 shape features, 18 histogram features and 75 texture features. Among the texture features, 24 Gray Level Co-occurrence Matrix (GLCM) texture features, 16 Gray Level Run Length Matrix (GLRLM) texture features, 16 Gray Level Size Zone Matrix (GLSZM) texture features, 14 Gray Level Difference Matrix (GLDM) texture features, and 5 Neighborhood Gray-tone Difference Matrix (NGTDM) texture features. LoG features and wavelet features consist of histogram features and texture features. The LoG filter with 1/2/3 kernel sizes is used to extract features, and the configured wavelet filter is used to calculate wavelet features. In the end, eight subwaves were decomposed in each layer, and the wavelet and LoG transforms yielded 744 wavelet features and 279 LoG features, respectively (online supplemental table S2).
Model construction and performance evaluationClinicopathological factors with statistical differences (p<0.05) in univariate and multifactorial analyses were used to construct clinicopathological models using logistic regression (LR). Multilayer perceptron (MLP)19 was used to analyze imaging features using three hidden layer networks to construct imaging histology feature models. In the integrated model construction, the imaging features were imported in input layer 1, and after three layers of network, they were added to the fourth layer of network together with the clinical features in input layer 2 (figure 2). The receiver operating characteristic (ROC) curve, the area under the curve (AUC), positive predictive value and negative predictive value were analyzed to evaluate the accuracy of this radiomics model, and decision curve analysis (DCA) and clinical imaging curve (CIC) are applied to assess the net benefit.
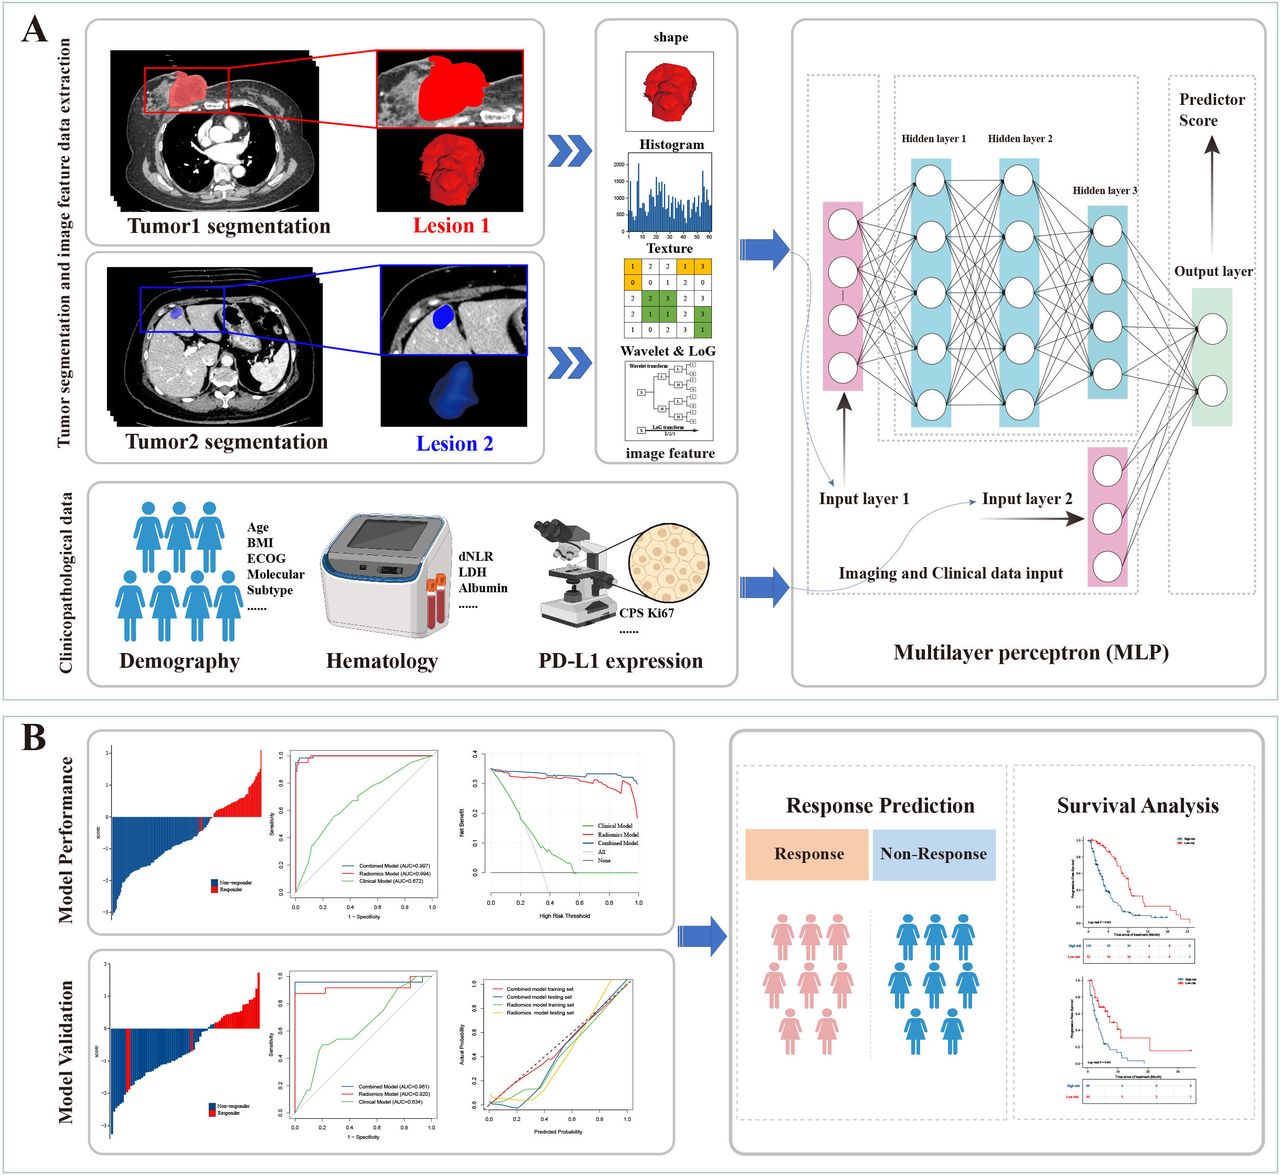 Figure 2
 Radiomics workflow (A) The workflow includes data collection, design of the study, ROI delineation, image feature extraction and machine learning model construction. (B) Model performance evaluation and validation. AUC, area under the curve; BMI, body mass index; CPS, Combined Positive Score; ECOG, Eastern Cooperative Oncology Group; dNLR, derived neutrophil-to-lymphocyte ratio; LDH, lactate dehydrogenase; LoG, Laplacian of Gaussian; ROI, region of interest; PD-L1, programmed death-ligand 1.
Survival analysisRisk ratings developed by classification models employing machine learning were used to predict the prognosis of patients with ABC. We based the scores of the clinical model and the deep histological model on log-rank tests to find the optimal cut-off value based on the data on both sides of a point. The optimal cut-off value was used to separate patients into low-risk and high-risk categories. We used Kaplan-Meier (KM) curves to measure PFS, along with the C statistic and risk ratio (HR) to determine the score’s impact on PFS.
Statistical analysisThe MLP was built using Python V.3.7.7. Statistical data were analyzed in this study using R software (V.4.2.0, http://www.R-project.org) (R packages is detailed on page 1 of online supplemental file 1) and SPSS V.25.0 software (IBM SPSS V.25.0, Chicago, USA). In the analysis of baseline patient characteristics, independent t-tests and Wilcoxon rank-sum tests were used for continuous variables, and Pearson χ2 tests or Fisher’s exact tests were used for categorical variables. The performance of the categorical model was assessed through AUC calculation; and the corresponding 95% CI under ROC the differences were compared between AUCs by DeLong test. As for the survival analysis, we used a log-rank test to compare the differences between KM curves. A two-sided p value<0.05 was considered to be statistically significant.
ResultClinical characteristicsIn this study, a total of 240 patients (171 patients in the training cohort, 69 patients in the external validation cohort) were retrospectively enrolled (figure 1). There were no statistical significant differences in the baseline characteristics between the training and validation cohort (table 1). Triple-negative disease was present in 75.8% of the enrolled patients. About half of the patients (56.7%) had visceral metastasis or more than three metastatic lesions. All patients underwent anti-PD-1 antibodies-based treatment. Combinatorial therapy of ICIs with chemotherapy were used in 49.1% (84/171) of patients in the training cohort, and 62.3% (43/69) of patients in the validation cohort, respectively. ICIs combined with anti-angiogenesis±chemotherapy were used in 50.9% (87/171) of patients in the training cohort, and 37.7% (26/69) of patients in the validation cohort, respectively. The above variables are equally distributed in the training and validation cohorts, and there is no statistically significant difference between these two cohorts.
Among the 240 patients, 6.7% patients (n=16) showed CR, 28.7% patients (n=69) showed PR, 42.1% patients (n=101) showed SD, and the rest of patients presented PD (n=54, 22.5%) (online supplemental figure S1). The overall disease control rate (DCR) was calculated at 77.5% (186 of 240). Immunotherapy-benefit was associated with lines of previous therapy in the context of metastatic disease (p=0.020), visceral metastasis status (p=0.016) and tumor metastasis burden (p=0.001) in the training cohort. No significant difference was detected in terms of age, BMI, menopausal status, molecular subtype, CPS, and immunotherapy regimen (p>0.05) between patients who responded to immunotherapy or otherwise. Multivariable LR analysis further revealed that lines of previous therapy (OR=0.35, 95% CI: 0.16 to 0.77, p=0.009) and tumor metastasis burden (OR=0.42, 95% CI: 0.18 to 0.99, p=0.047) were both significant predictors of immunotherapy-benefit in the training cohort (online supplemental figure S2). Hence, combined these two factors with visceral metastasis status and molecular subtype, the clinical model was constructed as a baseline. However, the performance of clinical model in predicting immunotherapy response status was unsatisfactory, with AUC values of 0.672 (95% CI: 0.588 to 0.756), and 0.634 (95% CI: 0.495 to 0.772) in the training cohort and validation cohort (figure 3E,F, table 2). Furthermore, the inclusion of PD-L1 status (CPS score) did not significantly improve the accuracy of clinical model (online supplemental figure S3 and table S3).
Table 2Performance of predict models for predicting efficacy of combined immunotherapy in patients with advanced breast cancer
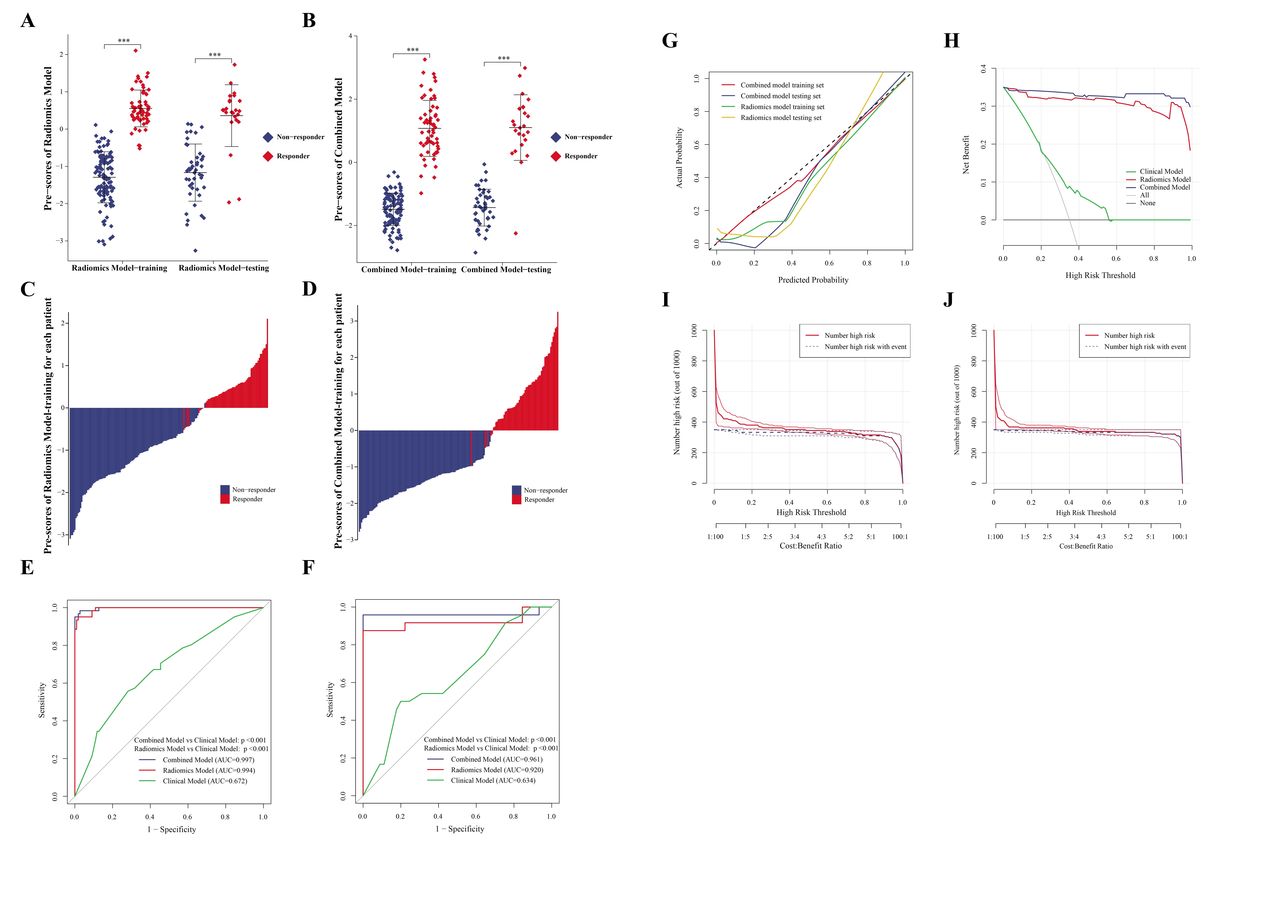 Figure 3
 Performance of the predict models in training and validation sets. (A and B) Distribution of predictive score of radiomics and combined models among responders and non-responders in training set and testing set. The *** represents, p<0.001. (C) Waterfall of prediction score distribution between non-responders and responders in the training set of the radiomics model. (D) Waterfall of prediction score distribution between non-responders and responders in the training set of the combined model. (E and F) Receiver operating characteristic analysis of predict models for predicting response status in the training set and validation set, respectively. (G) The calibration curve of radiomics and combined models in the training cohort and validation cohort. (H) Decision curve analysis for the combined model (blue), image model (red) and clinical model (green) in the training set; the y-axis indicates the net benefit; x-axis indicates threshold probability. The gray line represents the assumption that all patients were responders. The black line represents the hypothesis that no patients were responders. (I and J) CIC showed the estimated number of image models that would be declared high risk for each risk threshold and the proportion of true positive patients, I represents the radiomics model training set CIC, J represents the combined model training set CIC. AUC, area under the curve; CIC, clinical imaging curve.
Selection of radiomics feature and establishment of prediction modelAfter combining all extracted radiomics features, we used a MLP algorithm to select the features that are most closely correlated with immunotherapy-response in the training cohort. The following nine category of radiomics features were finally selected: Original_Shape, Original_First Order Histogram Features, Original_GLCM, Original_GLDM, Original_GLRLM, Original_GLSZM, Original_NGTDM, Wavelet transform, and LoG transform. The specific image features encapsulated in each category were listed in online supplemental table S2. Then, the radiomic features were used to build a model to predict the immunotherapy response. The immunotherapy response status of patients with ABC predicted by the radiomics model was in good agreement with the actual clinical immunotherapy response status in both training and validation cohorts (figure 3A,C). Furthermore, the radiomics model also obtained a high accuracy with an AUC of 0.994 (95% CI: 0.988 to 1.000) in the training cohort, and 0.920 (95% CI: 0.824 to 1.000) in the validation cohort, respectively (figure 3E,F, table 2). The calibration curves of the radiomics model showed good agreements between the model prediction and actual observation in the training cohort and validation cohort, respectively (figure 3G). DCA indicated that the highest overall net benefit was achieved in the radiomics model compared with the clinical model (figure 3H). The CIC showed that the radiomics model could target the immunotherapy response population accurately (figure 3I).
Furthermore, we integrated the clinical features into the radiomics model to develop a clinical-radiomics model in order to obtain better prediction performance. Interestingly, the clinical-radiomics model did not achieve significant improvement compared with the radiomics model, with AUCs of 0.997 (95% CI: 0.993 to 1.000) and 0.961 (95% CI: 0.885 to 1.000) in training and validation sets, respectively (figure 3B, D, E and F, table 2). The calibration curves, DCA and CIC analysis showed similar agreement between radiomics model and the clinical-radiomics model, as well (figure 3G, H and J).
The prediction accuracy of the radiomics model and the clinical-radiomics model were both better than the clinical model (figure 4A,B, online supplemental table S4). Additionally, 108 of 110 (98.2%) patients with non-response in the training cohort, and 45 of 45 (100%) patients with non-response in the validation cohort were successfully identified by the radiomics model. Meanwhile, 58 of 61 (95.1%) patients with response in training cohort, and 21 of 24 (87.5%) patients with response in validation cohort were successfully identified by the radiomics model (figure 4C, table 2). Moreover, 107 of 110 (97.3%) patients with non-response in the training cohort, and 45 of 45 (100%) patients with non-response in the validation cohort were also identified by the clinical-radiomics model successfully. Meanwhile, 60 of 61 (98.4%) patients with response in training cohort, and 23 of 24 (95.8%) patients with response in validation cohort were successfully identified by the clinical-radiomics model (figure 4D, table 2).
 Figure 4
 Comparison of prediction capabilities of various models. (A) Violin plot of predict models for non-responders and responders in the training set. The *** represents, p<0.001. (B) Violin plot of predict models for non-responders and responders in the validation set. The ns represents, p>0.05; the *** represents, p<0.001. (C) The number of events of true positive, false negative, true negative, and false positive for the radiomics model in the training cohort and external validation cohorts. (D) The number of events of true positive, false negative, true negative, and false positive for the combined model in the training cohort and external validation cohorts.
The radiomics model was capable of dividing patients into two risk cohorts with significantly different PFS both in training set and validation set, with HR of 2.705 (cut-off point=0.209, 95% CI: 1.888 to 3.876, p<0.001, figure 5A) and 2.625 (cut-off point=−0.424, 95% CI: 1.506 to 4.574, p=0.001, figure 5B), respectively (online supplemental table S5). Moreover, the median PFS in the low-risk group was more than twice as much as that in the high-risk group (10.12 m vs 3.75 m for the training set, and 7.26 m vs 3.02 m for the validation set, (online supplemental table S6). Similarly, the clinical-radiomics model was also capable to distinguish the better PFS for the low-risk patients with an HR of 2.464 (cut-off point=−0.086, 95% CI: 1.720 to 3.529, p<0.001, figure 5C) in the training cohort, and 2.564 (cut-off point=−0.857, 95% CI: 1.469 to 4.475, p=0.001, figure 5D) in the validation cohort, respectively (online supplemental table S5).
 Figure 5
 The prognostic value of the radiomics model and combined model in immunotherapy. (A) The Kaplan-Meier curves of the radiomics model depict PFS in high-risk and low-risk groups for training sets. (B)The Kaplan-Meier curves of the radiomics model depict PFS in high-risk and low-risk groups for validation sets. (C) The Kaplan-Meier curves of the combined model depict PFS in high-risk and low-risk groups for training sets. (D) The Kaplan-Meier curves of the combined model depict PFS in high-risk and low-risk groups for validation sets. PFS, progression-free survival.
Then, we conducted subgroup analyses based on PD-L1 status (CPS score), prior regimens, molecular subtype, tumor metastatic burden and immunotherapy regimens. The radiomics model achieved a good performance both in CPS-high and CPS-low groups, with AUC values of 1.000 (CPS-high) and 0.996 (CPS-low) in the training cohort, and 0.778 (CPS-high) and 1.000 (CPS-low) in the validation cohort (DeLong test p=0.305), respectively (figure 6A, online supplemental table S7). We also conducted a subgroup analysis based on the molecular subtype of these patients with breast cancer. Prediction within TNBC and non-TNBC subgroups all performed well, with AUC values of 0.997 (TNBC), and 0.994 (non-TNBC) in the training cohort, and 0.910 (TNBC), and 0.988 (non-TNBC) in the validation cohort (figure 6B, online supplemental table S8). The performances of the radiomics model in the different subgroups of lines of previous therapy, tumor metastatic burden and combined immunotherapy regimens, were similar, too (figure 6C–F, online supplemental tables S9–S12). The immunotherapy regimens with or without antiangiogenic therapy did not affect the accuracy of the radiomics model, as well (figure 6F, online supplemental table S12). The performance of the clinical-radiomics model was not influenced by PD-L1 status, tumor metastatic burden or molecular subtype, as well (online supplemental figure S4 and tables S7–S12).
 Figure 6
 Subgroup analysis of the radiomics model in the training and validation set. (A) AUC of subgroup analysis stratified by comprehensive positive score (CPS <10 vs CPS ≥10) in the training and validation cohorts. (B) AUC of subgroup analysis stratified by molecular subgroups (TNBC vs non-TNBC) in the training and validation cohorts. (C) AUC of subgroup analysis stratified by number of lines of previous therapy in the context of metastatic disease in the training and validation cohorts. (D) AUC of subgroup analysis stratified by visceral metastasis in the training and validation cohorts. (E) AUC of subgroup analysis stratified by number of metastatic sites in the training and validation cohorts. (F) AUC of subgroup analysis stratified by combined immunotherapy regimen (with or without antiangiogenic therapy) in the training and validation cohorts. AUC, area under the curve; CPS, Combined Positive Score; TNBC, triple-negative breast cancer.
DiscussionImmunotherapy, especially anti-PD-1/PD-L1 antibodies, brings ‘breakthrough’ improvements in treatments for patients with ABC,13 14 but only a minority of patients can benefit from immunotherapy. How to accurately and non-invasively locate these immunotherapy-benefit-population is the current leading challenge in the field. In this study, we developed the first radiomics model for immunotherapy response prediction specifically for patients with ABC. And this non-invasive prediction model performed effectively both in the training and validation cohort with AUC of 0.994 and 0.920, respectively. Moreover, the accuracy of the radiomics model was not influenced by PD-L1 status, tumor metastatic burden, molecular subtype or combined regimens. This radiomics model provided an innovative, accurate and robust approach to stratify patients with ABC who may benefit from ICIs-based therapies and aid the personalized decision in the treatment of ABC.
Although previous studies suggest that some biomarkers such as PD-L1, TMB, TILs, and MSI/dMMR can predict response of ICIs-based therapies in ABC,4–7 all these biomarkers assessment requires multiple tumor sampling, invasive tissue biopsy, high associated costs, and unsatisfactory accuracy, which limit their clinical applications. Therefore, development of a non-invasive prediction model of immunotherapy response is required. In our study, several imaging features showed association with ICIs response of patients with ABC, and these correlations indicated that radiomics features may be used to develop a non-invasive model to predict immunotherapy benefits in ABC.
To our knowledge, this is the first study to apply radiomics to infer clinical outcomes of patients with ABC with immunotherapy treatment. Previous studies have explored radiomics as a biomarker of immune status, or immunotherapy-prediction value among patients with lung cancer or melanoma, but no patients with breast cancer were included in these studies. Su et al established a TILs prediction radiomics model by retrospectively analyzing the preoperative dynamic contrast enhanced MRI (DEC-MRI), transcriptomics data and postoperative TILs data of 139 patients with TNBC, and found that high Rad-TILs tumors was characterized with enriched immune-related pathways, hot immune microenvironment and relatively inflammatory TME.20 This is an important work to explore radiomics and immune biomarkers in patients with breast cancer. Unfortunately, patients with breast cancer in this study did not receive immunotherapy, so the immune efficacy of patients could only be inferred indirectly through TILs. Coincidentally, He et al also explored associations between radiomic model and TMB, another immune biomarker, through CT images of 327 patients with lung cancer. The radiomic model was validated in 123 patients with non-small cell lung cancer with ICIs treatment and was able to successfully distinguish high-risk patients from low-risk patients.21 However, since the radiomics model was established based on TMB, it was not a direct prediction of immunotherapy response, and the results should be interpreted with caution. Sun et al developed a radiomics signature to predict CD8 cell tumor infiltration by CT images and RNA sequencing data of patients with advanced solid tumors. The radiomic signature was further used to predict the immunotherapy response of 137 patients with advanced solid tumors (only 17 patients with breast cancer involved).22 Notably, the study did not construct a predictive model for immunotherapy response and included very few patients with breast cancer. As a ‘cold’ tumor, breast cancer has a lower sensitive population to immunotherapy compared with lung cancer or melanoma. Therefore, the development of a predictive model for immunotherapy response in breast cancer by non-invasive imaging means is of great clinical value.
Regarding the clinical applicability, the radiomics model has the potential to assist the decision of ICIs-based therapies for patients with ABC. In the training cohort, of the 61 patients who were sensitive to immunotherapy, 58 patients (95.1%) were successfully identified by the radiomics model. While, of the 110 patients who were resistant to immunotherapy in this study, 108 patients (98.2%) were accurately identified by the radiomics model. Likewise, in the validation cohort, of the 24 patients who were sensitive to immunotherapy, 21 patients (87.5%) were successfully identified by the radiomics model. While, of the 45 patients who were resistant to immunotherapy in this study, 45 patients (100%) were accurately identified by the radiomics model. Thus, the radiomics model allowed 98.2% to 100% of patients to avoid immunotherapy-related toxicity and 87.5% to 95.1% of patients to receive immunotherapy accurately. This radiomics model may increase the precision of immunotherapy and enhance personalized decision in the treatment of ABC.
Furthermore, our study included the largest population of patients with breast cancer treated with immunotherapy at present. Two hundred and forty patients with ABC from three different academic hospitals were recruited for development and validation of our radiomics model. Among which, 61 patients were enrolled from two prospective clinical trials, which showed promising efficacy of anti-PD-1 antibody in combination with vascular endothelial growth factor receptor 2 (VEGFR2) tyrosine kinase inhibitors (TKI)±eribulin chemotherapy in treating advanced TNBC, regardless of PD-L1 status.13 14 The characteristics of large sample size, multicentered patient recruitment and partial population from prospective trials greatly improved the data quality and reliability of this study, and are conducive to building a more precise and robust prediction model. The accuracy of the radiomics model was not influenced by PD-L1 status, tumor metastatic burden or molecular subtype. Therefore, this radiomics model could be used as a useful aid to assist clinicians make rational decisions on immunotherapy, so as to improve the benefits of immunotherapy for patients with breast cancer and avoid unnecessary adverse effects.
Our study had several limitations that should be acknowledged. First, the heterogeneity of the data from multicenter, especially for imaging parameters, could affect radiomics features, even though we have made some efforts to weaken this effect (all CT images were first resampled to the same image spacing using cubic spline interpolation to standardize the pixel size to eliminate image differences between images acquired by different CT instruments; MLP was used to analyze imaging features using three hidden layer networks to construct imaging histology feature models). Second, recent studies indicated that several specific gene mutations (such as TP53, MDM2, MDM3, STK11, among others) could affect the efficacy of immunotherapy. Due to lack of genomic sequencing data, we were unable to compare the predictive accuracy of the radiomics model with these immune-associated gene mutation scenarios.
In conclusion, our study suggests that this radiomics model could be an efficient, non-invasive, cost-effective, and reliable way to predict patients with ABC’s responses to ICIs-based therapies. Our findings still need to be confirmed by large-scale prospective studies in the future.
留言 (0)