
記住我
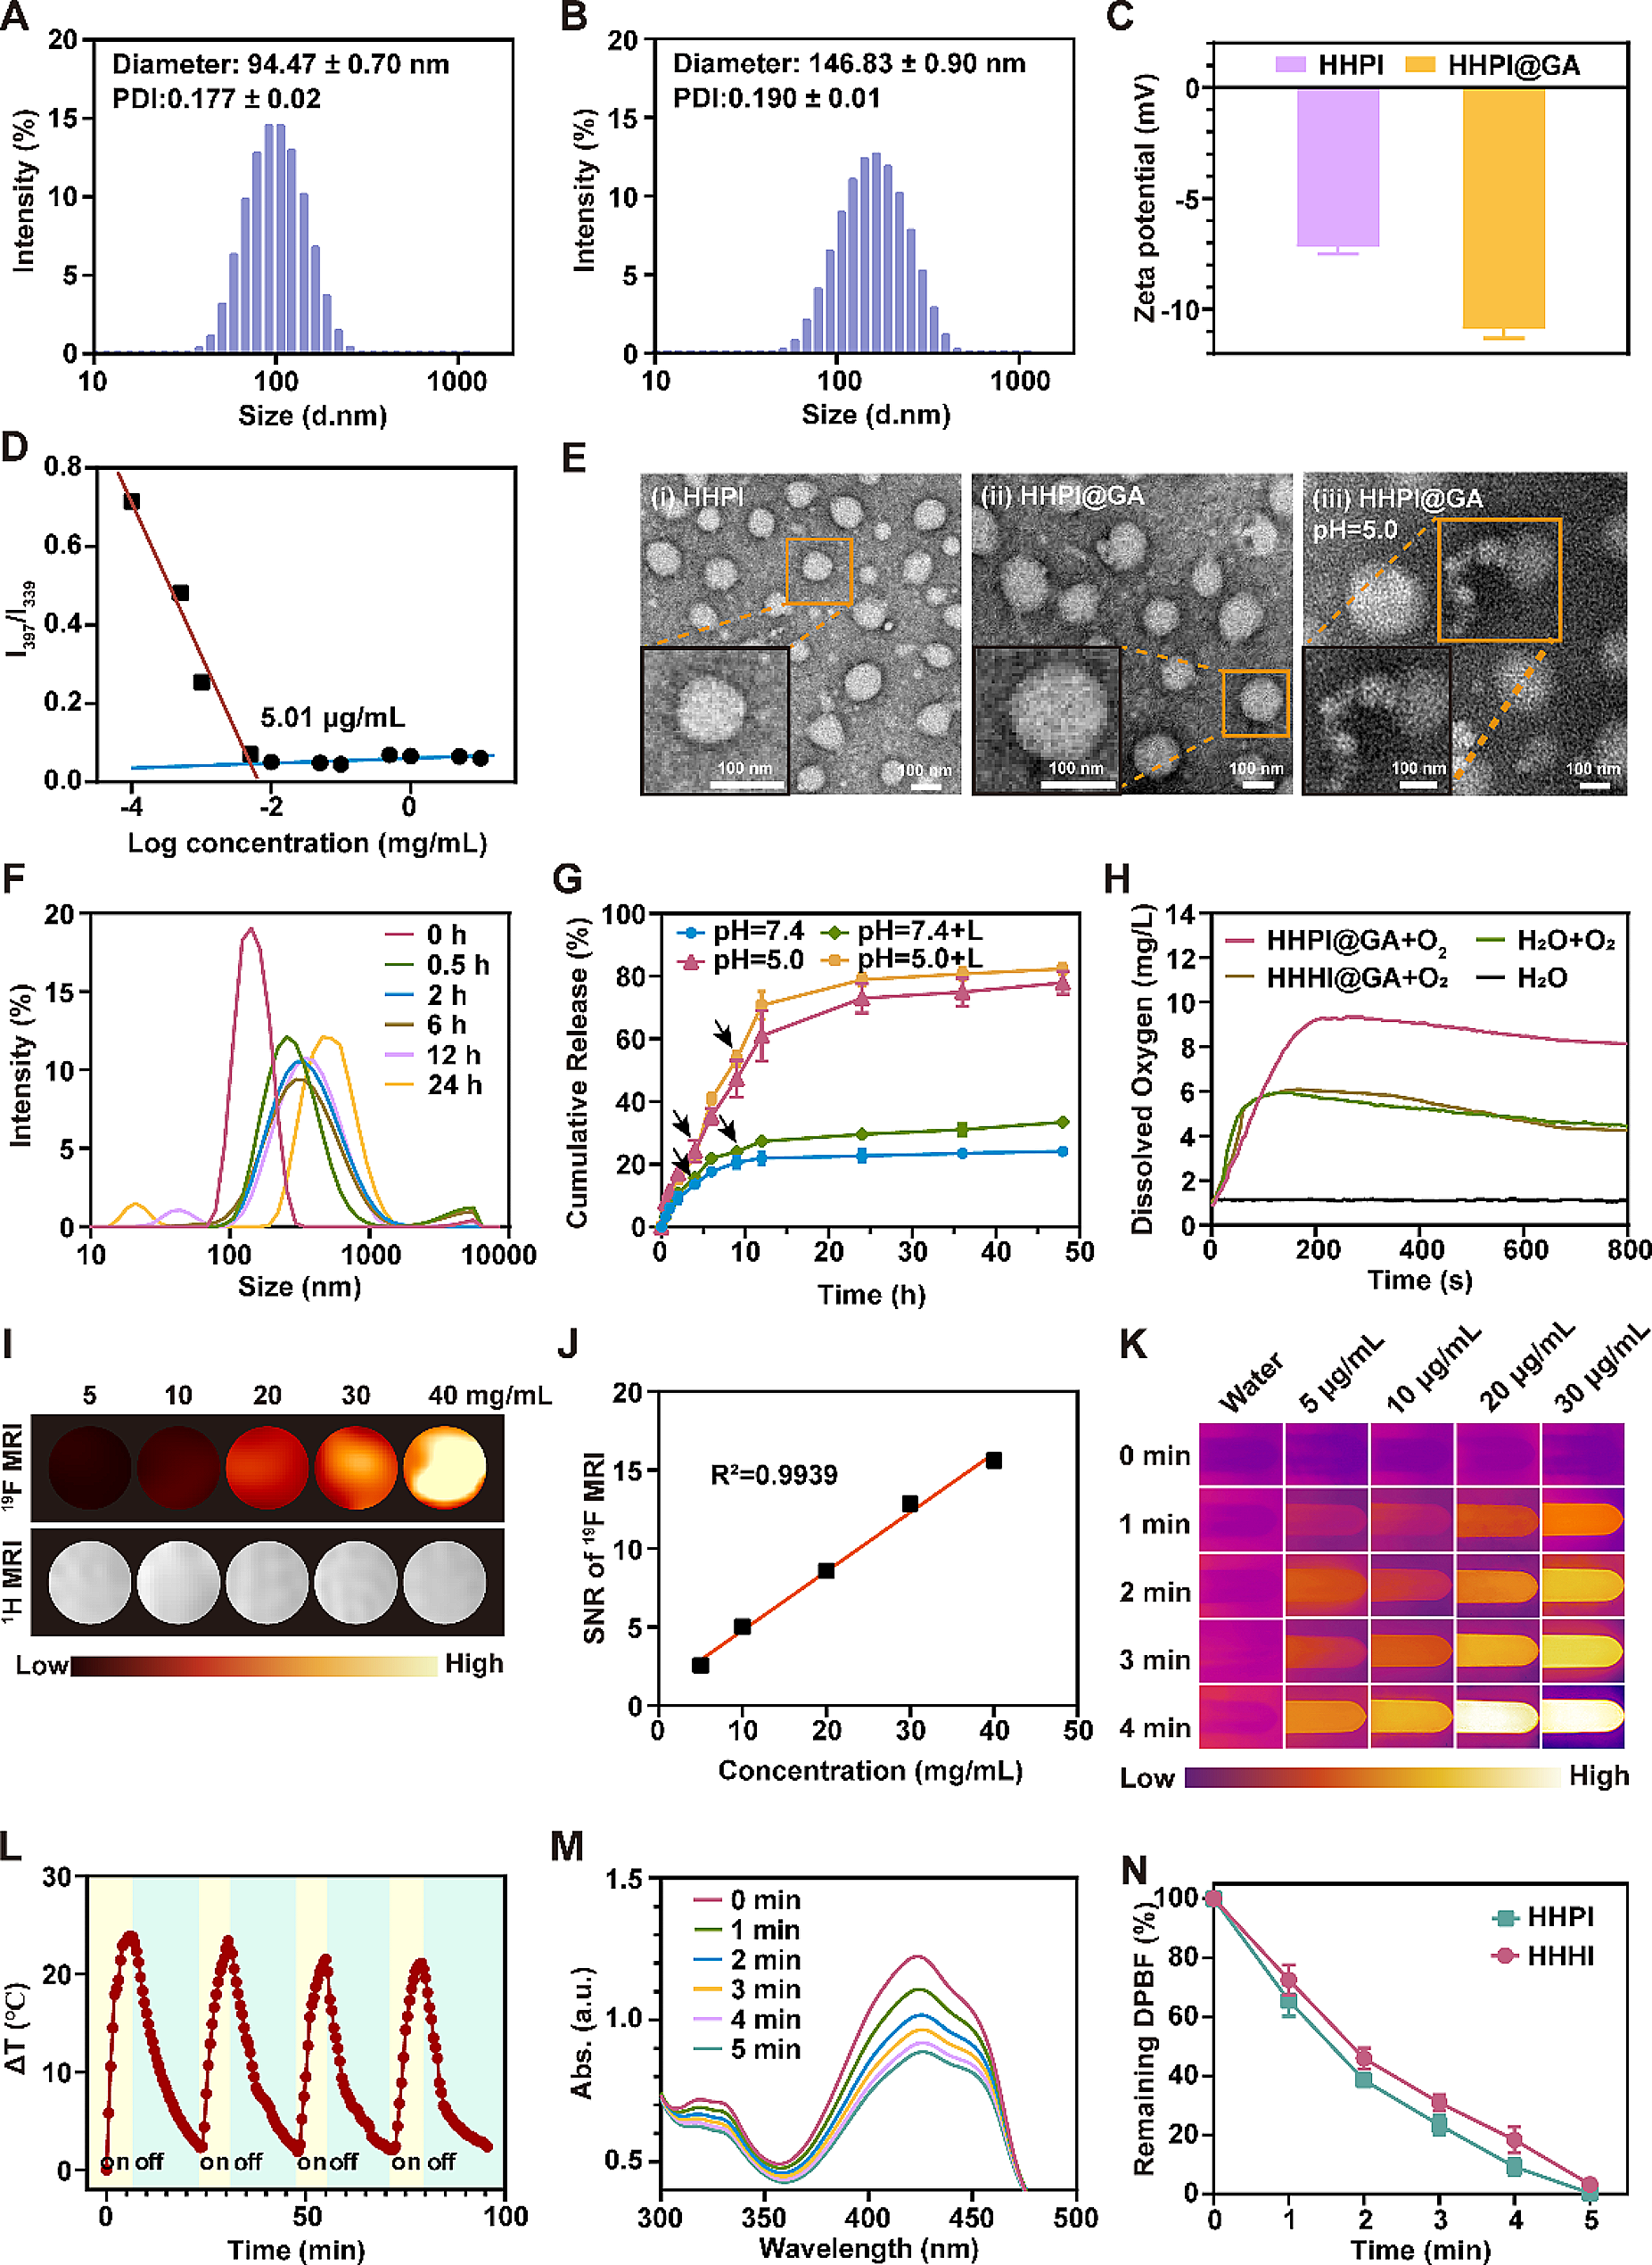

The reverse evaporation method was applied to prepare Liposome NPs and (Lipo + M)@E NPs. TEM images showed spherical morphology of liposomes NPs and (Lipo + M)@E NPs. Meanwhile, a thin film coating around the (Lipo + M)@E NPs appeared after membrane modification (Fig. 2A&B). As shown in Fig. 2C, the encapsulation efficiency (EE %) of (Lipo + M)@E NPs were more than 80% at 1:1, 2:1, and 5:1 of lecithin/Evol. SDS-PAGE assay demonstrated (Lipo + M)@E NPs showed a similar protein profile to Møm (Fig. 2D). By performing western blot, we confirmed that the (Lipo + M)@E NPs expressed the Møm specific marker CD11b (Fig. 2E). In addition, by performing membrane colocalization assay as our previously described method [18], we found that simple mixing of DiO-labeled Møm and DiL-labeled Lipo NPs showed separate green and red fluorescence (Fig. 2F). In contrast, overlapping color (yellow signals) was observed in [Lipo + Mø]m. The above results indicated successful fusion between Møm and Lipo. Additionally, average diameter of (Lipo + M)@E NPs measured by DLS was 183.2 ± 1.6 nm (Fig. 2G) and the zeta potential was -23.46 ± 0.31 mV (Fig. 2H). Finally, we investigated the release behavior of Evol in PBS (pH 7.4) at 37 °C. The release rates of Evol from Lipo@E NPs and (Lipo + M)@E NPs were 85.6% and 64.8% at 72 h, respectively (Fig. 2I). These results demonstrated that cell membrane encapsulating could reduce the release rate of Evol from (Lipo + M)@E NPs, which is beneficial for drug release and disease therapy [19].
Fig. 2
Characterization of (Lipo + M)@E NPs. TEM image of Liposome NPs (A) and (Lipo + M)@E NPs (B). (C) Evol entrapment efficiency of (Lipo + M)@E NPs at the different ratios. (D) SDS-PAGE analysis of retention protein bands of Møm and [Lipo + Mø]m NPs. (E) Western blot of Møm and [Lipo + Mø]m NPs for characteristic Møm marker CD11b. (F) Confocal fluorescence microscopy imaging of a mixture of [Lipo + Mø]m NPs. Red indicated Liposome and green indicated Møm. Scale bar = 5 μm. Particle size (G) and zeta potential (H) of (Lipo + M)@E NPs were analyzed by DLS. (I) Evol release from Lipo@E NPs and (Lipo + M)@E NPs in PBS at pH 7.4
In vitro cellular uptakeUnder physiological conditions, intercellular cell adhesion molecule-1 (ICAM-1) is lowly expressed in the vascular endothelial cells. However, inflammatory lesion can induce the upregulation of ICAM-1, thus providing chemotactic signals to recruit more macrophages. After binding on the vascular endothelium, macrophages can penetrate the blood duct into the inflammatory plaque [20, 21]. In order to investigate the effect of Møm coating on the interaction between nano-materials and activated endothelial cells, LPS-treated HUVECs were used to simulate the inflammatory microenvironment, which is necessary for the initiation of atherosclerosis. DiD was used to label different nano-materials. The fluorescence signals emitted from DiD indicate the high expression of ICAM-1 in the LPS-treated HUVECs (green). Meanwhile, the recruitment ability of LPS-induced HUVECs to (Lipo + M)@E NPs (red) was significantly higher than that of unmodified nanoparticles (Fig. 3A&B). This result also demonstrated the strong interaction between inflammatory HUVECs with high ICAM-1 expression and Møm coating nano-materials, as CD11b on Møm surface can act as a ligand of ICAM-1 in inflammatory HUVECs [22].
Fig. 3
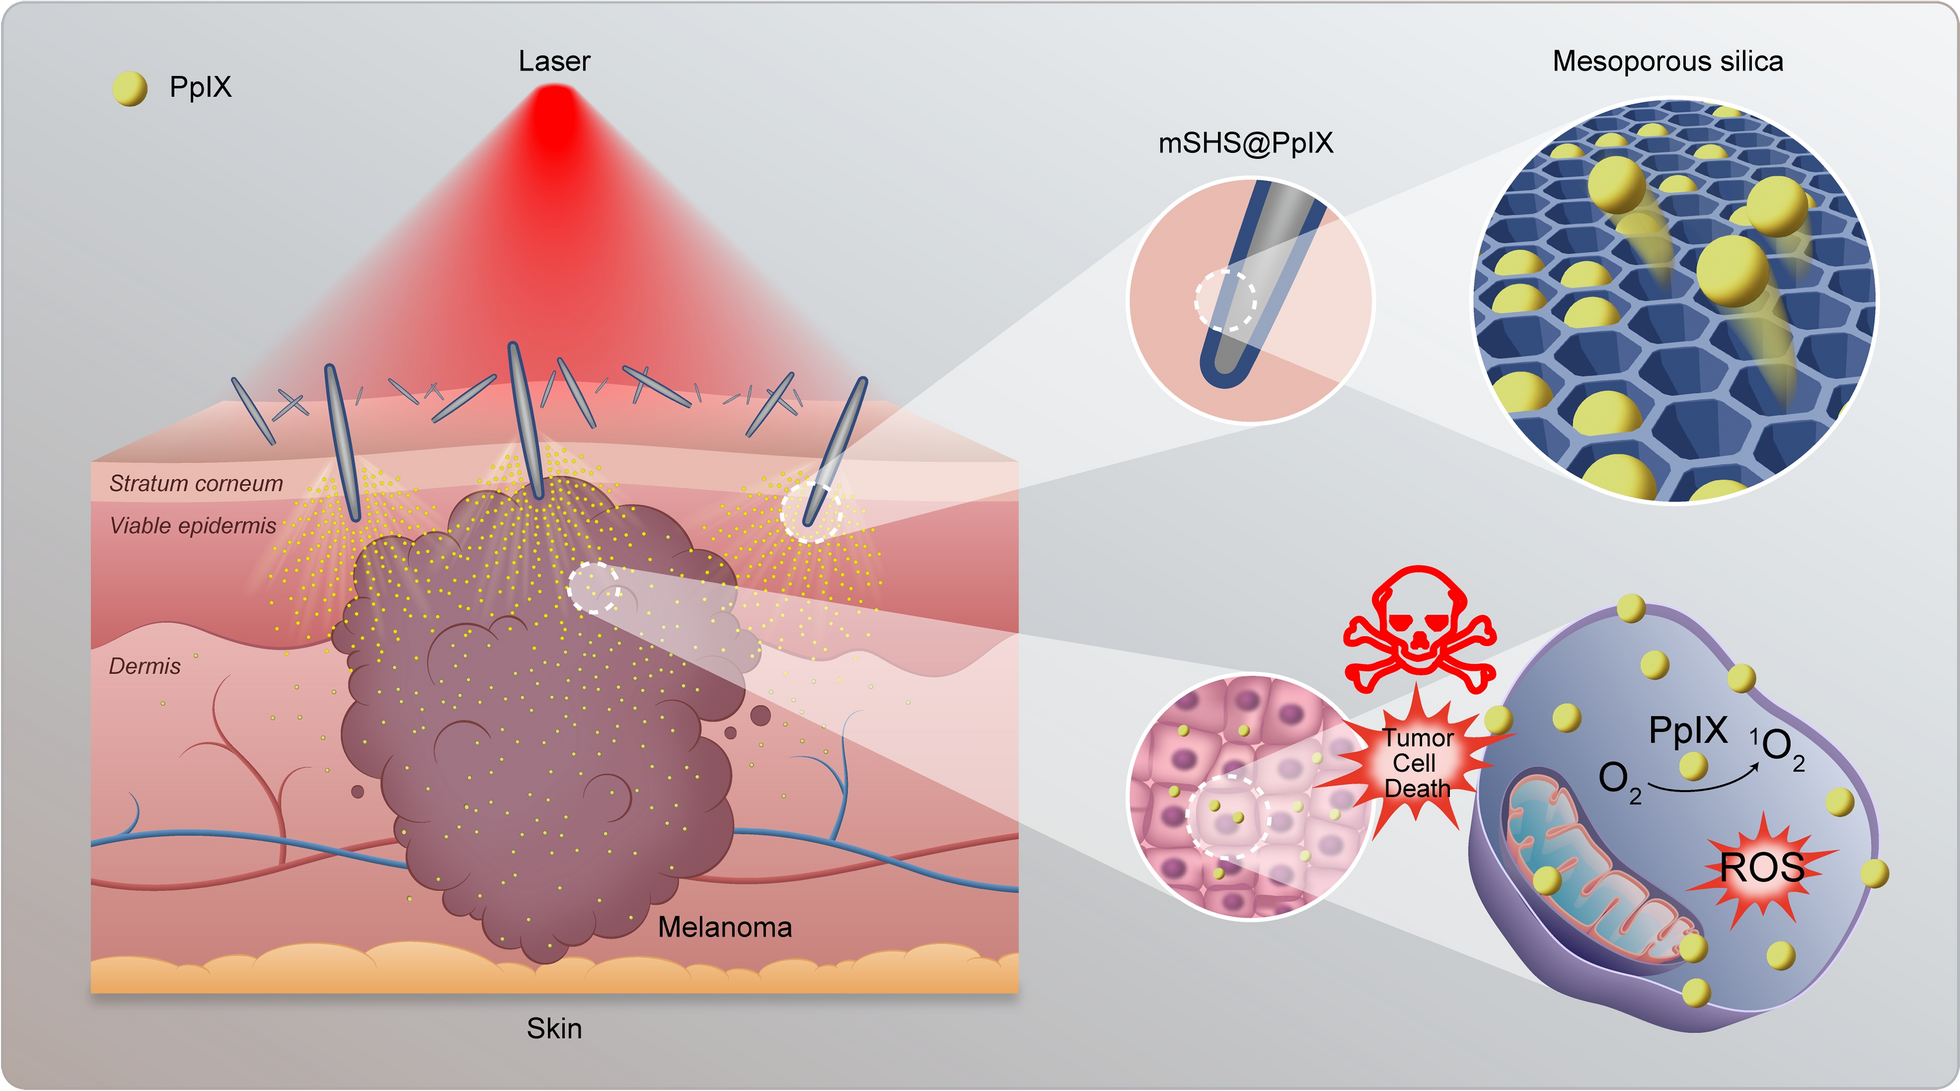
Cellular uptake of M@Lipo NPs. (A) Representative photos of Lipo/M@Lipo (red), HUVECs (blue), and ICAM-1 (green) in the LPS-treated group. (B) Semi-quantitative analysis of the uptake of different NPs in VSMCs and HUVECs. Data are means ± SD, n = 3, ***P < 0.001 vs. Lipo. (C) The schematic diagram showed that HUVECs were co-cultured with VSMCs in a transwell system for simulating plaque in vitro. (D&E) Phagocytosis of Lipo@Rho NPs and M@Lipo@Rho NPs in VSMCs and HUVECs in transwell. BF indicates bright field. (F) Fluorescence quantitation of Lipo/M@Lipo (red). Fluorescence images (G) and quantitation (H) of VSMCs 4 h after incubation with different concentrations of M@Lipo NPs. Scale bars = 60 μm
As VSMC-derived cells accounted for more than 70% of atherosclerotic plaque cells, we co-cultured the HUVECs and VSMCs in the LPS-containing transwell chambers to simulate the atherosclerotic plaque environment in vitro. Next, the uptake performance of M@Lipo by VSMCs was investigated to reflect the permeability of M@Lipo in plaque according to the process in Fig. 3C. As shown in Additional file 1: Fig. S1 and Fig. 3D–E, both HUVECs and VSMCs showed stronger phagocytosis to all NPs, comparing with the free Rho group. However, the phagocytosis ability of VSMCs is higher than that of HUVECs for these nano-materials. It should be noted that the phagocytosis ability of VSMCs to M@Lipo NPs was significantly higher than that of Lipo NPs. This result demonstrated that Møm coating could help nanomaterials pass through the HUVECs layer in the small chamber and enter the underlying VSMCs. Therefore, macrophages membrane improved the penetration and targeting ability of (Lipo + M)@E NPs to VSMCs in atherosclerotic plaque (Fig. 3F), which is conducive to increasing the enrichment of Evol at the lesion site.
Lysosomes of VSMCs are organelles that digest outside materials entering into VSMCs. The probe of LysoTracker (green) was used to monitor the location of M@Lipo NPs after entering into VSMCs. The gradually increased fluorescence signal in VSMCs reflected that M@Lipo NPs were taken up by VSMCs in a concentration-dependent manner (Fig. 3G&H), almost no endocytic M@Lipo NPs were transported into VSMCs via the lysosomal pathway, which was confirmed by the weak overlap of red and green (yellow) fluorescence. In addition, the inhibitors assay indicated that the uptake efficacy of VSMCs was reduced by 55% with colchicine (macropinocytosis mediated endocytosis inhibitor) pre-treatment. Therefore, we can speculate that M@Lipo NPs were taken up by VSMCs through the macropinocytosis pathway (Additional file 1: Fig. S2). As macropinocytosis facilitates the lysosomal escape of entrapped materials [23], the internalization of M@Lipo NPs into VSMCs can effectively prevent the drug from lysosomal degradation, thus maintaining its stability.
Macrophages of the reticuloendothelial system are the executor of phagocytosis and clearance of foreign substances in vivo. Avoiding phagocytosis and clearance by macrophages can significantly improve the performance of the drug delivery system [24, 25]. Additional file 1: Fig. S3 showed that the red fluorescence intensity in RAW264.7 cells significantly reduced due to the membrane coating, compared with sole Lipo NPs. These results clearly demonstrated that the membrane coating enables M@Lipo NPs can maximize the retention of drug concentrations by endowing immune escape ability. Moreover, after entering into blood vessels, the encapsulated Møm is conducive to the recruitment of nano-materials by damaged HUVECs to increase drug enrichment in plaque, ultimately achieving improved drug bioavailability to treat atherosclerosis.
Circulatory time, targeting, and accumulation assay in atherosclerotic lesionsNext, we investigated the effect of macrophages membrane coating on the half-life and accumulation targeting of nanomaterials in vivo. The pharmacokinetics of M@Lipo@Ce6 NPs in C57BL/6 mice were examined via i.v. administration. Figure 4A indicated that the fluorescence intensity of blood samples gradually decreased over time during the investigated process (24 h). The quantitative assay demonstrated that the half-time of M@Lipo@Ce6 NPs increased 0.71- and 7.7- fold compared with Lipo@Ce6 NPs (2.37 h vs. 1.39 h) and sole Ce6 (2.37 h vs. 0.27 h), respectively (Fig. 4B), the consistent result with the previous report [26, 27], demonstrated that Møm coating exhibited superior blood retention. In addition, Fig. 4C indicated that the fluorescence signal enrichment of both nanoparticles at the atherosclerotic plaque, while the signal intensity of M@Lipo@Ce6 NPs treated group increased 1.59-fold, comparing with Lipo@Ce6 NPs (Fig. 4D). However, the accumulation was further improved in Lipo@Ce6 NPs group by utilizing the high affinity between ICAM-1 of injured endothelial cells and CD44 receptor on macrophage membrane [28]. This result demonstrated that passive targeting caused the aggregation of Lipo@Ce6 NPs at the atherosclerotic plaque. In order to assess whether (Lipo + M)@E NPs can improve penetrating ability in atherosclerotic plaque, ApoE−/− atherosclerotic mice were treated according to the protocol in Fig. 7A. At the end of treatment, anti-PEG was used for immunofluorescence staining of frozen aortic roots sections. The result demonstrated that only weak non-specific fluorescent signals in the Control aorta. In the Lipo@E group, most of Lipo@E NPs were found in the plaque margin. Interestingly, after the treatment had finished a week, a significant increase of purple (Lipo + M)@E NPs accumulation was found in the atherosclerotic plaque. Moreover, intense distribution of (Lipo + M)@E was observed in the center of plaque (Fig. 4E). This result clearly demonstrated that Møm-Lipo fusion could enhance the plaque penetration of (Lipo + M)@E. The quantitative fluorescent data indicated significant improvement in the intra-plaque distribution in the (Lipo + M)@E-treated group as compared with the Control and Lipo@E group (Fig. 4F). These results suggest that Møm modification enables long circulation and targeting of M@Lipo NPs in vivo, and enhances penetration and accumulation of M@Lipo NPs in atherosclerotic plaque, which will be able to maintain the release of Evol and increase the concentration of drugs in plaque, thereby slowing the progression of atherosclerosis.
Fig. 4
Pharmacokinetics and targeting capability of (Lipo + M)@E NPs. (A) Representative photographs of blood samples collected from C57BL/6 mice after administration of different nano-materials at various time points. (B) Pharmacokinetic curves of different nano-materials. n = 3. Fluorescence photos (C) and semi-quantitative (D) show the fluorescent signals of Ce6 in aortas from ApoE−/− mice. ApoE−/− mice fed with HFD for 2 months were intravenously injected with different NPs. After administration of 12 h, the aortas of ApoE−/−mice were isolated for detection. Data are means ± SD, n = 3, **P < 0.01 vs. the Lipo@Ce6 NPs. (E) Immunofluorescence imaging showing accumulation and infiltration of different nano materials (immunofluorescence stained for anti-PEG) in the aortic roots of ApoE−/− mice after 8 weeks of serial treatment. Blue indicated nuclei and purple indicated nano materials (stained for anti-PEG) in plaque. Scale bars = 200 μm. (F) Analysis of (Lipo + M)@E NPs fluorescence intensity (stained for anti-PEG) along the white arrowed lines. n = 3
Besides, fluorescence images indicated that M@Lipo@Ce6 NPs mainly enriched in the liver and kidney. Compared with the Lipo@Ce6 group, the M@Lipo@Ce6-treated mice showed a ~ 1.5-fold higher in the liver. Meanwhile, the concentration of M@Lipo@Ce6 in the liver was approximately 12-fold higher compared with other organs in the M@Lipo@Ce6 group (Additional file 1: Fig. S4). Since binding between Evol and LDLR can reduce LDL in the liver [29], this result showed that M@Lipo@Ce6 enrichment in the liver could effectively alleviate atherosclerosis by adjusting lipid metabolism.
(Lipo + M)@E NPs inhibit VSMCs proliferation and migration by reducing PCSK9As a strong chemical stimulator, LPS can promote the dedifferentiation and migration of VSMCs [30]. Additional file 1: Fig. S5 showed the upregulation of PCSK9 levels in VSMCs incubated with LPS in a concentration-dependent manner. However, 2.5 nM Evol significantly attenuated PCSK9 levels in 100 ng/mL LPS-induced VSMCs (Additional file 1: Fig. S6), which was considered an appropriate concentration for subsequent studies.
Using western blot assay and immunofluorescence imaging, we detected the change of PCSK9 in VSMCs with (Lipo + M)@E NPs treatment. Figure 5A&B indicated the upregulation of PCSK9 levels in VSMCs with LPS treatment was significantly reversed by the (Lipo + M)@E NPs treatment. Consistent with this result, immunofluorescence images also demonstrated the strong inhibitory effect of (Lipo + M)@E NPs on the PCSK9 expression (Fig. 5C&D).
Fig. 5
(Lipo + M)@E NPs regulated the phenotypic transformation of VSMCs by reducing PCSK9 levels. (A) Represented photograph showing the protein expressions of PCSK9, OPN, Vimentin, and α-SMA in VSMCs after treatment with Evol, Lipo@E NPs, and (Lipo + M)@E NPs. (B) The relative quantification analysis of PCSK9, OPN, Vimentin, and α-SMA. Immunofluorescence images and quantitative analysis of PCSK9 (red) (C&D), OPN (yellow) (E&F), Vimentin (red) (G&H), and α-SMA (green) (I&J) in VSMCs after treatment with (Lipo + M)@E NPs. Scale bars = 20 μm. 1: Control, 2: Model, 3: Evol, 4: Lipo@E NPs, 5: Lipo + M)@E NPs. Data are means ± SD, n = 3, ##P < 0.01, ###P < 0.001 vs. the Control. **P < 0.01, ***P < 0.001 vs. the Model
Since the phenotypic transformation of VSMCs is involved in the progression of atherosclerosis, we then investigated the effect of (Lipo + M)@E NPs on the levels of phenotype markers of VSMCs. Both western blot (Fig. 5A&B) and immunofluorescence analysis (Fig. 5E–J) indicated that (Lipo + M)@E NPs could significantly reverse the levels of a synthetic marker of OPN and contractile markers of α-SMA and Vimentin in VSMCs in vitro. Compared with the Model group, (Lipo + M)@E NPs upregulated the levels of Vimentin and α-SMA in VSMCs, while decreasing the levels of OPN. These results demonstrated that (Lipo + M)@E NPs could regulate the phenotypic switching of VSMCs by down-regulating the expression of PCSK9, thereby alleviating atherosclerosis. Notably, Evol with low dosage inhibited the proliferation and migration of VSMCs, the efficacy is much lower, compared with the (Lipo + M)@E NPs group, as the encapsulation of Møm not only promoted the uptake of nanomaterials by VSMCs but also protected Evol from decomposition and destruction before reaching the destination.
In addition, RNA-sequencing indicated that (Lipo + M)@E NPs treatment could result in the up-regulation of 393 expressed genes and down-regulation of 330 expressed genes, compared with LPS-induced VSMCs (Additional file 1: Fig. S7A). GO functional annotation and analysis indicated that differential expression genes (DEGs) were mainly distributed in the negative regulation of smooth muscle cell proliferation, collagen catabolic process, artery smooth muscle contraction, positive regulation of smooth muscle cell apoptotic process, cell migration, extracellular matrix organization, and response to LPS (Additional file 1: Fig. S7B). In terms of molecular function, they are mainly related to the protein kinase C binding, actin monomer binding, enzyme binding, MAP kinase kinase kinase activity, kinase binding, extracellular matrix structural constituent, collagen binding, and chemokine activity (Additional file 1: Fig. S7C). The cellular components of DEGs were mainly expressed in the actin cytoskeleton, membrane protein complex, endosome, rough endoplasmic reticulum, smooth muscle contractile fiber, receptor complex, membrane raft, extracellular space, and extracellular matrix (Additional file 1: Fig. S7D). GSEA further demonstrated that (Lipo + M)@E NPs down-regulated the levels of genes enriched in actin binding, actin monomer binding, and extracellular matrix structural constituent, while up-regulated the expression of DEGs in negative regulation of cell proliferation (Additional file 1: Fig. S7E). Abnormal migration and proliferation of VSMCs [31], and extracellular matrix (ECM) secretion by the proliferation of VSMCs can cause the pathogenesis of macrovascular diseases. Remodeling of actin cytoskeleton regulates cell motility, migration, and invasion [32, 33]. This remodeling relies on the polymerization of G-actin into F-actin, allowing dynamic regulation of the biomechanical properties of cells [34]. Additional file 1: Fig. S7E showed that (Lipo + M)@E NPs could inhibit the expression of genes in actin and actin monomer binding process. It is known that the contractile type of VSMCs may transform into the synthetic type of VSMCs to improve proliferation, migration, and plaque formation [35]. The above results indicated that (Lipo + M)@E NPs could negatively regulate the proliferation of VSMCs by acting on actin and ECM of VSMCs.
Subsequently, we performed viability, proliferation, and migration assay of VSMCs with different treatments. Compared with the Control group, the viability of VSMCs with LPS treatment increased by 19.95%, while the viability of VSMCs decreased by 46.2% in the presence of (Lipo + M)@E NPs, compare with the Model group (Fig. 6B). EdU staining also showed that proportion of EdU-positive cells increased 36% after treatment with LPS, compared with the Control group. In contrast, the proportion of EdU positive cells in VSMCs treated with (Lipo + M)@E NPs decreased by 35%, compared with the Model group (Fig. 6A&C). In addition, Fig. 6D&E indicated that LPS strongly promoted VSMCs migration, with a migration rate 7.14-fold higher than the basic levels, while (Lipo + M)@E NPs reduced migration to 15.7%. Wound healing assay also indicated the promotion of LPS on the migration of VSMCs (increased by 42.6%), compared with the Control group. On the contrary, the migration rate of the (Lipo + M)@E NPs group decreased by 51.1%, compared with the Model group (Fig. 6F&G). These results suggested that (Lipo + M)@E NPs could significantly inhibit the proliferation and migration of VSMCs induced by LPS.
Fig. 6
(E)The number of migrated VSMCs. Images (F) and quantitative (G) of wound-healing assay of VSMCs with different treatments. Scale bars = 200 µm. Data are means ± SD, n = 3, ##P < 0.01, ###P < 0.001 vs. the Control. *P < 0.05, **P < 0.01, ***P < 0.001 vs. the Model
(Lipo + M)@E NPs inhibit VSMCs proliferation and migration. (A) The proliferative VSMCs were determined by EdU incorporation assay. Blue represents nuclei and green represents the EdU-positive VSMCs. Scale bars = 60 µm. (B) Viability assay of VSMCs with different treatments. (C) The ratio of EdU-positive cells to total cells under different treatments. (D) Migrated VSMCs were detected by transwell assay. Scale bars = 200 µm.
As 70% of foam cells in coronary atherosclerosis are mainly derived from VSMCs [36, 37]. We then investigate the effect of (Lipo + M)@E NPs on the uptake behavior of VSMCs to DiL-oxLDL. Additional file 1: Fig. S8A&B showed stronger red fluorescence in the LPS-induced VSMCs with DiL-oxLDL incubation (increased by 11.8-fold), compared with the Control group. On the contrary, only weak red fluorescence signal appeared because of the effective inhibition of (Lipo + M)@E NPs on the uptake of DiL-oxLDL(decreased by 90%, compared with the Model group). Oil-red O staining similarly demonstrated that LPS significantly promoted lipid droplets accumulation in VSMCs (increased by 16.8-fold, compared with the Control group), while (Lipo + M)@E NPs alleviated the lipid droplets accumulation by about 79%, compared with the Model group (Additional file 1: Fig. S8C&D). The above results suggested that (Lipo + M)@E NPs efficiently inhibited VSMCs-derived foam cells formation by reducing the uptake and internalization of oxLDL.
Therapeutic efficacy of (Lipo + M)@E NPs against atherosclerosisBased on the above results, in vivo study was performed to evaluate the therapeutic efficacy of (Lipo + M)@E NPs on ApoE−/− atherosclerosis mice according to the protocol of Fig. 7A. ORO staining of aorta revealed that the area of lipid deposited plaque was about 2.08% and 20.14% in the Control and Model group, respectively, the data of which confirmed the successful construction of the atherosclerosis Model. However, the plaque area was differentially reduced in the ApoE−/− mice with treatments, compared with the Model group. Compared with the free Evol group (~ 13.33%) and Lipo@E NPs group (~ 12.44%), (Lipo + M)@E NPs showed the strongest inhibitory effect on aortic plaque formation with plaque area of ~ 3.78% (Fig.7B&C), which was consistent with previous reports [38]. This result demonstrated that this biomimetic nanoparticle could actively target, accumulate and penetrate into plaque. In addition, we studied the effect of (Lipo + M)@E NPs on the plaque formation of aorta, the high occurrence region. ORO staining of the frozen section indicated significant lipid deposition in the plaque of the Model group, while the (Lipo + M)@E NPs showed the most significant anti-lipid deposition effect in all segments of aorta (Fig. 7D–G). Collectively, these results demonstrated the significant therapeutic effect of (Lipo + M)@E NPs on atherosclerosis.
Fig. 7
Treatment with (Lipo + M)@E NPs significantly alleviates the progression of atherosclerosis. (A) Treatment protocols of ApoE−/− mice. ApoE−/− mice were fed an HFD for 3 months. From the second month, all mice received different treatments by i.v. injection twice weekly for the rest of the period. Mice in the Control group were treated with saline alone, while other groups were separately administered with Evol, Lipo@E NPs, and (Lipo + M)@E NPs at the same Evol concentration (5 mg/kg). Representative photograph (B) and quantitative (C) of en face ORO-stained aortas. (D) ORO-stained frozen sections of the aortic root, arch, and abdominal aorta. Quantitative of the relative plaque area in sections of the aorta root (E), aortic arch (F), and abdominal aorta (G). ApoE−/− mice were fed an HFD for 3 months. From the second month, all mice received different treatments by i.v. injection twice weekly for the rest of the period. Mice in the Control group were treated with saline alone, while other groups were separately administered with Evol, Lipo@E NPs, and (Lipo + M)@E NPs at the same Evol concentration (5 mg/kg). Scale bars = 500 µm. 1: Control, 2: Model, 3: Evol, 4: Lipo@E NPs, 5:(Lipo + M)@E NPs. Data are means ± SD, n = 3, ###P < 0.001 vs. the Control. *P < 0.05, **P < 0.01, ***P < 0.001 vs. the Model
The proportion of the necrotic core directly determines the vulnerability of plaque [39]. H&E staining indicated that the aortic root plaque with vulnerability was composed of necrotic cores with abundance of lipids in the Model group, and the proportion of necrotic core (24.35%) was higher than that of the Control group (9.65%). However, the proportion of necrotic core was differently reduced in all treatment groups. Specifically, the proportion in the mice with (Lipo + M)@E NPs treatment was only 6.7% (Fig. 8A). In view of the close relationship between the necrotic core and macrophages infiltration in the plaque [40], the immunochemistry method was used to detect the effect of (Lipo + M)@E NPs treatment on the macrophages infiltration. As we predicted, the number of macrophages (represented by F4/80) decreased by 60.8% with (Lipo + M)@E group, compared with the Model group (Fig. 8B). In addition, we detected the CD31 levels of surrounded blood vessels as arterial endothelial dysfunction with high CD31 levels is another important factor in the progression of atherosclerosis [41]. Figure 8C indicated that the levels of CD31 + endothelial cells around blood vessels decreased by 67% after (Lipo + M)@E NPs treatment. Next, we evaluated the effect of (Lipo + M)@E NPs treatment on plaque stability. Masson's trichrome staining showed that (Lipo + M)@E NPs increased the collagen content around the plaque for 1.94-fold, while inhibiting the expression of MMP-9, compared with the Model group (Fig. 8D&E). Stable plaque lesions generally have a thick collagen-rich fibrous cap covering a plaque core, and MMP-9 may promote the development of vulnerable lesions [42, 43]. These results indicated that (Lipo + M)@E NPs significantly reduced plaque area and notably enhanced the stability of atherosclerotic lesions simultaneously, after two months of treatment in ApoE−/− mice with established atherosclerosis.
Fig. 8
Histochemistry analyses of aortic root paraffin sections from ApoE−/− mice with different treatments. Representative photographs and quantitative analysis of aortic root sections stained by H&E (A), antibody to F4/80 (B), antibody to CD31 (C), Masson’s trichrome (D), and MMP9 (E). 1: Control, 2: Model, 3: Evol, 4: Lipo@E NPs, 5:(Lipo + M)@E NPs. Scale bars = 500 µm. Data are means ± SD, n = 3, ##P < 0.01, ###P < 0.001 vs. the Control. *P < 0.05, **P < 0.01, ***P < 0.001 vs. the Model
Based on the favorable effect of (Lipo + M)@E NPs on atherosclerosis, we investigated whether (Lipo + M)@E NPs can inhibit PCSK9 levels and phenotypic transition of VSMCs in atherosclerotic mice. Firstly, we examined the intraplaque PCSK9 levels by immunohistochemistry and found that PCSK9 levels were significantly higher in the Model group, compared with the Control group, while reversed by (Lipo + M)@E NPs treatment (37.4% vs. 17.5%) (Fig. 9A&B). In addition, by comparing the levels of PCSK9 in the blood of ApoE−/−mice with different treatments, we found that (Lipo + M)@E NPs effectively reduced the levels of PCSK9 of Model mice from 2096.19 pg/mL to 156.21 pg/mL, the concentration of which is close to the Control group (242.27 pg/mL) (Fig. 9C). These results definitely demonstrated that (Lipo + M)@E NPs can delay atherosclerosis development by downregulating PCSK9 in VSMCs and in blood. Co-staining of α-SMA and PCSK9 in the VSMCs of aortas plaque also demonstrated a significant ratio increase of PCSK9 positive VSMCs in the Model group, compared with the Control group (37.80% vs. 10.70%) (Fig. 9D&E), the phenomenon can be reversed by the (Lipo + M)@E group (the ratio of 5.37%). Next, we investigated the effect of PCSK9 down-regulation on OPN, a synthetic phenotypic marker in VSMCs. Figure 9F&G showed that high expression of OPN in VSMCs in aortic roots of HFD mice, which was revealed by the distinct yellow fluorescence (23.7%). However, the downregulation of PCSK9 caused by (Lipo + M)@E NPs directly result in the decrease of OPN levels by about 71%, which was revealed by the weak yellow fluorescence. These results suggest that cardiac aortic VSMCs phenotypic transformation during the development of atherosclerosis can be reversed by (Lipo + M)@E NPs through inhibiting PCSK9 expression. As the inhibitory effect of Evol on PCSK9 can upregulate LDLR in the liver [29], we then explored the effect of (Lipo + M)@E NPs accumulation in the liver on the LDLR. Western blot showed that intravenous injection (Lipo + M)@E NPs resulted in approximately doubling the LDLR levels in the liver by inhibiting the expression of PCSK9, compared with Evol or Lipo@E NPs (Additional file 1: Fig. S9). This is presumably due to the higher enrichment of M@Lipo NPs in the liver compared with Lipo NPs, which is helpful for alleviating atherosclerosis.
Fig. 9
The effect of (Lipo + M)@E NPs on the levels of PCSK9 and OPN in ApoE−/− atherosclerotic mice. Histochemistry photographs (A) and quantitative (B) of aortic root paraffin sections stained with anti-PCSK9. (C) Serum PCSK9 levels in ApoE−/− mics after different treatments were detected by Elisa. (D) Frozen sections of aortic root were prepared for double immunofluorescence staining. Green indicated PCSK9, red indicated α-SMA, and yellow indicated PCSK9-positive VSMCs in plaque. (F) Immunofluorescence staining using anti-OPN (green) and anti-α-SMA (red), yellow indicated OPN-positive VSMCs in plaque. (E&G) Quantification analysis of PCSK9 and OPN in VSMCs. 1: Control, 2: Model, 3: Evol, 4: Lipo@E NPs, 5:(Lipo + M)@E NPs. Scale bars = 500 µm. Data are means ± SD, n = 3, ##P < 0.01, ###P < 0.001 vs. the Control. *P < 0.05, **P < 0.01, ***P < 0.001 vs. the Model
Effects of (Lipo + M)@E NPs on the intestinal microbiota of ApoE−/− miceMany studies demonstrated the important role of gut flora in atherosclerosis [44]. Some researchers even took an imbalance of intestinal flora as an independent risk factor for atherosclerosis [45]. Therefore, we used 16S rDNA sequencing to observe the changes of intestinal microbiota in ApoE−/− mice after treatment with (Lipo + M)@E NPs. Simpson and Shannon index showed the good diversity and evenness of species distribution among the communities of the three groups (Additional file 1: Fig. S10A&B). Principal coordinate analysis (PCoA) evaluation showed that the samples of the Model group were completely separated from the Control group, while the samples of the (Lipo + M)@E group were similar to the Control group (Additional file 1: Fig. S10C). These results indicated that the significant change in the overall structure and composi
留言 (0)