
記住我


The introduction of antiretroviral therapy (ART) has increased the lifespan of people with HIV (PWH) in sub-Saharan Africa (SSA). However, in the same period, the burden of non-AIDS related comorbidities such as cardiovascular diseases (CVDs) have increased possibly due to residual inflammation. We have recently demonstrated that virally suppressed PWH continue to have persistent inflammation [1,2]. Therefore, understanding the drivers of residual inflammation and defining targets to reverse inflammation remains a major goal toward restoring health and lifespan in PWH.
The etiology of HIV-associated immune activation is not clear and may include HIV itself, microbial translocation, ART toxicity, comorbidities, and co-infections such as tuberculosis (TB) [3–6]. In TB endemic regions such as SSA, PWH are more likely to acquire TB, resulting in a spectrum of outcomes from asymptomatic to active or fulminant TB disease. Latent tuberculosis infection (LTBI) is characterized by the presence of immune responses to Mycobacterium tuberculosis without clinical evidence of active TB. Although the prevalence of LTBI is variable throughout SSA, it is estimated that the prevalence rates are up to 50% in regions with high TB transmission, including Kenya [7,8]. Like HIV, LTBI is also characterized by immunologic dysregulation. Thus, it may not be benign, as indicated by the increased risk of CVD in persons with LTBI [9–11]. One possible common mechanistic pathway for the increased risk for CVD in PWH and LTBI is the immune dysregulation resulting from periodic activity of some component (i.e. mRNA, protein) or low-level replication of mycobacterium and HIV [12–14].
Cytokines secreted by monocytes/macrophages and CD4+ T-lymphocytes of T helper (Th) type are important initiators and regulators of the immune response to both HIV and TB [15,16]. Monocytes produce cytokines such as tumor necrosis factor (TNF)-α and interleukin (IL)-12p70. Of the CD4+ T-cell types, Th1 cells producing IL-2, TNF-α, and interferon (IFN)-γ, and IL-17A-producing Th17 cells may be the most critical in the control of TB [17]. On the other hand, Th2 responses are accompanied by an increase in anti-inflammatory cytokines IL-4, IL-5, and IL-13. These type 2 cytokines and other anti-inflammatory cytokines may enhance susceptibility to infections [15,18]. HIV infection of Th cells causes further imbalance in cytokine production; however, ART may reverse this immune dysregulation by restoring the ability of T cells to respond to antigens [19].
Although the cytokine profiles of those with LTBI or HIV mono-infection have been well explored, to our knowledge, there are no studies that have assessed thoroughly the combined effects of HIV and LTBI co-infections on the systemic inflammatory milieu. In this study, we compared cytokine profiles by HIV/LTBI status in plasma samples of adult men and women from Kenya. We hypothesized that LTBI/HIV co-infection would be associated with greater cytokine levels compared to either condition alone or the absence of both conditions, and that these association would be stronger in women compared to men.
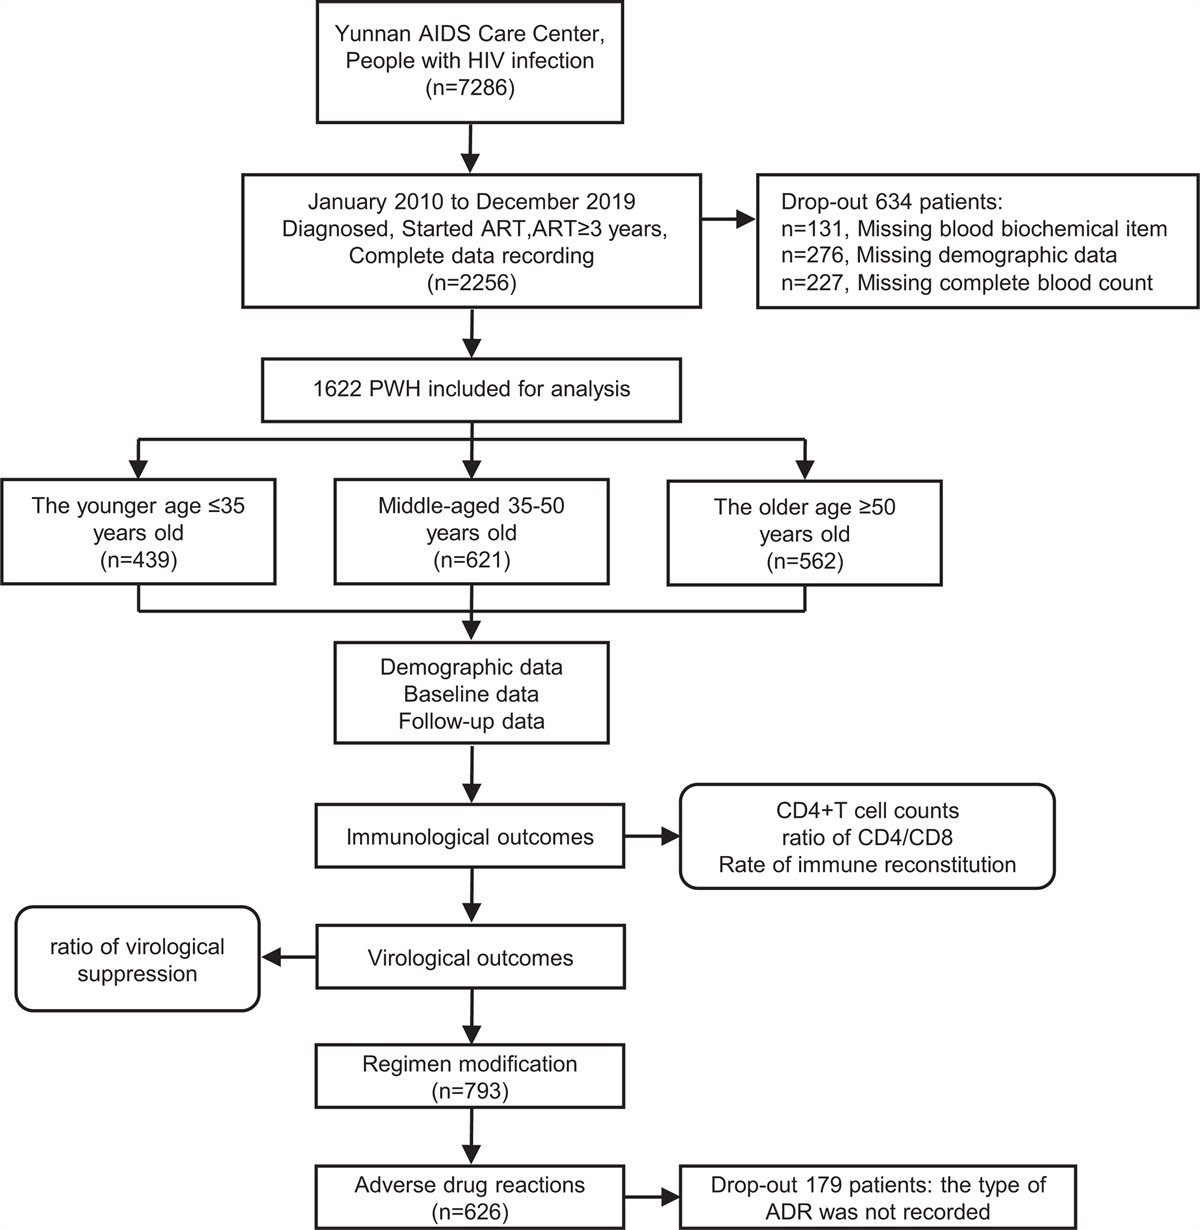
Methods Study population and proceduresWe utilized cross-sectionally collected samples from a study which assessed risk factors for CVD and pulmonary diseases in PWH on long-term ART in Kenya [8]. Data were collected between December 2018 and December 2019 and included demographic and anthropometric measurements. Study procedures have been described elsewhere [8]. Briefly, a convenience sample of men and women 30 years or older with and without HIV were recruited from the Kisumu District Hospital HIV clinic and voluntary HIV testing centers respectively. Pregnant women or individuals with history of CVD, neoplasia, active infections, and those on immunosuppressive agents were excluded from the study. For this analysis, we further excluded individuals with previous diagnosis of TB or those presently on treatment for TB.
Data on covariates such as age, education, alcohol use, smoking status, ART duration and nadir CD4+ T-cell count (CD4) were obtained from the participants and confirmed using medical records. Anthropometric measurements such as weight, height, and blood pressure (BP) were measured. Body mass index (BMI) was calculated from weight and height measurements. Fasting blood samples were used to assess for blood glucose (FBG), lipids, current CD4+ T-cell count, and HIV RNA viral load (VL). Elevated BP was defined by systolic BP ≥140 mmHg and/or diastolic BP ≥90 mmHg and/or if the participant was on antihypertensives medications. Viral suppression was defined as VL <1000 copies/ml per Kenyan guidelines [20]. Data included in this manuscript was obtained and stored in compliance with regulations of the Ethics and Research Committee of Kenyatta National Hospital and the Institutional Review Board at University of Washington. All participants provided written informed consent.
Latent tuberculosis Infection assessmentA QuantiFERON TB Gold-Plus (QFT-Plus) test was performed at CDC/KEMRI in Kenya in accordance with manufacturer's instructions (Qiagen). We defined LTBI by a positive QFT-Plus and the absence of symptoms or signs suggestive of active TB. Prior TB infection was self-reported. Study participants were asked whether they had previously been told they have TB. All participants were screened for symptoms of active TB (ongoing productive cough, hemoptysis, weight loss, chest pain, fevers, chills, or night sweats) using World Health Organization symptom screening form. Those with symptoms of active TB were not enrolled. Eighty percentage of PWH had received prior Isoniazid preventive therapy (IPT) for treatment of latent TB at the time of recruitment and all were included in these analyses. Individuals with indeterminate QuantiFERON values on were also excluded in the analysis.
Immunological biomarker analysisPlasma levels of IL-2, IL-4, IL-5, IL-6, IL-2p70, IL-13, IL-15, IL-17A, IFN-γ, and TNF-α were measured using the multiplex ELISA-based assay (Meso-Scale Discovery). Samples with a coefficient of variation >30% were re-ran. Plasma biomarkers of intestinal barrier dysfunction [intestinal-fatty acid binding protein (I-FABP)] and monocyte/macrophage activation markers (soluble CD14) were quantified using ELISA (Quantikine ELISA kit, R&D Systems). Assays were performed in duplicate and in accordance with manufacturers’ protocols.
Statistical analysisWe first compared demographic and clinical characteristics within and across groups [HIV+LTBI+(HIV+LTBI+), HIV+LTBI−(HIV), HIV−LTBI+(LTBI), and HIV−LTBI− (healthy controls, HC)] using t-tests, Wilcoxon rank sum tests or Kruskal–Wallis test for continuous variables and chi-squared or Fisher test for categorical variables. Univariable and multivariable linear regression models were used to investigate the association of biomarkers with LTBI and HIV in two ways. First, we assessed independent association of HIV or LTBI with biomarkers. We regressed biomarkers on HIV and LTBI status before and after adjustment of demographics (age, sex, education level), and clinical factors (body mass index, HDL, hypertension, alcohol intake, and smoking status). An interaction term between LTBI and HIV status was introduced in the model to test the difference of these associations by LTBI. Second, HIV and LTBI were combined into a single variable with four groups: HIV+LTBI, HIV, LTBI, HC and we evaluated the synergistic effects of LTBI/HIV status on biomarkers adjusting for demographics and clinical risk factors listed above. In a similar manner, we conducted a multivariable linear regression analysis to examine the association between HIV/LTBI status with biomarkers among male and females separately. These covariates were selected based on prior work suggesting an association with the biomarkers of interest [1,2,21].
Among PWH only, linear regression analyses were performed to evaluate the relationships between biomarkers and LTBI with further adjustment for nadir and current CD4, ART regimen, and ART duration.
All biomarkers were log-transformed before model fitting due to their non-normal distribution. We report the exponentiated β-coefficients and their calculated 95% confidence intervals (CIs) representing the fold increase/decrease in mean level of the biomarkers. Significance was set at a P value <0.05. Analyses were performed using STATA version 13 (San Antonio, Texas, USA).
Results Study participants characteristicsOf the 398 participants enrolled, 101 were HIV+LTBI+, 120 HIV, 108 LTBI, and 69 HC (Table 1). Overall, the median [interquartile range (IQR)] age was 46 (38,57) years and 51% were women. The prevalence of LTBI was 46% in PWH and 61% in the HIV-negative participants (P = 0.002). There were differences in age, BMI, rates of hypertension, and diabetes by HIV/LTBI status. Participants with LTBI were younger regardless of HIV status. Women were more likely to be overweight/obese (51% vs. 29%; P < 0.001), and less likely to use alcohol (13% vs. 18%; P < 0.001) or smoke tobacco (1% vs. 6%; P < 0.001) than men.
Table 1 - Characteristics of participants stratified by HIV and latent TB status. HIV-negative HIV-positive P, across groups P, LTBI+ vs. LTBI− P, HIV+ vs. HIV− LTBI (n = 108) HC (n = 69) HIV+LTBI (n = 101) HIV (n = 120) Demographics Age, years 43 (33,5) 48 (35,60) 45 (39,54) 49 (42,58) 0.01 0.003 0.05 Female 58 (54) 32 (47) 57 (56) 55 (49) 0.36 0.08 0.92 Cardiovascular risk factors Diabetes 5 (5) 8 (12) 2 (2) 5 (4) 0.04 0.10 0.06 Hypertension 33 (31) 26 (38) 16 (16) 19 (16) <0.001 0.93 <0.001 Current smoker 4 (4) 2 (3) 2 (2) 4 (4) 0.92 0.78 0.87 Current alcohol 13 (13) 8 (13) 14 (15) 22 (20) 0.32 0.57 0.07 Other characteristics BMI, kg/m2 25 (22,29) 24 (21,29) 23 (21, 26) 23 (20, 26) 0.003 0.43 0.0004 Waist circumference, cm 83 ± 22 84 ± 21 84 ± 15 84 ± 15 0.56 0.69 0.22 Laboratory values HDL-cholesterol, mg/dl 50 ± 11 52 ± 14 53 ± 14 53 ± 13 0.47 0.58 0.10 LDL- cholesterol, mg/dl 103 ± 31 99 ± 29 94 ± 32 98 ± 34 0.29 0.76 0.07 Total cholesterol, mg/dl 171 ± 38 166 ± 35 166 ± 37 171 ± 41 0.78 0.76 1.00 HIV related characteristics Nadir CD4+ T-cell count, cells/μl 365 (200,552) 335 (200,571) 0.90 CD4+ T-cell count, cells/μl 543 (406,695) 475 (351,614) 0.05 Viral unsuppressed RNA >1000 copies/ml 4 (4) 3 (3) 0.56 Total ART duration, years 10 (6,11) 10 (6,12) 0.65 Current integrase inhibitor 44 (44) 70 (58) 0.10 Nevirapine-based treatment 24 (24) 22 (18) 0.11 Efavirenz-based treatment 22 (22) 14 (12) 0.04 PI-based treatment 6 (6) 11 (9) 0.09Data reported as mean ± standard deviation, percentage, or median [interquartile range (IQR)]. HIV+LTBI+ [HIV+LTBI+], HIV+LTBI− [HIV], HIV−LTBI+ [LTBI], and HIV-LTBI− [healthy controls, HC].ART, antiretroviral therapy; LTBI, latent tuberculosis infection; BP, blood pressure; BMI, body mass index; HDL, high-density lipoprotein; LDL, low-density lipoprotein. The Kruskal–Wallis or Pearson exact and χ2 tests for comparisons of more than two groups and the Wilcoxon rank sum or χ2 test for comparison between two groups.
Of the participants with HIV, the median (IQR) ART duration was 9 (6,12) years. The median current CD4+ T-cell count was 508 cells/μl and was borderline higher for the HIV/LTBI co-infected individuals (P = 0.05) compared to the HIV mono-infected individuals. Women with HIV had significantly higher median CD4+ T-cell count (565 vs. 443 cells/μl; P < 0.001) and nadir CD4+ T-cell count (356 vs. 333 cells/μl; P = 0.02) than the men. Almost all PWH (97%) were virally suppressed.
Impact of latent tuberculosis infection on plasma gut permeability and monocyte activation biomarkers in HIVTo determine the influence of LTBI on intestinal barrier function and monocyte activation, we compared plasma levels of I-FABP and sCD14 in persons with and without LTBI by HIV status. As shown in Fig. 1, plasma levels of I-FABP and sCD14 were significantly higher in the HIV+LTBI+ and HIV groups compared to the LTBI and the HC participants (P < 0.001 for all).
 Fig. 1:
 Log10 plasma levels of biomarkers by HIV serostatus and LTBI status.
We evaluated the independent effect of HIV and LTBI separately by regressing biomarkers on HIV status, LTBI status, and their interaction controlling for demographic and clinical factors (Fig. 2). HIV but not LTBI was independently associated with higher I-FABP (P < 0.0001) and sCD14 (P < 0.001) in a fully adjusted model. HIV status did not modify the effect of LTBI on I-FABP or sCD14 (P = 0.36 and P = 0.92, respectively for LTBI by HIV status interaction).
 Fig. 2:
 Association of LTBI and HIV with plasma biomarkers.
We next evaluated the effect of LTBI on plasma biomarkers by combining HIV and LTBI into a single variable with four subgroups. In fully adjusted models, both HIV+LTBI+ and HIV+ remained associated with higher I-FABP and sCD14 (P < 0.001 for all) compared to the HC (Table 2). When stratified the analyses by sex, men, and women with HIV, regardless of their LTBI status, had significantly higher sCD14 and I-FABP compared to the HC in fully adjusted models (P > 0.05 for all; Table 3).
Table 2 - Association of latent tuberculosis status with biomarkers by HIV serostatus and LTBI status. I-FABP exponentiated β (95% CI) sCD14 exponentiated β (95% CI) TNF-α exponentiated β (95% CI) IFN-γ exponentiated β (95% CI) IL-2 exponentiated β (95% CI) IL-6 exponentiated β (95% CI) Stratified by HIV and LTBI status Unadjusted HC Reference Reference Reference Reference Reference Reference LTBI 0.99 (0.88, 1.19) 0.96 (077, 1.18) 1.16 (0.89, 1.52) 1.39 (0.78, 2.49) 1.09 (1.00, 1.89) 1.33 (0.84, 2.12) HIV 1.61 (1.34, 1.92) 1.97 (1.58, 2.44) 1.01 (0.78, 1.30) 1.06 (0.59, 1.91) 2.14 (1.07, 2.02) 1.35 (0.86, 2.12) HIV+LTBI+ 1.47 (1.22, 1.22) 1.93 (1.55, 2.41) 1.34 (1.03, 1.75) 1.57 (0.88, 2.80) 1.90 (1.25, 2.33) 1.65 (1.03, 2.61) aFully adjusted HC Reference Reference Reference Reference Reference Reference LTBI 1.03 (0.85, 1.24) 1.01 (0.81, 1.26) 1.19 (0.90, 1.59) 1.16 (0.75, 1.80) 1.24 (0.87, 1.77) 1.35 (0.80, 2.26) HIV 1.55 (1.29, 1.83) 1.81 (1.45, 2.28) 1.12 (0.84, 1.48) 1.08 (0.70, 1.66) 1.32 (0.93, 1.88) 1.52 (0.91, 2.53) HIV+LTBI+ 1.37 (1.19, 1.73) 1.82 (1.45, 2.29) 1.48 (1.11, 1.97) 1.27 (0.81, 1.99) 1.40 (0.98, 2.02) 1.97 (1.17, 3.33) IL-12p70 exponentiated β (95% CI) IL-15 exponentiated β (95% CI) IL-17A exponentiated β (95% CI) IL-4 exponentiated β (95%CI) IL-5 exponentiated β (95% CI) IL-13 exponentiated β (95% CI) Stratified by HIV and LTBI status Unadjusted HC Reference Reference Reference Reference Reference Reference LTBI 1.27 (0.61, 2.64) 1.08 (0.88, 1.35) 1.35 (1.04, 1.76) 1.04 (0.63, 1.72) 1.09 (0.70, 1.68) 1.36 (0.88, 2.12) HIV 0.68 (0.33, 1.40) 1.49 (1.22, 1.82) 1.19 (0.92, 1.55) 1.03 (0.63, 1.68) 2.14 (1.39, 3.29) 0.77 (0.49, 1.19) HIV+LTBI+ 2.18 (1.05, 4.48) 1.59 (1.27, 1.92) 1.42 (1.09, 1.84) 2.10 (1.29, 3.50) 1.90 (1.23, 2.94) 1.60 (1.04, 2.45) aFully adjusted HC Reference Reference Reference Reference Reference Reference LTBI 1.23 (0.55, 2.71) 1.03 (0.82, 1.32) 1.51 (1.12, 2.03) 0.93 (0.54, 1.24) 1.02 (0.62, 1.67) 1.49 (0.90, 1.59) HIV 0.82 (0.37, 1.80) 1.48 (1.16, 1.87) 1.31 (0.97, 1.75) 1.08 (0.63, 1.83) 1.95 (1.20, 3.18) 0.93 (0.84, 1.48) HIV+LTBI+ 2.57 (1.15, 5.70) 1.63 (1.28, 2.08) 1.48 (1.08, 1.95) 2.23 (1.29, 1.73) 2.22 (1.16, 3.12) 1.48 (1.11, 1.97)HIV+LTBI+; HIV+LTBI+, HIV; HIV+LTBI−, LTBI; HIV−LTBI+, and HC; HIV−LTBI−.I-FABP, intestinal fatty acid-binding protein; IFN-γ; interferon gamma; IL, interleukin; sCD14, cluster of differentiation 14; TNF-α, tumor necrosis factor alpha.
aFully adjusted for age, sex, HDL, body mass index, hypertension, body mass index, smoking, and alcohol use, and education status.Results are presented as exponentiated β coefficients and 95% CI. Interpret the coefficient as fold increase in mean level of the biomarkers of interest comparing the groups with HC for example 1.63 will be interpreted as HIV+LTBI+ have 63% higher mean IL-15 level in comparison to HC.Sensitivity analysis restricted to integrase inhibitor users showed similar trend in the association between biomarkers and HIV/LTBI status.
留言 (0)