
記住我
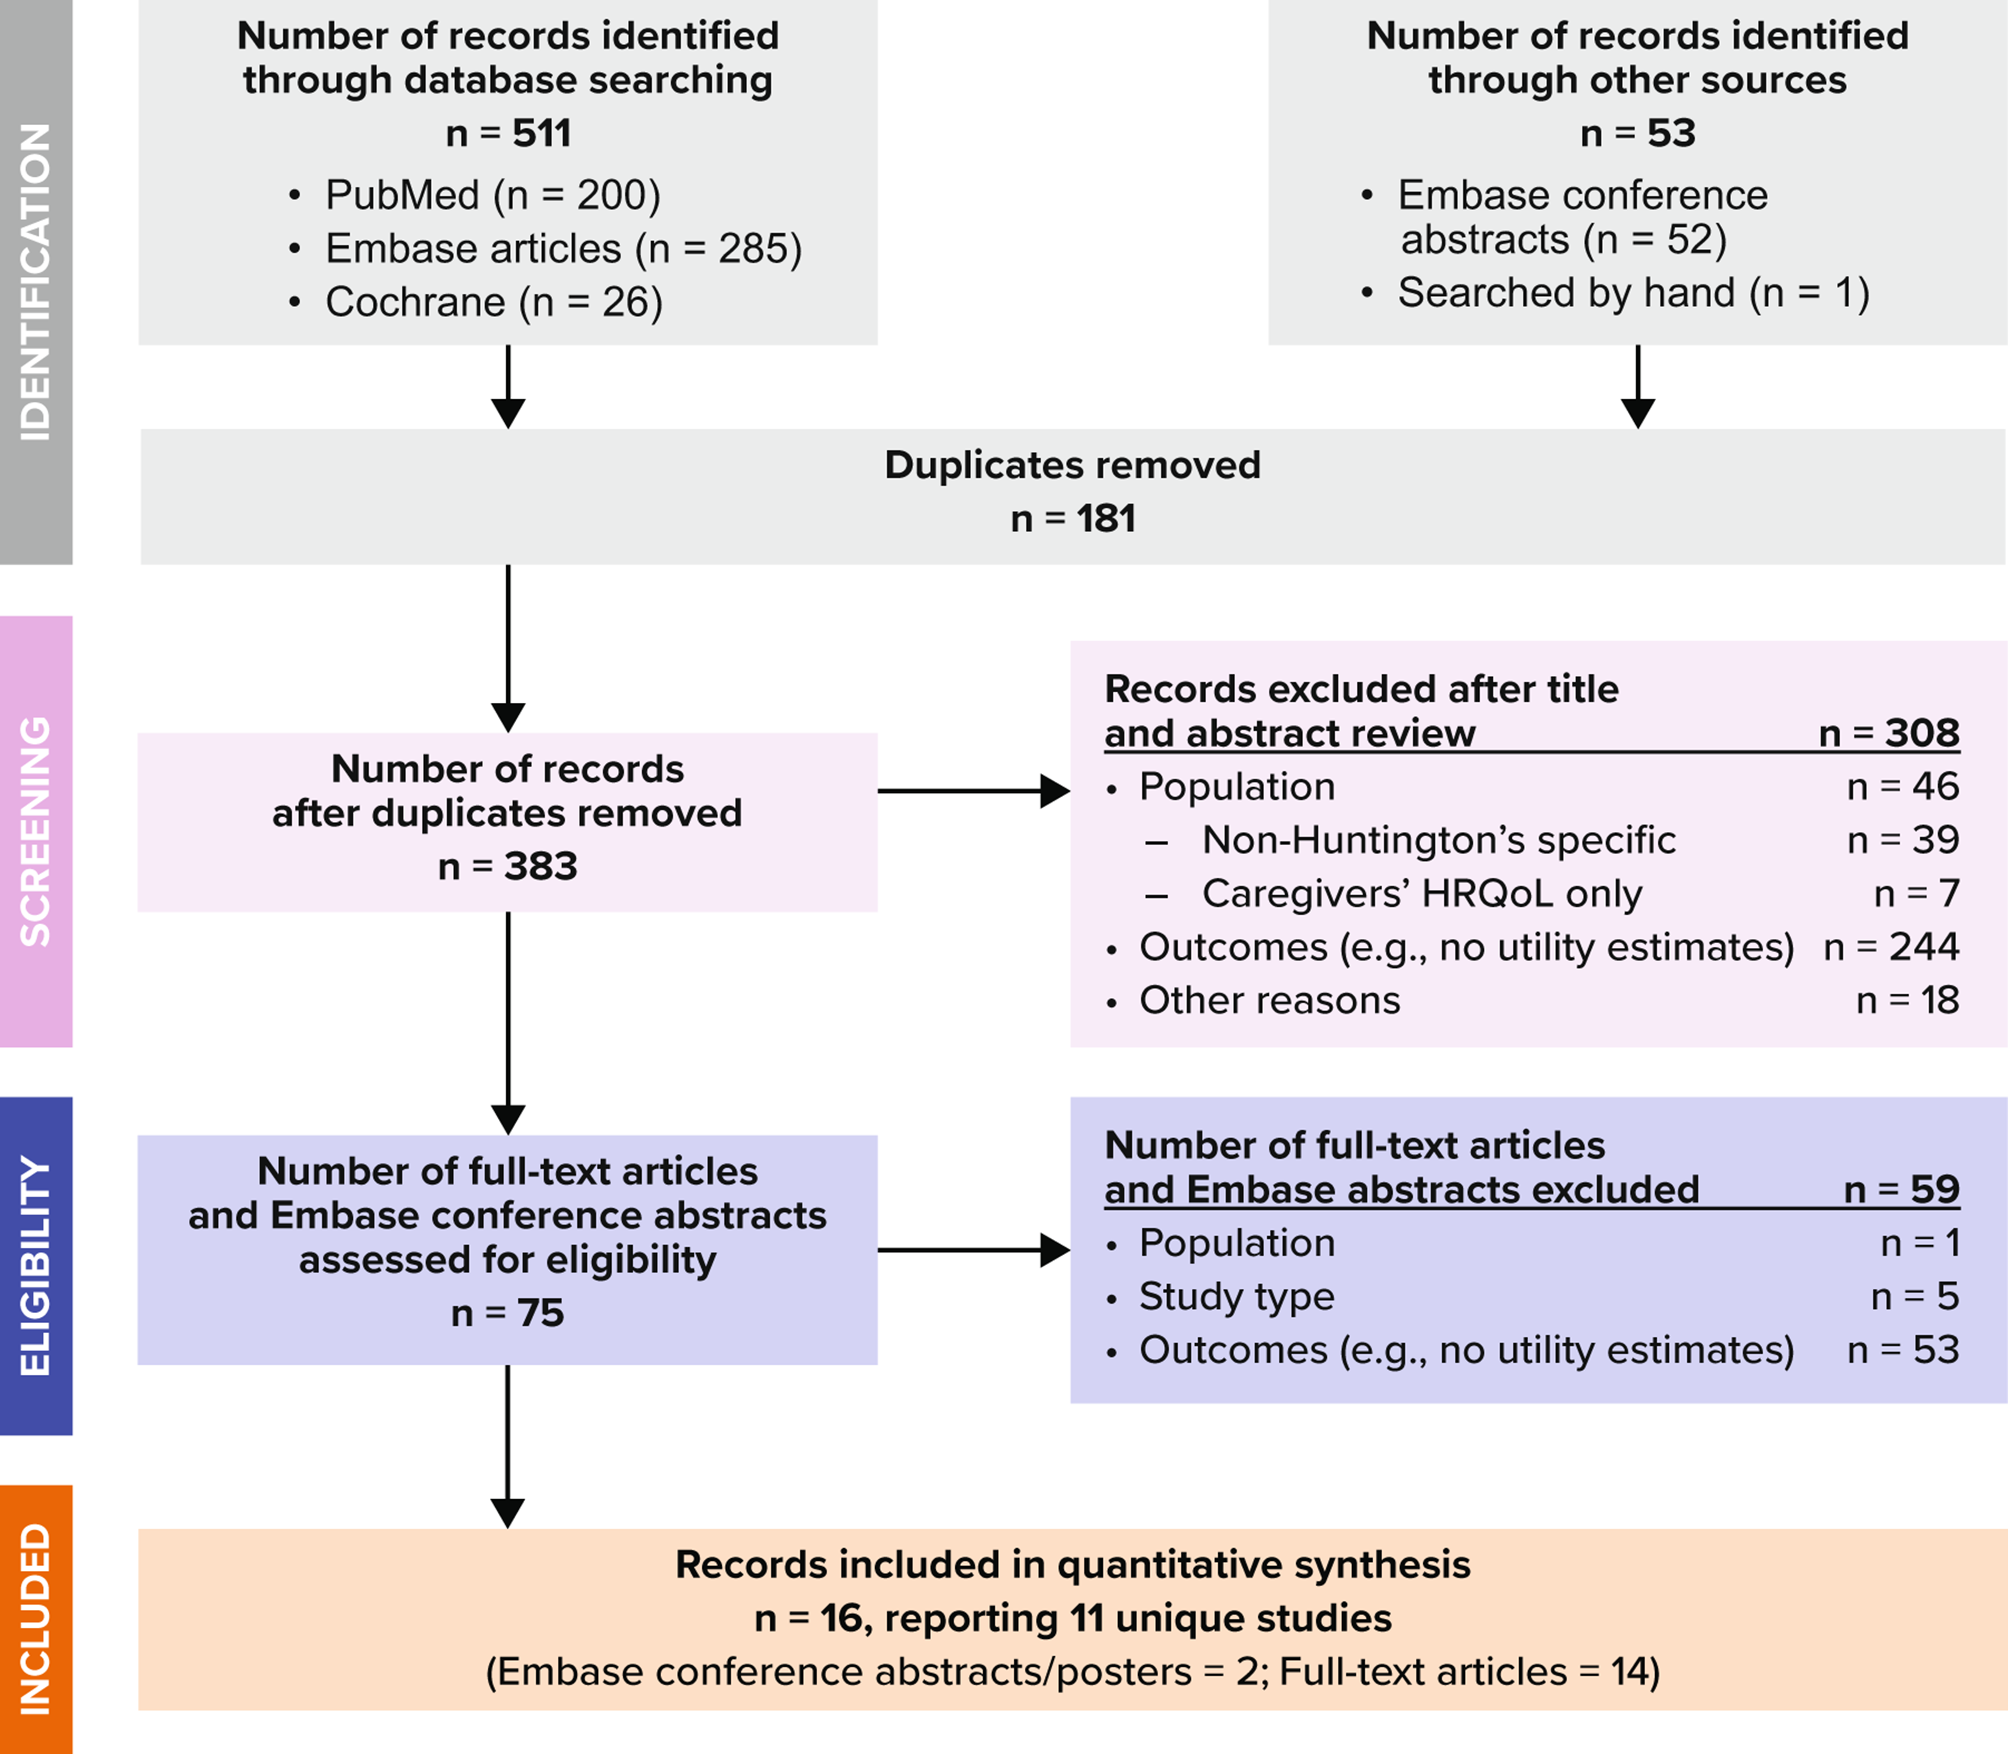
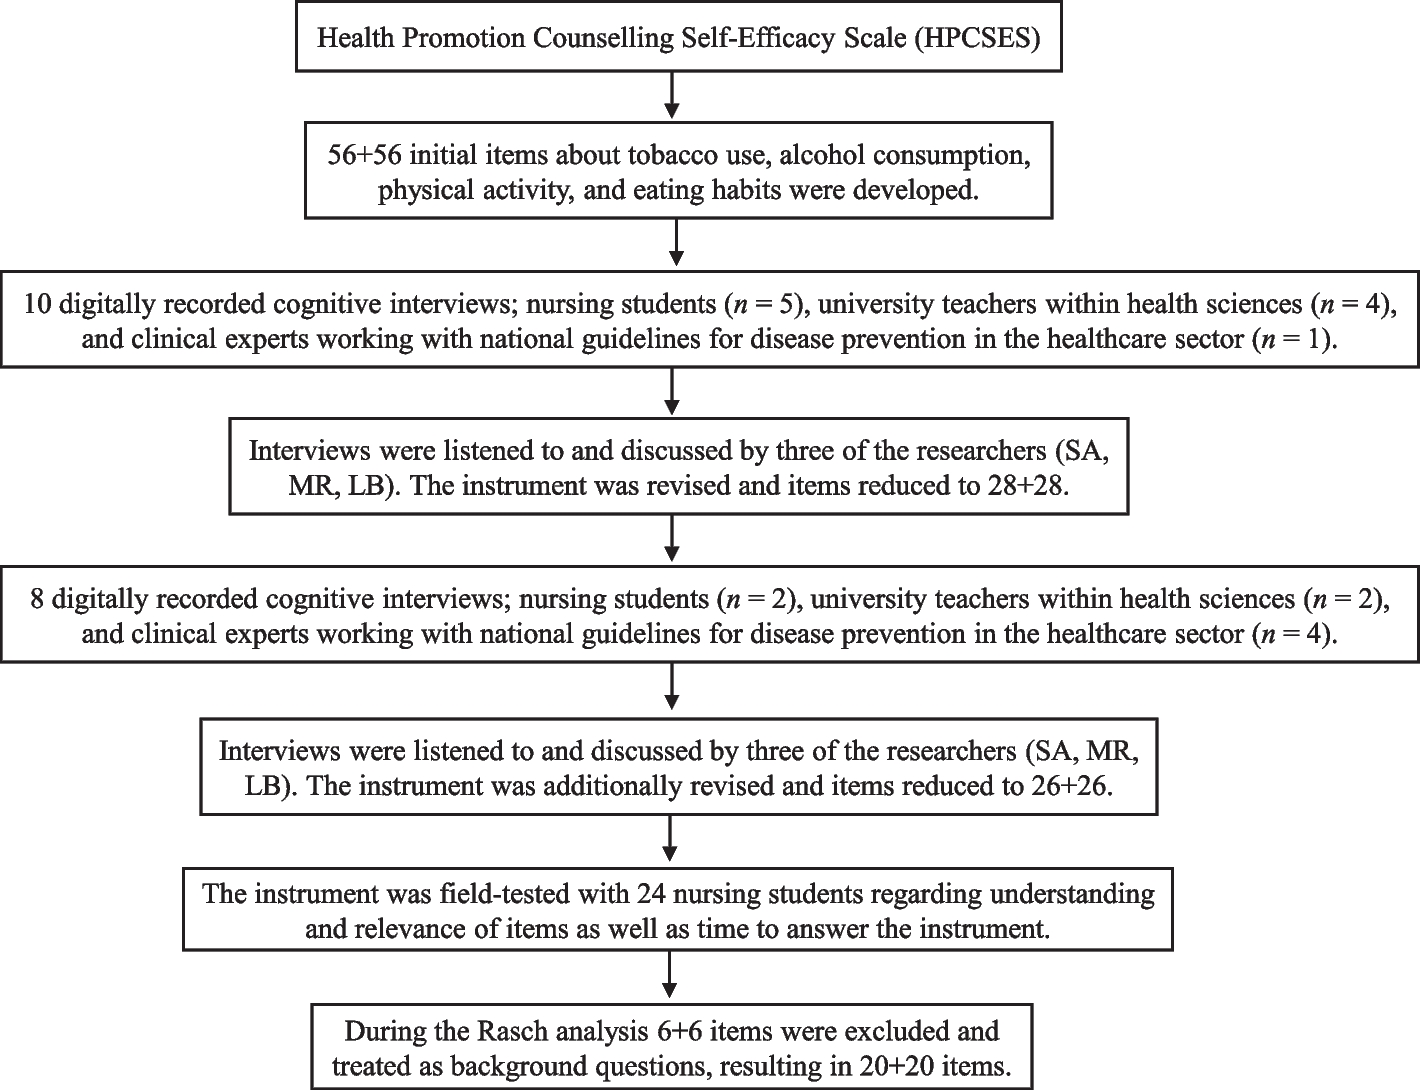
A cross-sectional study was conducted in February-June 2021 at 22 public secondary schools in the Copperbelt Province of Zambia. A total of 1,909 adolescents were assessed for eligibility, 115 (6.0%) were excluded due to being under fixed orthodontic treatment or lack of consent, resulting in the enrollment of 1,794 participants (Fig. 1). The number of participants per school (cluster units) ranged from 43 to 144 (Appendix 2).
Fig. 1
Participants’ enrollment chart
Sample size and sampling procedureThe study reports baseline data from a cluster randomized controlled trial where the sample was estimated to be 1,760 participants, assuming: a 95% confidence level, 85% power, 5% margin of error, 20% expected mean change in dental caries, 0.001 inter-cluster correlation, a cluster size of 80 and a mean DMFT of 1.34 found in a previous study in Zambia [13]. The Copperbelt Province was conveniently selected out of the ten provinces of Zambia at the first stage. The choice of Copperbelt Province was based on fitting the study into existing community dentistry training at the university where the principal investigator is based. The second stage involved proportionate stratified random sampling of three districts out of ten districts in Copperbelt Province; seven being rural and three urban, where Ndola is an urban district while Masaiti and Mpongwe are rural districts. In the third stage, a total of 22 out of 35 public secondary schools were proportionately randomly selected based on the number of schools in each district (21:35, = 13 schools for Ndola district; 8:35, = 5 schools for Masaiti district; and 6:35, = 4 schools for Mpongwe district). In the fourth stage, all adolescents in grades 8 and 9 attending the selected schools were invited to participate in the study.
Survey Instruments and measurementsQuestionnaireA pretested, self-administered paper-based questionnaire constructed in English was used to collect information regarding the C-OIDP and covariates (sociodemographic and oral health behaviors). The questionnaire was pre-tested at one secondary school in Ndola, which was not part of the study, by administering it to 50 adolescents.
Child-oral impact on daily performance (C-OIDP)Psychometric properties of C-OIDPThe participants in the pilot test were requested to provide feedback on the items’ clarity, difficulty, and arrangement as part of the assessment of the face and content validity of the English version of the C-OIDP questionnaire. Construct validity was tested by evaluating the association between other variables that are linked to overall C-OIDP and C-OIDP items, such as self-rated oral health and clinically examined dental caries. The internal consistency of the eight items of the C-OIDP was tested by performing inter-item correlation. A Bonferroni corrected alpha value was obtained by dividing α = 0.05 by the total number of comparison groups in this test. A test-retest reliability study of the C-OIDP was done by re-administration of the C-OIDP questionnaire to 10% of the sample (180 participants).
Assessment of C-OIDPThe Child-OIDP was evaluated by asking participants during the past three months how often the problems with your mouth and teeth caused you any difficulty with eating, speaking, cleaning your teeth, sleeping, smiling, your emotional state, schoolwork, and social contact. Each item was scored as 0 = never, 1 = once or twice per month, 2 = once or twice per week, and 3 = every day or nearly every day. The prevalence of oral impact for each item was computed by dichotomizing scores for each of the eight items into 0 = no impact (score 0) and 1 = with impact (scores 1–3). The overall impact (impact based on all eight items) was obtained by first computing the total of the eight dichotomized frequency scores (min 0, max 8) and then dichotomizing into 0 = no impact (score 0) and 1 = with impact (scores 1–8).
Socio-demographic covariatesParticipant’s sex was recorded as 1 = male and 2 = female, while age was calculated from the date of birth and dichotomized according to World Health Organization (WHO) adolescence categories into 10–14 (early adolescence) and 15–19 (mid and late adolescence)[14]. Parental education was recorded as 1 = no formal education, 2 = primary, 3 = secondary, and 4 = college or university and dichotomized into 1 = up to primary, 2 = secondary, and above. Socioeconomic status (SES) questions were adopted from a standardized International Wealth Index instrument (IWI) [15] and a recent demographic and health survey in Zambia [16]. The questions inquired about possession of one or more of the following assets: television, bicycle, car, plough, and phone. It also inquired on housing conditions such as the type of wall material used, such as mad or cement blocks, and the roof material used, such as animal dung, grass, iron sheets, or concrete. Other components were the type of toilet (flashing toilet, pit latrine, none), water source (piped water, borehole, shallow well), and access to electricity. The scoring of the items was done according to the weights of the items as prescribed by the index, which add up to 74.99553 and a constant of 25.00447. The total IWI scores were computed as a total of the IWI weight scores for the items (minimum 25.00447 and maximum 100), and thereafter the principal component analysis (PCA) was run. The first component, which accounts for the largest proportion of variance, was used as the wealth index. The 25th, 50th, and 75th percentiles of the first component scores guided the categorization of participants into quantiles as follows: below the 25th percentile as the 1st quantile, 25th to 50th percentile as the 2nd quantile, 50th to 75th percentile as the 3rd quantile, and above the 75th percentile as the 4th quantile. Dichotomization into two groups of SES was done by recategorizing the 1st to 3rd quantile as low to middle SES and the 4th quantile as high SES.
Oral health-related behaviorsOral health-related behaviors were assessed in terms of frequency of tooth brushing and use of fluoridated toothpaste per day and coded as , frequency of intake of added sugar-containing diet in the past 30 days coded as . Tooth brushing and use of fluoridated toothpaste were combined to form one variable ‘tooth brushing using fluoridated toothpaste’ and recorded as . The frequency of intake of added sugar-containing food and drinks in the past 30 days was also combined to form a variable ‘frequency of intake of added sugary diet’ and recorded as . Dental visits in the previous year were coded as and dichotomized as .
Self-reported oral health and oral symptomsSelf-reported oral health in terms of the health of gums and teeth was recorded as and dichotomized as . Self-reported oral symptoms in the past three months were recorded as .
Training and calibration of examiners on CAST instrumentThe training of the principal investigator (SA), who is a specialist in restorative dentistry, was facilitated by an experienced epidemiologist (CKN). The training included instructions on how to conduct examinations, report findings, and interpret results, as well as the justification behind CAST codes and their descriptions. In the initial calibration stage, 20 clinical images representing two or more of each of the nine CAST codes were used. In the second calibration stage, 15 pre-selected adolescents with various CAST codes on one or more teeth were examined. The first five pre-selected adolescents were examined by each PI (SA) and the calibrator (CKN), and the findings were then compared. The differences were reviewed, and the second and third groups of five adolescents were then examined. Following the same procedure, the principal investigator (SA) trained and calibrated the examiners. A detailed explanation is provided in Appendix 3.
Oral clinical examinationAn oral examination was conducted inside the classrooms by four trained and calibrated dentists, with adolescents sitting on a desk opposite the classroom windows. Permanent teeth were examined according to the Caries Assessment Spectrum and Treatment (CAST) index [17] and coded as . CAST 0–2 were categorized as healthy, CAST 3–4 as pre-morbidity, CAST 5 as morbidity, CAST 6–7 as severe morbidity, and CAST 8 as mortality. The prevalence of dental caries was defined according to the CAST manual as any participant with one or more teeth at CAST stages 3 to 7 [17].
Statistical analysisData entry, cleaning, and analysis were done using Stata/SE (version 17). Descriptive data on independent variables, including self-reported and clinically determined dental caries, were dichotomized and summarized as frequencies and percentages. These variables included demographics of the adolescents, such as age and sex, parental/guardian socio-demographics, such as parental education and socioeconomic status, oral health-related behaviors, such as frequency of intake of added sugary foods, dental visits in the past year, and tooth brushing with fluoridated toothpaste. Inter-correlations between C-OIDP were reported as Spearman’s correlation coefficients. All the p values of the 28 pairwise correlations were compared with the Bonferroni corrected alpha value (p < 0.002). Cohen’s Kappa (n = 180) was used to evaluate the test-retest reliability of C-OIDP items by re-administering the inventory to every 10th participant at an interval of 10 days. Internal consistency reliability of C-OIDP was assessed by Cronbach’s alpha. The Kappa coefficient was used to assess the intra- and inter-examiner consistency in examining dental caries. The chi-square test was used to compare impacts among those with and without clinically assessed and self- reported dental caries. The minimal set of covariates for adjustment was assessed based on DAG [Fig. 2]. Dagitty software [18] was used to select the minimum set of covariates for adjustment of confounders. Hierarchical logistic regression (adjusted for clusters) was performed to examine the association between dental caries and C-OIDP. Distal factors (adolescents’ age and sex) were entered at the first stage. The proximal factors (tooth brushing using fluoridated toothpaste, frequency of consuming sugary diet and dental visits in the past year) were entered at the second stage, while dental caries was entered at the third stage. Adjusted odds ratios (AOR) with a 95% confidence interval (CI) were used to present the results.
Directed Acyclic Graphs (DAGs)The study used directed acyclic graphs (Fig. 2) to illustrate the underlying association between dental caries and C-OIDP while considering socio-demographic and oral health-related covariates that might influence the association [19]. In summary, dental caries was assumed to have a direct effect on C-OIDP. Proximal factors such as oral health-related behaviors in terms of tooth brushing and use of fluoridated toothpaste frequency, sugary food consumption, and dental visit frequency were assumed to have direct effects on C-OIDP and indirect effects through dental caries. Distal factors (socio-demographics) were assumed to have indirect effects on C-OIDP mediated through more proximal individual oral health-related behaviors. A detailed description of the assumed pathways in the DAG (Fig. 2) is provided in the appendices (Appendix 1).
Fig. 2
Directed acyclic graph (DAG) illustrating relationship between dental caries and C-OIDP
留言 (0)