
記住我


Initially, we optimised COVID-19 IHC and RNAscope tests in positive control FFPE macaque tissue.3 Both tests were highly sensitive and specific in detecting SARS-CoV-2. SARS-CoV-2 was detected as expected by IHC and RNA-ISH in positive macaque control material (figure 2A,B). No evidence of SARS-CoV-2 by either IHC or RNA-ISH was seen in retrospective lung biopsy and lung cytology FFPE material (figure 2C,D,F,G). RNA integrity was confirmed with positive control probe UBC (figure 2E,H).
 Figure 2
 (A) Representative images showing SARS-CoV-2 nucleoprotein expression and (B) V-nCoV2019-S mRNA in FFPE macaque tissue. (C) Absence of SARS-CoV-2 nucleoprotein expression is depicted in lung biopsy FFPE and (F) lung cytology FFPE. (D) Absence of V-nCoV2019-S mRNA expression is depicted in lung biopsy FFPE and (G) lung cytology FFPE. (E) Positive control probe UBC mRNA expression is depicted in lung biopsy FFPE (reagent kit-BROWN) and (H) lung cytology FFPE (reagent kit-RED). All images are ×10 magnification, with exploded views at ×40. FFPE, formalin-fixed, paraffin-embedded.
All 64 clinically non-COVID-19 lung biopsy or cytology samples were negative for SARS-CoV-2 by IHC or RNAScope. In 7/50 cytology cell blocks, there was no expression of the RNAScope positive control probe UBC.
COVID-19 RNA and protein signals were not present in non-COVID-19 autopsy cases (cases 3 and 4). As depicted in figure 3, in autopsy case 1, numerous, scattered viral signals were identified by both IHC and RNAScope probe. Autopsy case 2 showed no positive IHC or RNA-ISH signals.
 Figure 3
 (A–C) Representative images showing H&E staining from COVID-19 autopsy case 1, (D–F) V-nCoV2019-S RNAScope and (G–I) SARS-CoV-2 nucleoprotein expression in three regions of FFPE autopsy tissue. All images are ×10 magnification, with exploded views at ×20. FFPE, formalin-fixed, paraffin-embedded.
To test our protocol for future analysis of inflammation associated with specific detectable portions of viral RNA or protein, we validated IHC and RNA-ISH detection in the context of DAB dual-plex and mIF, which was able to robustly detect SARS-CoV-2 in the macaque model and clinical autopsy 1 (online supplemental figure S1).
Capturing the immune microenvironment with multiplex IHC fluorescenceApplication of multiplex immunofluorescent panels in autopsy material, previously optimised for our immune oncology studies,6 7 enabled us to delineate a range of immune cell phenotypes within COVID-19-positive material. To depict this visually, we chose two ends of the spectrum, namely, (1) an area of minimal chronic interstitial inflammation (figure 4) and (2) a heavily inflammed area (figure 5). Here we specifically quantifed total cell number and denisty per square millimetre for each biomarker and were able to analyse comparative expression of cell types using our robust digitial pathology workflow.
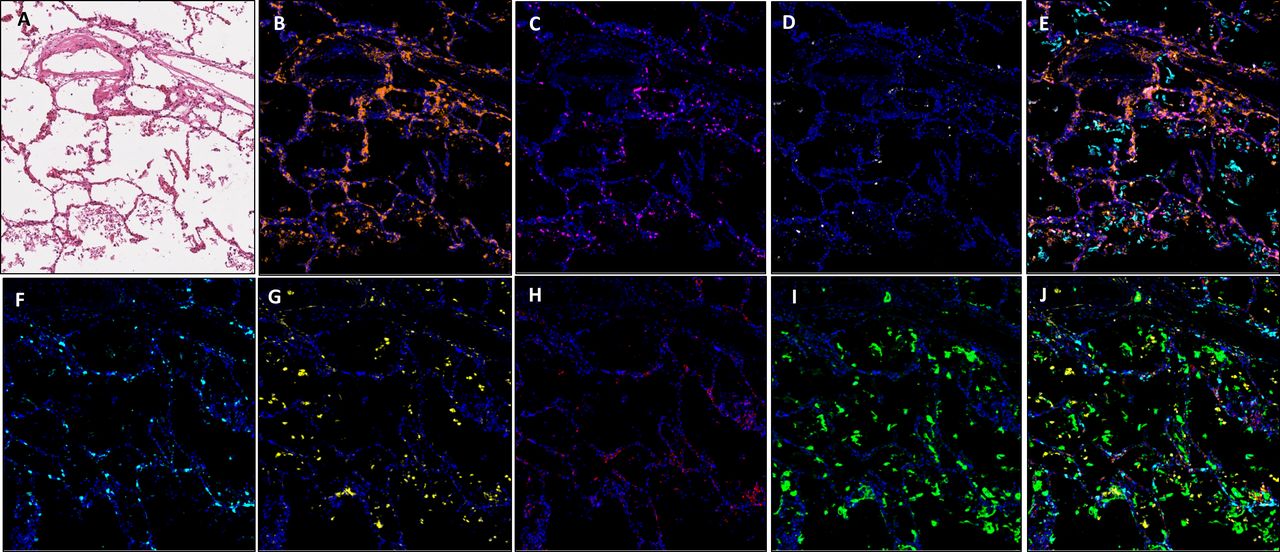 Figure 4
 Images showing an area of minimal chronic interstitial inflammation in COVID-19 lung FFPE autopsy tissue case 1. (A) H&E; (B) CD3 (2GV6, orange); (C) CD4 (SP35, purple); (D) CD20 (L26, white); (E) composite CD3/CD4/CD20/CK and DAPI; (F). CD8 (C8/144B, aqua); (G). CD68 (514H12, yellow); (H) PD-L1 (SP263, red); (I) CK (AE1/AE3, green); and (J) composite CD8/CD68/PD-L1/CK and DAPI. All images are ×20 magnification. FFPE, formalin-fixed, paraffin-embedded.
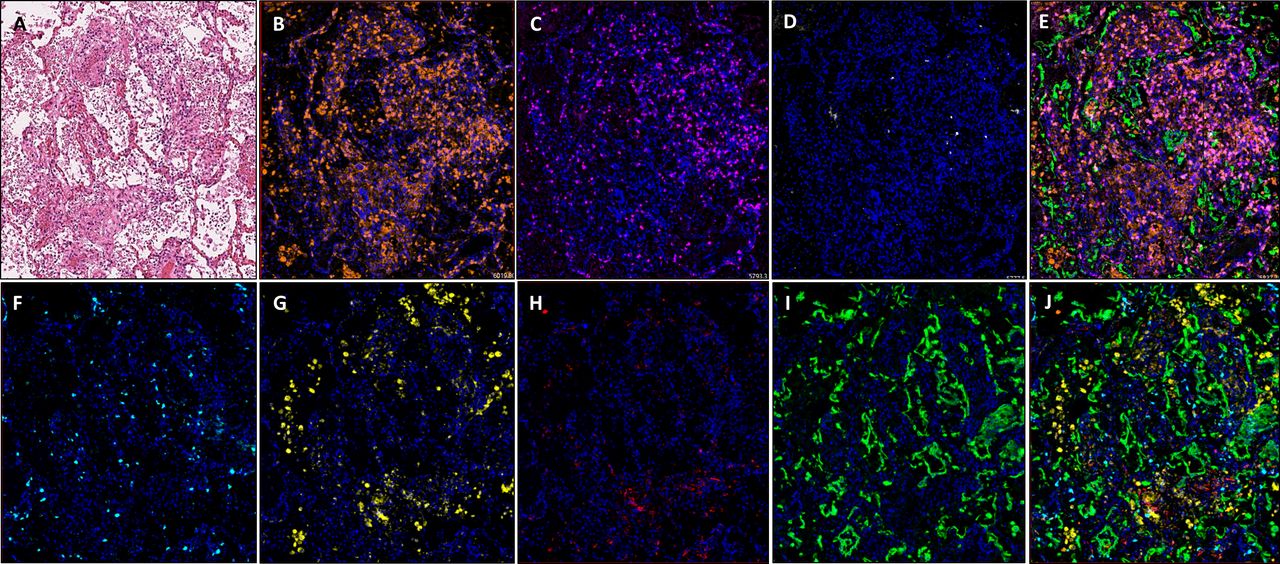 Figure 5
 Images showing diffuse damage in COVID-19 lung FFPE autopsy tissue. (A) H&E, (B). CD3 (2GV6, orange); (C) CD4 (SP35, purple); (D) CD20 (L26, white); (E) composite CD3/CD4/CD20/CK and DAPI; (F) CD8 (C8/144B, aqua); (G) CD68 (514H12, yellow); (H) PD-L1 (SP263, red); and (I) CK (AE1/AE3, green); and (J) composite CD8/CD68/PD-L1/CK and DAPI. All images are ×20 magnification. FFPE, formalin-fixed, paraffin-embedded.
In comparison to normal/near normal areas within COVID-19-positive case 2, ROIs representing diffuse damage contained a markedly increased expression of CD3, CD4 and CD68, in terms of density per square millimetre (online supplemental file 1). It was observed that while there was an increase in overall cell density in the ROI representing diffuse damage, the percentage distribution between ROIs was similar (figure 6). The exception to this observation was a marked reduction in overall percentage of CD8-positive cells, which fell from 17.8% in the minimal chronic interstitial inflammation ROI to 5.7% in the areas with diffuse inflammatory damage (figure 6B).
 Figure 6
 Bar graphs representing the density of immune cells per square millimetre represented as a percentage in COVID-19-positive and COVID-19-negative cases. Areas of normal/near normal, viral syncytium, extensive inflamation/pneumonia, vascular changes and established hyaline membrane formation are shown for (A) case 1, (B) case 2, (C) case 3 and (D) case 4. CD3, blue; CD4, orange; CD8, grey; CD68, yellow; CD20, green.
As expected, areas of extensive pneumonia and oedema have a high density of CD68 expressing macrophages. In areas displaying vascular chages in all samples, the highest expressed markers in our panel were CD3 and CD4. In all ROIs, density of CD8-positive cells was higher in areas of normal/near normal when compared with areas of substantial change, that is, viral syncytium, extensive inflamation/pneumonia, vascular changes and established hyaline diffuse damage membrane formation (figure 6). These changes in immune cell phenotype across ROIs was as much as fivefold different (online supplemental figure S2).
The diversity of phenotypes when comparing SARS-CoV-2 positive cases with non- SARS-CoV-2 cases, in ROIs of vascular change is striking. Across all immune cells assessed (CD3, CD4, CD8, CD68 and D20), SARS-CoV-2-positive cases had a far higher total positive cell density compared with non-SARS-CoV-2 cases (positive cases 1 and 2: 909.6 mm2 and 801.23 mm2, respectively. Non-SARS-CoV-2 cases 3 and 4: 100.1 and 140.1 mm2, respectively).
Taken together, the T-cell and macrophage expressions seen within the vascular change ROIs in SARS-CoV-2 versus non- SARS-CoV-2 are also contrasting. In SARS-CoV-2-positive cases, there was a combined CD3 density of 904.62 mm2 (527.6 and 377.01 mm2 in each case), yet in both non-SARS-CoV-2 cases, the density of CD3 was greater than 10 times lower at 78.41 mm2 (33.36 and 45.05 mm2 in each case). This dichotomy in inflammation in SARS-CoV-2 versus non- SARS-CoV-2 cases was observed across immune markers: CD4 (255.48 mm2 vs 90.11 mm2), CD8 (113.52 mm2 vs 21.21 mm2) and CD68 (383.51 mm2 vs 50.45 mm2).
We only observed an identifiable increase in expression of B cells in one SARS-CoV-2-positive case. Case 1, in comparison to areas of normal/near normal (normal: 5.9 mm2, vascular change 33.7 mm2) showed a 570% increase in expression. While this was not observed in case 2, this may be explained by a contrasting clinical time course of COVID-19 between each patient. CD20 expression was not seen in non-COVID-19 cases. For each biomarker in the two multiplex panels, individual cells were identified with the same sensitivity and specificity as we have observed in lung cancer tissue studies.
留言 (0)