
記住我


Chronic pain is one of the most prevalent and cost-intensive health conditions worldwide.116 In this context, the inherently subjective nature of experiencing pain has long been recognized as a key issue when dealing with chronic pain in clinical and research settings.119 To improve assessment and guide treatment of chronic pain, the quest for objective measures of acute and chronic pain has gained increasing attention.14 For these purposes, the development of reliable and objective biomarkers of chronic pain has become a key challenge in pain research.64 In line with the complexity of pain, there is an increasing awareness that there may not be a single, uniform biomarker but that different biomarkers subserving different functions, eg, for the diagnosis, monitoring, prognosis, and prediction of treatment responses may be needed to best capture pain.9
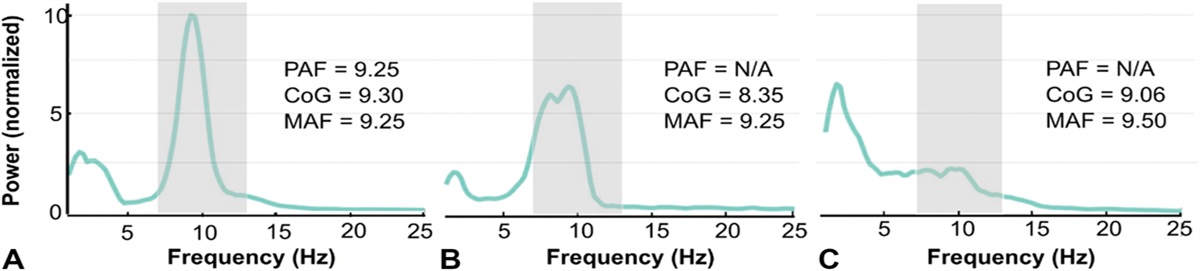
Over the past decades, alterations in brain structure and function, ranging from the molecular to the network level, have been increasingly recognized in patients with chronic pain.53 Consequently, neuroimaging methods have been used to develop noninvasive, brain-based biomarkers of chronic pain. Electroencephalography (EEG) has gained attention as an easy-to-use and cost-efficient tool to assess brain function with a high temporal resolution in chronic pain. Electroencephalography is complemented by magnetoencephalography (MEG). Magnetoencephalography measures brain signals closely related to EEG. However, MEG is technically more demanding and less cost-efficient. Both methods have been used to investigate changes in oscillatory brain activity and functional connectivity at different frequencies as potential biomarkers of chronic pain. In particular, slowing of the peak frequency in the alpha band (8-13 Hz)21,96 and increases of oscillatory brain activity at theta frequencies (4-8 Hz)69,76,100 have been reported and discussed. However, M/EEG approaches are not standardized, and results are heterogeneous and inconsistent.
Here, we aimed at synthesizing the available evidence on resting-state M/EEG as biomarkers of chronic pain in adult humans. To this end, we conducted a systematic review of cross-sectional and longitudinal studies of patients with chronic pain using resting-state M/EEG as a measure of brain function. These studies can particularly serve the development of diagnostic, monitoring, and predictive biomarkers of chronic pain.
2. MethodsThis review was conducted and is reported in accordance with the most recent Preferred Reporting Items for Systematic Reviews and Meta-Analyses guidelines (PRISMA77). The project protocol was registered on PROSPERO on September 10, 2021 (CRD42021272622). Deduplication of records, title and abstract screening, full-text review, and data extraction were conducted using Covidence software.12
2.1. Search strategyThe databases MEDLINE (through PubMed), Web of Science Core Collection (through Web of Science), Cochrane Central Register of Controlled Trials (through Ovid), and EMBASE (through Ovid) were searched on September 15, 2021. All searches were repeated before the final analysis on December 29, 2021. No historical limit was applied, and no filters for study type were used. For EMBASE, we excluded conference proceedings. In addition, we screened reference lists of included studies and personal files for further relevant publications.
The search string combined “electroencephalography” or “magnetoencephalography” and related terms with “chronic pain” and specifiers for several relevant chronic pain conditions, which do not entail “chronic pain” in their name (eg, fibromyalgia or postherpetic neuralgia). To this end, we searched the recently published International Association for the Study of Pain classification system of chronic pain conditions108 for relevant diagnostic entities and terms. The complete search strategy is available in the supplementary material (available at https://links.lww.com/PAIN/B751).
2.2. Study selectionStudy inclusion and exclusion criteria are presented in Table 1. In summary, we included peer-reviewed studies that used quantitative resting-state M/EEG to analyze brain activity in chronic pain conditions. We excluded studies in patients with primary headache conditions or severe psychiatric/neurologic comorbidity because abnormalities in resting-state M/EEG that are unrelated to chronic pain have been found in migraine,78 severe depression,17 and neurodegenerative disease.99
Table 1 - Inclusion and exclusion criteria. Inclusion (included, if all apply) Exclusion (excluded, if any applies) Published, peer-reviewed study Review article or case report Chronic pain primary condition studied Primary headache condition M/EEG during resting state Severe psychiatric or neurologic comorbidity Reporting of quantitative M/EEG data Human participants ≥18 yM/EEG, magneto-/electroencephalography.
Two authors (P.T.Z., M.P.) screened titles and abstracts for eligibility blinded to each other's decisions. In case of disagreement, a third researcher (V.D.H.) was consulted, and conflicts were discussed. The same procedure was followed for full-text review. Data extraction was performed by one author (P.T.Z.) and checked by another author (V.D.H.). Extracted data comprised quantitative M/EEG measures (peak alpha frequency [PAF], frequency-specific power, frequency-specific connectivity), patient characteristics (sample size, sex, age, diagnostic entity, type of pain [nociceptive, neuropathic, nociplastic, mixed], pain intensity), and study design according to the study by Grimes and Schulz.34
2.4. Data synthesis strategyFor data synthesis, we grouped the studies according to study designs. By doing so, we were able to relate study designs to different types of biomarkers according to the Biomarkers, EndpointS, and other Tools-initiative9 (see Table 2 for an overview of study and biomarker types). Cross-sectional studies (comparison of patients and healthy participants) can serve the development of diagnostic biomarkers of chronic pain. Longitudinal studies (longitudinal descriptive, randomized and nonrandomized studies) can help to develop biomarkers for the monitoring of chronic pain and, in few cases, for the prediction of treatment responses. Descriptive studies correlating M/EEG with pain intensity in a single assessment can be useful to establish biomarkers for the diagnosis and monitoring of chronic pain.
Table 2 - Study designs and biomarker types. Study design BEST biomarker(s) Cross-sectional observational Diagnostic Longitudinal descriptive Monitoring Longitudinal randomized and nonrandomized controlled trial Monitoring, predictive (treatment response) Descriptive Diagnostic/monitoring BEST, Biomarkers, EndpointS, and other Tools9Due to the reported outcome measures and the high level of heterogeneity of study designs, a formal meta-analysis was not feasible. For instance, for cross-sectional comparisons of theta power, 47% of all included studies, 79% of studies with negative results, and 23% of studies with positive results did not report the required parameters for meta-analysis. Hence, formal meta-analysis would have introduced a reporting bias. Therefore, we used vote-counting and modified albatross plots36 for semiquantitative data synthesis. By plotting P values against sample sizes for different directions of effects, albatross plots allow for graphically estimating effect sizes for studies with similar research questions (eg, is there a difference in alpha power between patients with chronic pain and healthy participants?). However, because included studies used heterogeneous statistical methods for hypothesis testing, we did not superimpose effect size estimation contours on the plots. Modified albatross plots were used for comparison of PAF, frequency-specific power, and frequency-specific connectivity at theta (4-8 Hz), alpha (8-13 Hz), beta (13-30 Hz), and gamma (30-80 Hz) frequencies in cross-sectional (diagnostic biomarker), longitudinal (monitoring biomarker), and descriptive studies (monitoring/diagnostic biomarker). For graphical presentation of longitudinal study results, we only included studies that reported pain relief. In case of multiple P-values for different regions of interest in a single study, we reported the lowest P value. P values were displayed as reported in the primary studies, independently of possible adjustment for multiple comparisons. In case of imprecise reporting of P values (eg, “P < 0.05”), we chose the nearest decimal (eg, “P = 0.049”) for graphical representation in albatross plots.
When summarizing results across studies for a certain parameter (eg, theta power in cross-sectional studies), we focused on vote counting and labeled results as positive, if more studies were found for either the “lower” or “higher” category compared with the “nonsignificant” and the respective other category.
For studies reporting quantitative M/EEG measures other than the aforementioned variables (eg, microstate analysis or machine learning algorithms) and/or using M/EEG as a predictive biomarker, narrative data synthesis was performed due to the low overall number of studies and high heterogeneity of methods and outcome measures.
2.5. Risk of bias and quality assessmentRisk of bias and study quality were assessed using a modified version of the Newcastle–Ottawa Scale117 adapted by Pinheiro et al.87 for EEG studies on pain. This tool assesses risk of bias and quality of studies included in systematic reviews and/or meta-analyses across the domains “selection of study participants” (4 items), “comparability/confounders” (2 items), and “outcome data” (3 items). Although in the original version stars are awarded for single domains, we rated items as “high” (negative for study quality) or “low” (positive for study quality) risk of bias because this allows for easier interpretation of scoring results. We did not calculate sum scores for single studies because single items had frequently to be scored “n/a” (not applicable), and comparison of sum scores across studies would have been misleading.
Furthermore, we evaluated all included studies regarding adherence to core open science principles (preregistration, sample size calculation, correction for multiple testing, and sharing of primary data and code).
Risk of bias and quality assessment was performed by one author (P.T.Z.) and checked by another author (V.D.H.).
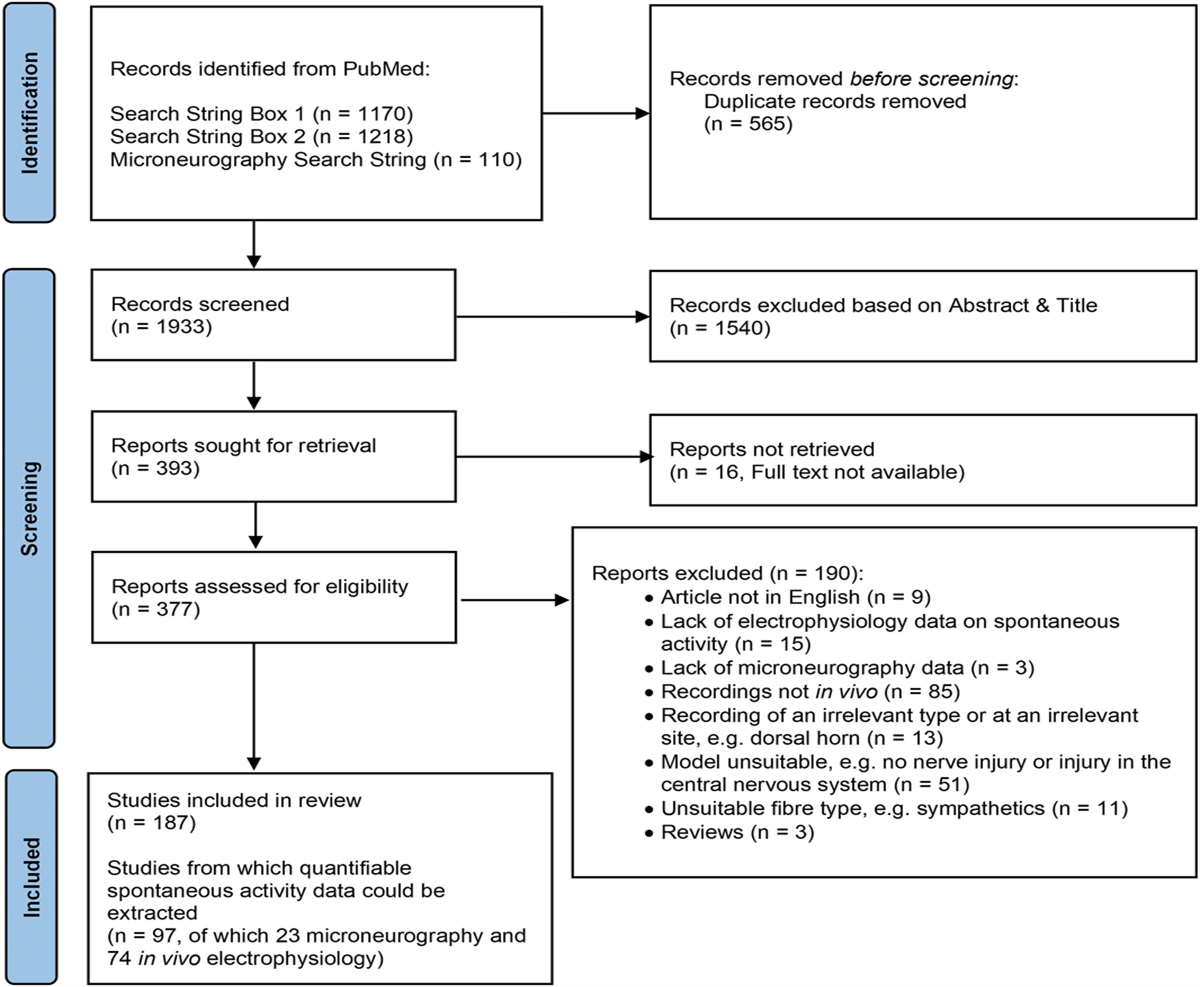
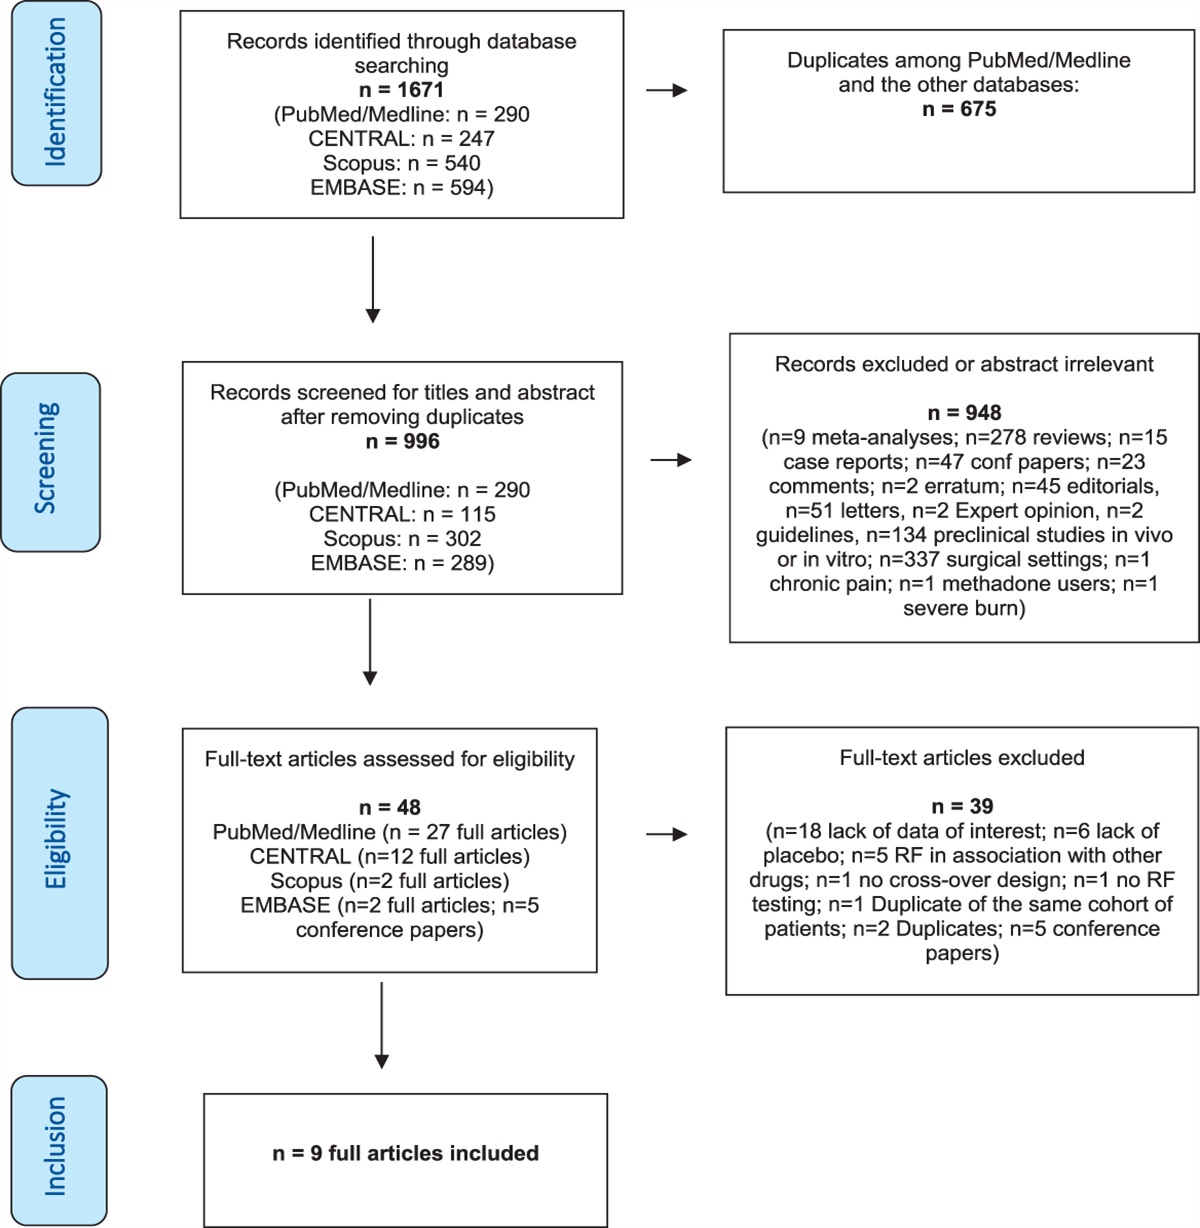
3. Results 3.1. Study selectionSearching databases resulted in 2430 results after deduplication. We added 2 more studies from citation screening and personal records. Following title and abstract screening, 141 studies were identified for full-text review. Finally, 76 studies were included.1,5–8,10,11,15,16,18–27,30–33,35,37–49,51,56,59,60,63,66–69,74–76,79,80,82,89–91,95–98,100–105,109,110,112–115,120,122,124–126Figure 1 depicts the PRISMA flow diagram of study selection along with reasons for study exclusion at every stage.
 Figure 1.:
 PRISMA flow diagram of study selection. CP, chronic pain; EEG, electroencephalography; PRISMA, preferred reporting items for systematic reviews and meta-analyses; RS, resting state; qM/EEG, quantitative M/EEG.
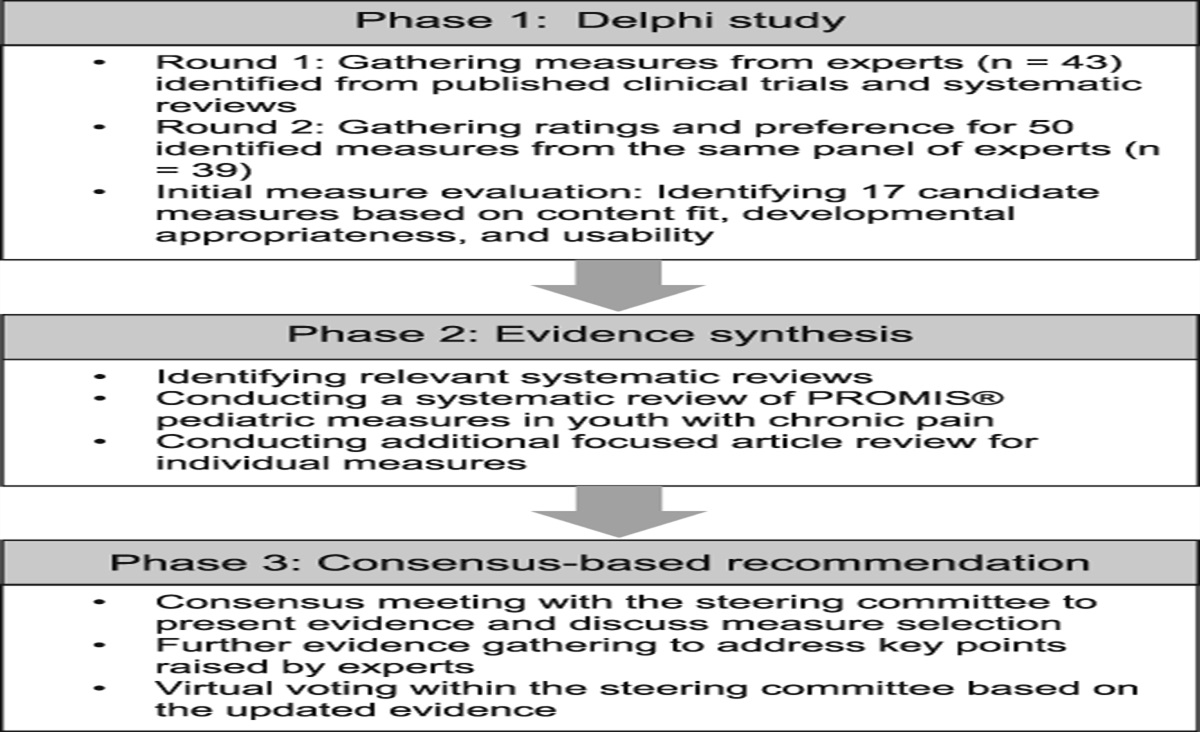
3.2. Study characteristicsFigure 2 and Table 3 summarize the main characteristics and results of included studies. Thirty-two studies were conducted in patients with mixed pain, 26 in patients with neuropathic pain and 18 studies in patients with nociplastic pain (mainly fibromyalgia). Most studies used EEG (n = 66), whereas only few studies used MEG (n = 10). The most frequent study type was cross sectional (n = 41; comparing patients to healthy participants), followed by longitudinal descriptive studies (n = 17; longitudinal tracking of patients). Five studies comprised different study designs, ie, cross-sectional comparison of patients and healthy participants at baseline and longitudinal tracking of patients. Longitudinal studies included controlled and noncontrolled interventional designs and were heterogeneous regarding the type of intervention (Table 3). The most frequent interventions were noninvasive neuromodulation, cognitive–behavioral therapy, surgery, and pharmacological approaches. Sample sizes varied between 10 and 342 participants (median 38.0, see Fig. S1, https://links.lww.com/PAIN/B751 for a graphical illustration). In cross-sectional studies, these sample sizes included not only patients but also the sum of patients and healthy participants. Studies were published between 1999 and 2021 (Fig. S2, https://links.lww.com/PAIN/B751).
 Figure 2.:
 Pain type, recording modality, and study designs of included studies. The charts show absolute numbers of studies. EEG, electroencephalography; MEG, magnetoencephalography.
Table 3 - Characteristics of included studies. Author and year Study design Intervention EEG/MEG Condition Type of pain Total sample size Pain duration (mo) Pain intensity (0-10) Main results (EEG/MEG analysis) Ahn et al. 20191 (Randomized) controlled trial tACS vs sham EEG Back pain Mixed 20 84.8 4.4 Negative correlation between somatosensory alpha power and pain intensity
留言 (0)