Reagents and chemicals
Tan IIA was purchased from Beijing Bethealth People Biomedical Technology (Beijing, China; purity ≥ 98%). Complete Freund's adjuvant (CFA) was purchased from Becton, Dickinson and Company (USA). Foetal bovine serum was obtained from Corning (USA), and penicillin/streptomycin was obtained from Thermo Fisher (USA). RANKL was obtained from Novoprotein (Suzhou). Cell fixative was obtained from Biorigin (Beijing). The Tartrate-Resistant Acid Phosphatase (TRAP) Stain Kit was obtained from Solarbio (Beijing). Actin-Tracker Red-Rhodamine was obtained from Beyotime Biotechnology (Beijing). A lactate dehydrogenase assay kit was obtained from Solarbio (Beijing). The NAD/NADH assay kit was obtained from BioXcellence (Beijing). Rabbit anti-mouse IgG was obtained from Abcam (Beijing). The desthiobiotin iodoacetamide (DBIA) probe was obtained from ChomiX Biotech (Nanjing). The following click chemistry reaction and LC‒MS/MS reagents were used in this study: TBTA (1770049), TCEP (C4706), rhodamine-N3 (83689) and CuSO4 (C1297) were purchased from Sigma (USA); TMT 10plex™ reagent (A34808), high-capacity neutravidin agarose resin (A53031) and sequencing grade modified trypsin (90057) were purchased from Thermo Fisher (USA).
Adjuvant-induced arthritis (AIA) rats and Tan IIA treatment
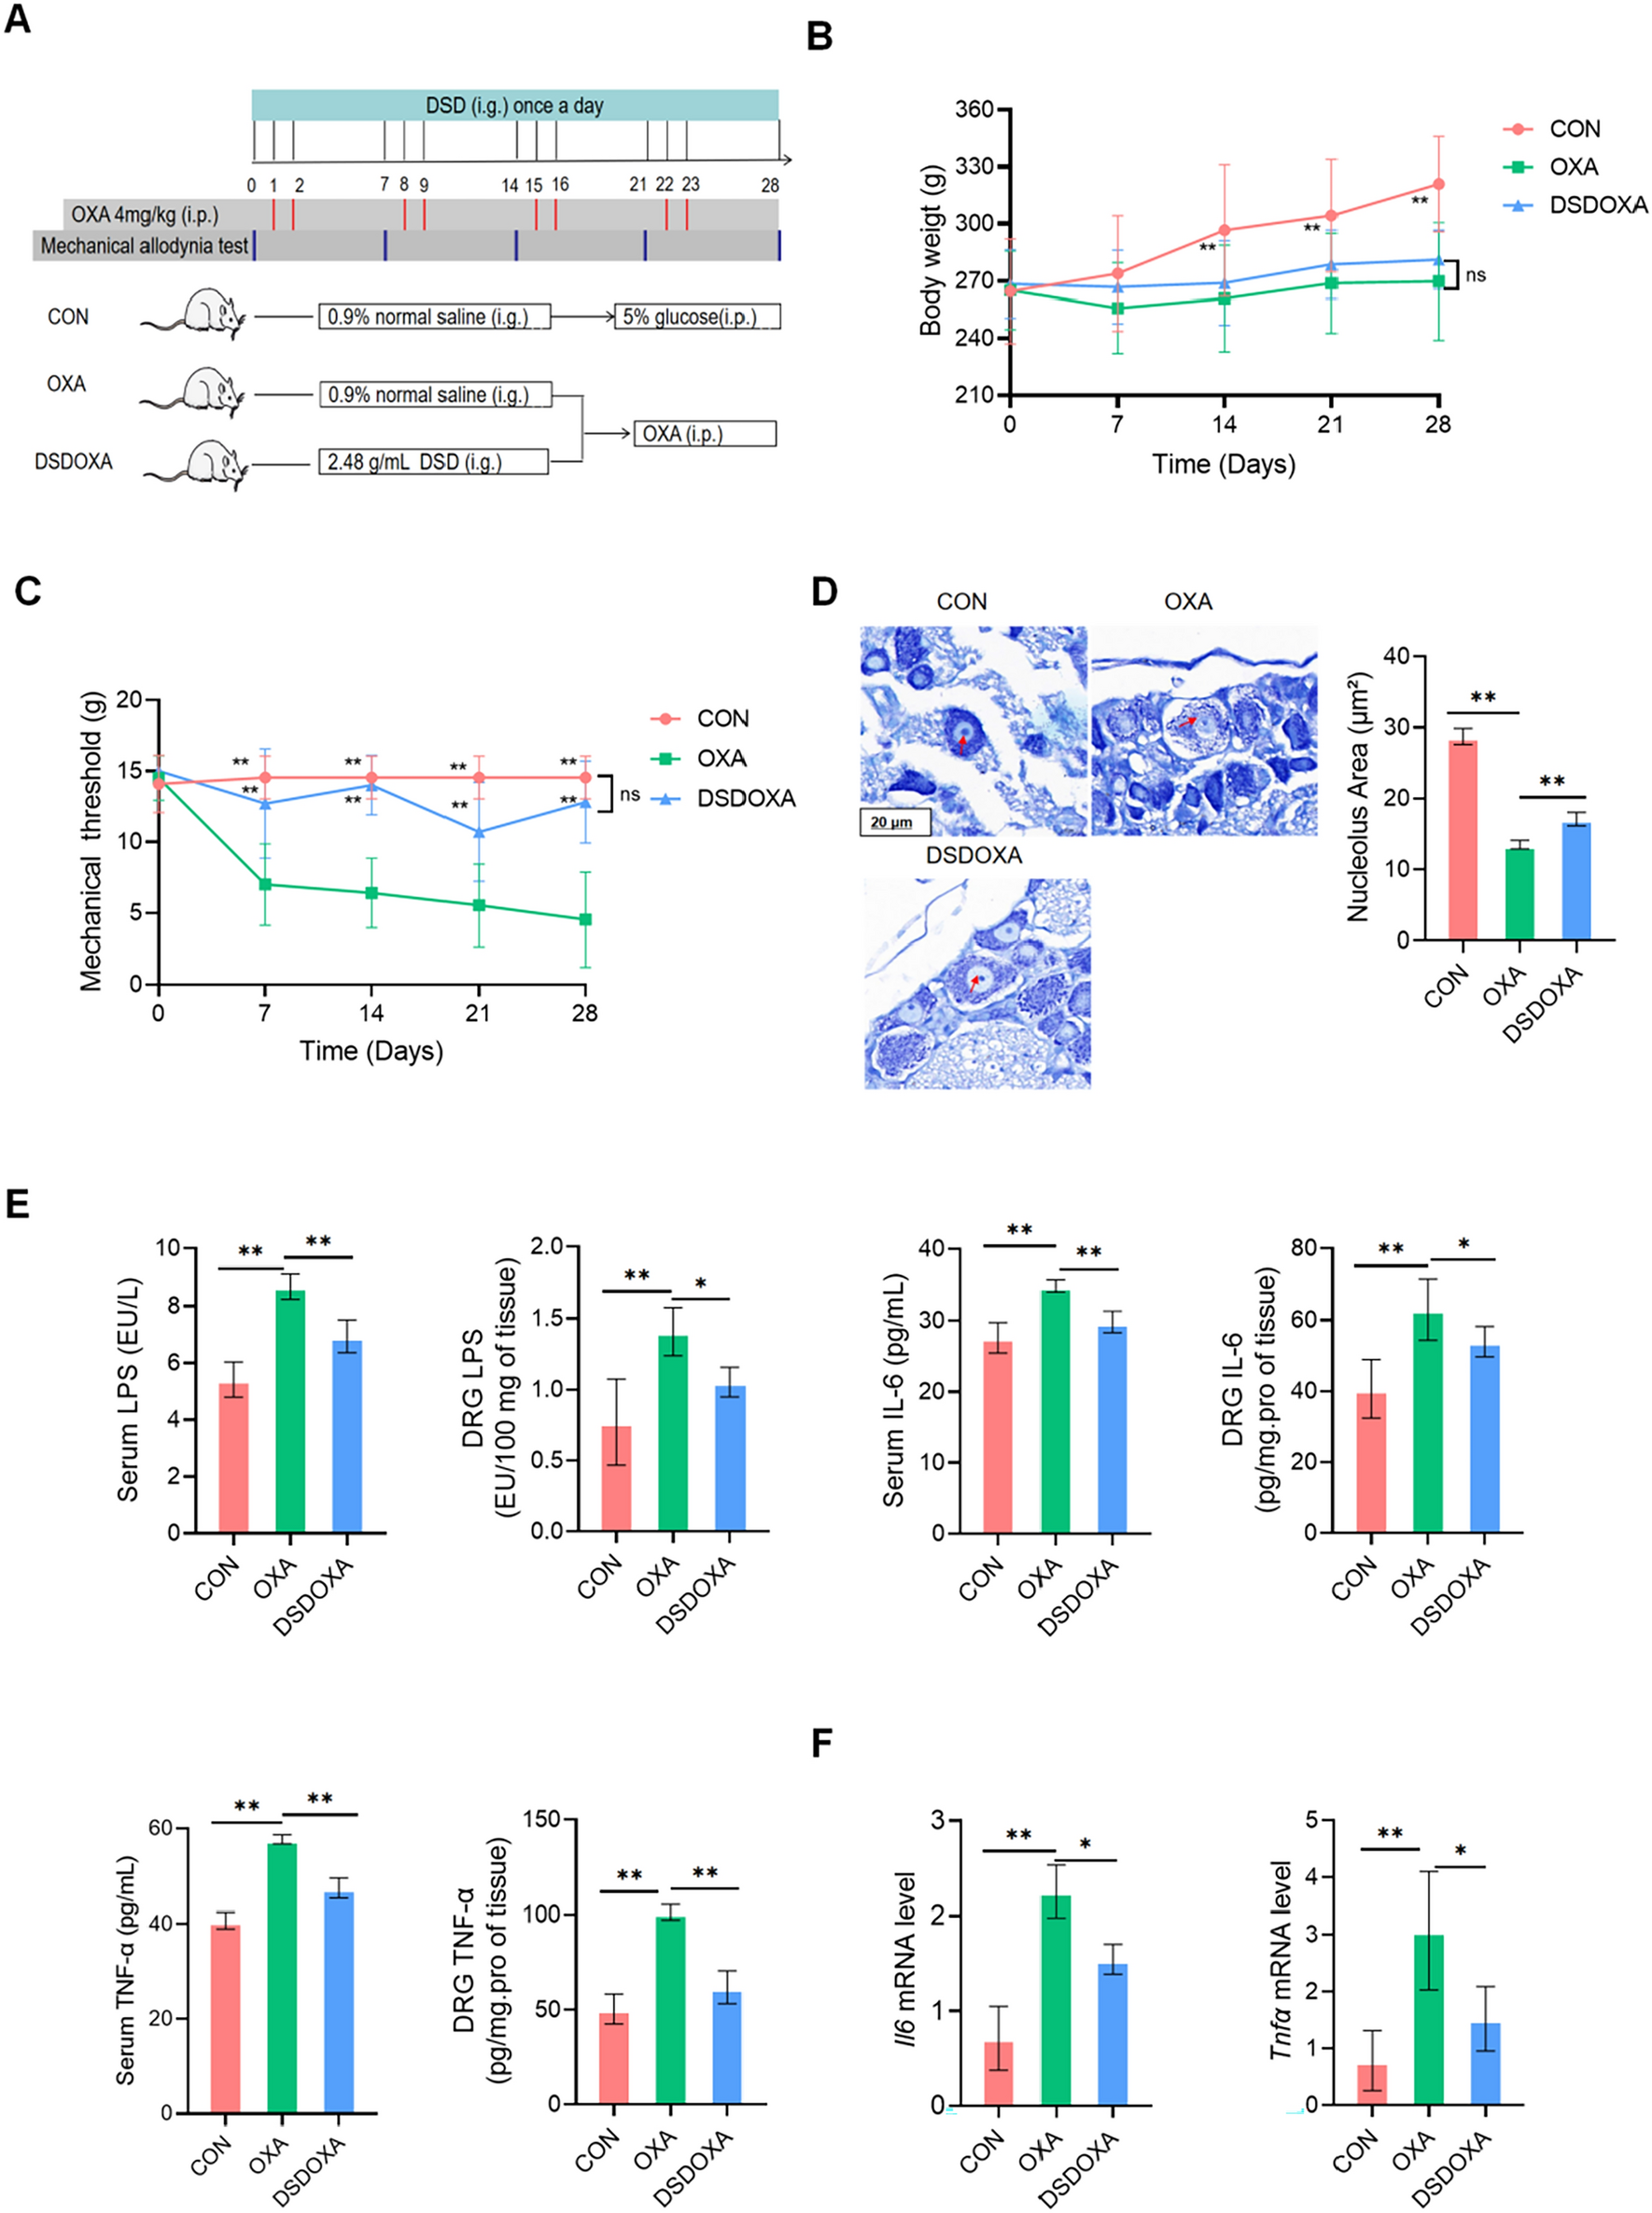
The Ethics Committee of the Chinese Academy of Chinese Medical Sciences approved all animal experiments (ethics number: 2022B115). Healthy male Lewis rats (6–8 weeks old, 170–200 g) were purchased from Beijing Charles River Laboratories (SCXK (Beijing) 2021–0011). They were maintained under standard conditions for 7 days before any manipulations. The 36 rats were randomly allocated to six groups (6 rats per group): AIA model group, normal control group, Tan IIA high, middle and low dosage groups (30 mg/kg/d, 15 mg/kg/d, 7.5 mg/kg/d) and methotrexate (MTX) group (0.2 mg/kg, twice weekly). The method of AIA induction was performed based on previously reported literature [25]. With the exception of the rats in the normal control group, all rats were injected with 0.1 mL CFA to induce arthritis. The rats in the normal control group were injected with an equivalent amount of saline instead. Treatment was administered continuously for 30 days after AIA model construction. The rats in the Tan IIA treatment groups and MTX group received a single daily gavage of the appropriate drug twice weekly. The rats in the normal control and AIA model groups received an equal volume of distilled water instead.
Arthritis evaluation
Paw Swelling: the ipsilateral hindfoot thickness of the rats in each group was measured using Vernier callipers as previously reported, and these measurements were repeated three times [26]. The frequency of disease symptoms in each group of rats independent of severity indicated morbidity [27]. Clinical arthritis scores were assessed by two individuals who were blinded to the experimental groups [28]. Based on a previous report [29], the rats’ pain domain was measured with a Von Frey hair mechanical pain tester.
Histopathological evaluation of the joints
Rat right knee joints were fixed for 48 h in 4% paraformaldehyde before being decalcified for 6 weeks in 10% ethylenediaminetetraacetic acid (EDTA). The rats’ right knee joints were paraffin-embedded, sliced, and stained with haematoxylin–eosin (HE) after being completely decalcified. Histopathological scoring was performed as previously reported [30]. Histomorphological changes in the articular cartilage were observed by light microscopy. Three independent blinded pathologists assessed and quantified the histopathological evaluations.
Micro-CT
Microfocal computed tomography (Skyscan 1276, Bruker, Belgium; resolution, 10.2 µm) was used to scan the rats’ left paws, ankles, and knees. An image analysis device (CTan V 1.13 software, Bruker micro-CT) was used to recreate and analyse the scanned pictures. This system can also provide three-dimensional spatial structural parameters of the bone trabeculae in the monitored area, including the bone volume (BV)/total volume (TV) ratio, trabecular number (Tb. N), bone surface ratio (BS/BV), and trabecular thickness (Tb. Th).
Enzyme-linked immunosorbent assay
At the end of the experiment, blood was collected from the rats under general anaesthesia. Rat sera were obtained by centrifugation at 4 °C for 15 min (3000×). The sera were examined for relevant cytokine bone resorption indicators according to the MMP-9, TRAP, CTSK and interleukin 17 (IL-17) ELISA kit instructions.
ELISA was used to measure the effect of the LDHC inhibitor galloflavin (GF) on the osteoclast-specific indices MMP-9, TRAP, CTSK and IL-17. Rats were divided into the control group, Tan IIA (20 μM) group, GF (20 μM) group, and GF (20 μM) + Tan IIA (20 μM) group.
Cell culture
RAW264.7 cells were obtained from the Chinese Academy of Medical Sciences (Beijing, China). All cells were grown in a 5% CO2 incubator at 37 °C and cultured in glucose-containing DMEM supplemented with 10% FBS and 100 IU penicillin/streptomycin. Cells were passaged at 1:3 when they were in the logarithmic growth phase and at a density of approximately 90%.
Osteoclast differentiation
RAW264.7 cells (2.5 × 10⁵) were inoculated in 24-well plates and cultured in full DMEM with 50 ng/mL RANKL. The incubator conditions were set to 37 °C and 5% CO2. Cell growth was observed until mature osteoclasts had formed.
TRAP staining assay and actin ring immunofluorescence
Osteoclasts were cultured in 24-well plates for 20 min before being washed with PBS and fixed with tissue cell fixative. The osteoclasts were then stained using the TRAP Stain Kit as directed by the manufacturer. Osteoclasts, defined as TRAP-positive multinucleated cells (nuclei ≥ 3), were photographed for observation of cell morphology with an ECHO microscope (200×), and the osteoclast fusion index was calculated. The induced osteoclasts were permeabilized with 0.1% Triton X-100 for 10 min and washed twice with PBS. The cells were then incubated at room temperature for 1 h with Actin-Tracker Red-Rhodamine (1:100 dilution) and Hoechst (1:500 dilution) staining solutions. A confocal fluorescence microscope was used to observe the cells (Leica TCS SP8 SR).
LDHC enzyme assay
Enzyme activity was measured using a lactate dehydrogenase assay kit. Tan IIA was added to 0.5 μg/μL LDHC (10 μL) in PBS, and the absorbance at 340 nm was measured to determine the enzyme activity. Scans were performed using a microplate reader every 2 min until 36 min (see Additional file 1).
NAD+/NADH ratio
Intracellular NAD+/NADH was measured following the instructions of the NAD/NADH assay kit. Osteoclasts (1 × 10⁶ cells/well) were placed in a 6-well culture plate treated with DMEM with or without Tan IIA (10, 20, 40 μM) for 24 h before being washed with PBS. The NAD+/NADH assay was performed according to the kit instructions. The absorbance values at 570 nm were measured using a microplate reader (EnVision 2105, PerkinElmer, USA), and the total amounts of NAD+ and NADH were estimated. According to the formula below, the ratio of NAD+/NADH in the sample was calculated. [NAD+/NADH] = [NAD+]/([NADH total]-[NADH]).
Cellular imaging
Fluorescence imaging assessments demonstrated the colocalization of Tan IIA with the potential cell target LDHC. In the presence or absence of Tan IIA (0 and 20 μM), osteoclasts were treated with 0.5 mL of 10% DMEM. IAA (40 μM) was added to the medium for 1 h after 4 h of DMEM treatment. Next, 1 mL of PBS was used to wash the cells. After that, the cells were fixed for 20 min with cell fixative. Triton X-100 (0.1%) was applied to permeabilize the cells for 10 min. Bovine serum albumin (BSA, 5%) was added for 2 h at room temperature. An LDHC antibody (1:1000) was applied for overnight incubation at 4 °C. Rabbit anti-mouse IgG (1:1000) (Alexa Fluor 488) was then added for incubation at room temperature for 1 h after washing with TBST. Finally, the cells were treated for 30 min with Hoechst (1:500 dilution) before being imaged with a laser scanning confocal fluorescence microscope (Leica TCS SP8 SR).
We used the probe DCF-DA to detect ROS accumulation in osteoclasts. Briefly, cells (1 × 10⁵/well) were inoculated in laser confocal dishes and treated with Tan IIA (0, 10, 20, 40 μM) for 12 h. Cells were then incubated with 10 mM DCF-DA and Hoechst (1:500 dilution) for 30 min and observed under a confocal fluorescence microscope (Leica TCS SP8 SR).
Competitive in-gel fluorescent labelling of Tan IIA in osteoclasts
Osteoclasts (2 × 10⁶ cells/well) were grown to 90% confluence on 6-cm plates before being exposed to different concentrations of Tan IIA (0, 50, 100, and 200 400 μM). Cells were then washed twice with PBS. With the use of a cell scraper, cells were collected. Cell lysate solution (100 μL RIPA with 1% protease inhibitor) was then added, and the cells were sonicated on ice until protein lysis was achieved. Following centrifugation at 15,000 ×g for 15 min, the protein lysate supernatant was aspirated. Using a BCA kit, the protein concentration was adjusted to 2 mg/mL. Two hundred micrograms of cell lysate was collected, and 50 μM cysteine-specific probe (IAA-yne) was added for labelling. Next, each sample was added to 13 μL of click buffer containing 6 μL of TBTA (1.7 mM, DMSO), 2 μL of CuSO4 (50 mM, ddH2O), 0.6 μL of biotin-N3 (10 mM), and 2 μL of TCEP (50 mM, ddH2O) and shaken at 1000 rpm at 29 °C for 1 h. One millilitres of precooled acetone (− 20 °C) was added to the mixture, and the marker proteins were precipitated for 30 min at − 80 °C. After 15 min of centrifuging the supernatant at 15,000 rpm, the acetone was allowed to evaporate completely. The protein samples were prepared by adding 100 μL of 1 × loading buffer and heating in a metal bath at 96 °C for 10 min. Protein samples were separated on 10% SDS‒PAGE gels. Total proteins were visualized using Coomassie brilliant blue. Fluorescence gel images were acquired with an Azure Sapphire RGB NIR scanner (USA).
Streamlined cysteine activity-based protein profiling
To find the cellular proteins that interact with Tan IIA based on activity, we performed competitive mass spectrometry experiments. In the following steps, we chose the probe DBIA. Three groups were assembled: 500 μM DBIA, 100 μM Tan IIA + 500 μM DBIA and 200 μM Tan IIA + 500 μM DBIA. Tan IIA was used for the competition experiments. The protocols for osteoclast culture, Tan IIA treatment, protein collection, and DBIA labelling were identical to those previously reported for the Tan IIA treatment of osteoclasts in an in-gel fluorescent labelling experiment. After adding 500 μM DBIA to 100 μL of Tan IIA-treated cell lysate, the cells were shaken for 1 h at 1000 rpm and 29 °C. DTT was added at a final concentration of 5 mM after probe labelling, and the cells were shaken for 30 min (1000 rpm, 29 °C) in the dark. To reduce cysteine residues, 20 mM IAA was added with shaking (1000 rpm, 29 °C) at the end of the reaction and in the dark for 30 min. Subsequently, to remove as much DBIA as possible, the proteins were precipitated using a chloroform/methanol/water combination (1:4:3) and centrifuged at 15,000 rpm for 15 min. After centrifugation, the supernatant was gently aspirated using a pipette, and the proteins were washed and precipitated twice with 500 μL of methanol. For peptide digestion, 200 μL of 200 mM EPPS (pH 8.52) was used to redissolve the precipitate, while 2 μL of trypsin and LysC (1 μg/μL, Promega) were added to digest the proteins. The reaction was carried out on a shaker for 20 h protected from light (1000 rpm, 29 °C). For peptide labelling, peptides digested with DBIA-conjugated cysteine were tagged using TMT10plex™ mass labelling reagent (Thermo Scientific) following the manufacturer s instructions. After 15 min of incubation with 0.3% hydroxylamine, the TMT reaction was stopped. After mixing all of the TMT-labelled samples with a SpeedVac, they were dried. The samples were dissolved in 1 mL of PBS for peptide enrichment, 100 μL of streptavidin magnetic beads were added, and the samples were swirled at room temperature for 4 h. The beads were washed three times with 1 of mL PBS, 1 mL of 0.1% SDS in a SpeedVac, and 1 mL of dd H2O was added to eliminate nonspecific binding. Finally, after desalting with 0.1% formic acid, the DBIA-labelled peptides were eluted from a C18 column with 0.1% FA in 50% acetonitrile, and the samples were analysed using an Orbitrap Fusion Lumos (Thermo Scientific).
Whole-proteome experiment
First, tissues from the ankle joint cavities of the rats in the normal control, model, and Tan IIA high-dose (30 mg/kg) groups were lysed as previously reported. Protein concentrations were measured and diluted to a concentration of 3 mg/mL. Second, at room temperature, 5 mM DTT was added to samples for 30 min of treatment in the dark. Then, 20 mM IAA was added for 30 min at room temperature in the dark. The proteins were precipitated using a chloroform/methanol/water system (1:4:3). After that, the precipitated protein was dissolved in EPPS buffer. To digest the protein, 1 μg/μL trypsin was added for 20 h at 37 °C. Samples were desalted using a commercial C18 column (Waters) and dissolved in 0.1% FA for LC‒MS/MS identification.
Statistical analysis
GraphPad Prism 9.0 software was used for statistical analysis. T tests, one-way ANOVA, Welch’s test, Brown-Forsythe test, and nonparametric tests were employed to analyse the data. P values < 0.05 were considered to indicate statistical significance.


留言 (0)