
記住我
To evaluate the role of dual TCR cells in mediating antitumor immune responses, we transplanted 106 syngeneic methylcholanthrane (MCA)-induced sarcoma 6727 cells into the right flank of B6.TCRA-GFP/RFP reporter mice. The 6727 sarcoma is an immunogenic tumor that initially grows after transplantation, but is ultimately eliminated within 4 weeks in immunologically competent mice.26 We measured immune responses against the 6727 sarcoma by recovering tumor-infiltrating lymphocytes (TILs), draining lymph node cells (DLN), contralateral lymph node cells (CLN), and splenocytes (SPL) at 1 week after tumor implantation. Single-TCR (GFP+ or RFP+) and dual-TCR (GFP+RFP+) CD4+ and CD8+ T cells were readily identifiable by flow cytometry (figure 1A). Dual TCR cells represented 19.8±2.6% of CD4+ and 22.7±2.7% of CD8+ TILs (figure 1B). This is significantly increased (CD4+ p=0.001, CD8+ p<0.001) compared with the ~16% of T cells expressing dual TCRs in immunologically naive adult mice B6.TCRA-GFP/RFP mice.3 Dual TCR cells were increased from baseline in all compartments (online supplemental figure 1A), though this increase appeared specifically directed toward the tumor, with dual TCR cells significantly increased among CD4+ DLN and CD4+ and CD8+ TILs compared with the spleen or CLN (figure 1C).
 Figure 1
 Dual TCR cells are increased in immunogenic tumors and DLN. B6.TCRA-GFP/RFP mice were transplanted with 106 MCA-sarcoma 6727 cells in the right flank and immune response was assessed after 1 week by recovery of splenocytes (SPL), contralateral lymph node cells (CLN), draining lymph node cells (DLN), and tumor-infiltrating lymphocytes (TIL) (n=12, 3 independent experiments). (A) Single (GFP+ or RFP+) and dual (GFP+RFP+) T cells were identified by flow cytometry. Data shown is representative example from all compartments of one animal. (B) Frequency of single-TCR and dual-TCR cells among CD4+ and CD8+ TILs. Data shown as dots representing individual mice and box showing group mean values. (C) Frequency of dual TCR cells from all compartments. Data shown as dots representing individual mice and box showing group mean values. Dotted line indicates average frequency of dual TCR T cells from immunologically naive B6.TCRA-GFP/RFP mice. Groups compared with SPL non-parametrically using Mann-Whitney test. ***p<0.005. GFP, green fluorescent protein; LN, lymph node; RFP, red fluorescent protein; TCR, T-cell receptor; TCRA, TCRα; MCA, methylcholanthrine-induced.
Dual TCR T cells are increased and highly activated in TILThe increased frequency of dual TCR cells among CD4+ and CD8+ TIL and CD4+ DLN suggests that they may have an increased ability to respond to tumor cells compared with single-TCR cells. To examine this, we measured expression of markers of antigen recognition and T-cell activation (CD44, OX40), tissue homing associated with effective antitumor response (CD103), exhaustion (programmed cell death protein-1 (PD-1), lymphocyte-activation gene-3 (LAG-3)), and Tregs (FoxP3). Comparison of activation markers between single-TCR and dual-TCR TILs revealed that dual TCR CD4+ and CD8+ cells were significantly enriched for activated CD44+ and OX40+ phenotypes than T cells expressing a single TCR clonotype (figure 2A–D). Similarly, dual TCR cells were more likely to express CD103, indicating selective retention in the tumor (figure 2E,F). This activation was specific for reactivity against the tumor, as T cells from spleen, CLN, or DLN did not demonstrate similar activation of either single-TCR or dual-TCR cells (online supplemental figure 1B–D).
 Figure 2
 Dual TCR cells are preferentially activated in TILs. Activation and exhaustion of TILs from 6727 sarcoma-bearing B6.TCRA-GFP/RFP mice 1 week after tumor implantation was examined by flow cytometry (n=12, 3 independent experiments). Expression of (A,B) CD44, (C,D) OX40, (E,F) CD103, (G,H) PD-1, (I, J) PD-1 and LAG-3, and (K,L) FoxP3 were compared between single-TCR and dual-TCR CD4+ and CD8+ TILs. (A,C,E,G,I,K) Representative example of all markers expressed by GFP+RFP+ TIL from one animal. (B,D,F,H,J,L) Comparison of expression by single-TCR and dual-TCR cells from TIL of individual mice, linked dots representing individual mice. Wilcoxon matched-pairs test. *p<0.05, **p<0.01, ****p<0.001, ns, not statistically significant. GFP, green fluorescent protein; PD-1, programmed cell death protein-1; RFP, red fluorescent protein; TCR, T-cell receptor; TIL, tumor-infiltrating lymphocyte; LAG-3, lymphocyte-activation gene-3; TCRA, TCRα; FSC, forward scatter.
Dual TCR cells among 6727 sarcoma TIL also had increased frequencies of PD-1+ and PD-1+LAG-3+ cells among dual TCR TIL (figure 2G–J). Expression of PD-1 by TIL was considered as a marker of antigen-specific reactivity against the tumor.30 31 However, PD-1 upregulation can indicate both T-cell activation as well as exhaustion. To examine this further, PD-1+LAG-3+ co-expression was measured as an additional indicator of T-cell exhaustion. Similar to T-cell activation, this was specific to the antitumor immune response, as T cells from spleen, CLN, or DLN did not demonstrate increase in expression of these markers (online supplemental figure 1E,F). While this does not unambiguously differentiate exhausted cells from activated cells, both of these populations are considered indicative of T-cell response to tumor.32 Dual TCR cells in TIL were not more likely to be FoxP3+ Tregs than single-TCR cells (figure 2K,L).
Single-cell RNA sequencing analysis identifies dual TCR cells as predominant effector memory TILThe activated nature (CD44+, OX40+, PD-1+) of dual TCR TILs compared with single-TCR cells presents non-exclusive possibilities that either dual-TCR cells are better able to recognize tumor antigens and mediate responses similar to conventional single-TCR cells, or that dual-TCR cells may have distinct functional responses. We examined the functional response of dual TCR cells by performing single-cell transcriptional analysis of TILs from B6.TCRA-GFP/RFP mice bearing 6727 tumors. Single TCR GFP+ or RFP+ and dual TCR GFP+RFP+ cells were isolated from five 1-week post-implantation 6727 tumors by paramagnetic bead enrichment for CD3+ T cells followed by flow cytometry cell sorting for GFP+, RFP+, or GFP+RFP+ cells. Isolated populations were labeled with nucleotide-barcoded hashtag antibodies, and barcoded fractions from individual mice were re-pooled for subsequent sample emulsion barcoding and complementary DNA library generation (figure 3A). Libraries were generated for gene expression and barcode feature analysis from each sample, producing a total of 3717 barcoded cells. From these cells, 658 presumptive T cells were identified by filtering for cells expressing Cd3e and Cd3d and not expressing Klra1 (Ly49A), Klra7 (Ly49G) (excluding natural killer (NK) cells), or H2-Ab1 (excluding B cells and myeloid cells) (online supplemental figure 2A). Identified T cells were derived from all five TIL samples (online supplemental figure 2B). K-means analysis of differential gene expression grouped these T cells into four clusters (figure 3B). Clusters 1, 2 and 4 were primarily comprised of CD8a+ T cells, while CD4+ T cells were contained within cluster 3 and a small subpopulation of cluster 4 (online supplemental figure 2C). Manual review of top-expressed genes identified these clusters as; (1) (32.5%) CD8+ T cells with effector memory, or ‘stem-like’ capacity (Tcf7, Il7r, Sell, Bcl2), (2) (27.8%) terminal effector CD8+ T cells (Pclaf, Stmn1, Cks1b), (3) (24.3%) a combination of activated and regulatory CD4+ T cells (Izumo1r, Tnfrsf4, Tnfsf18, FoxP3), and (4) (15.3%) exhausted T cells (Pdcd1, Lag3, Tox, Myb)32 (figure 3C).
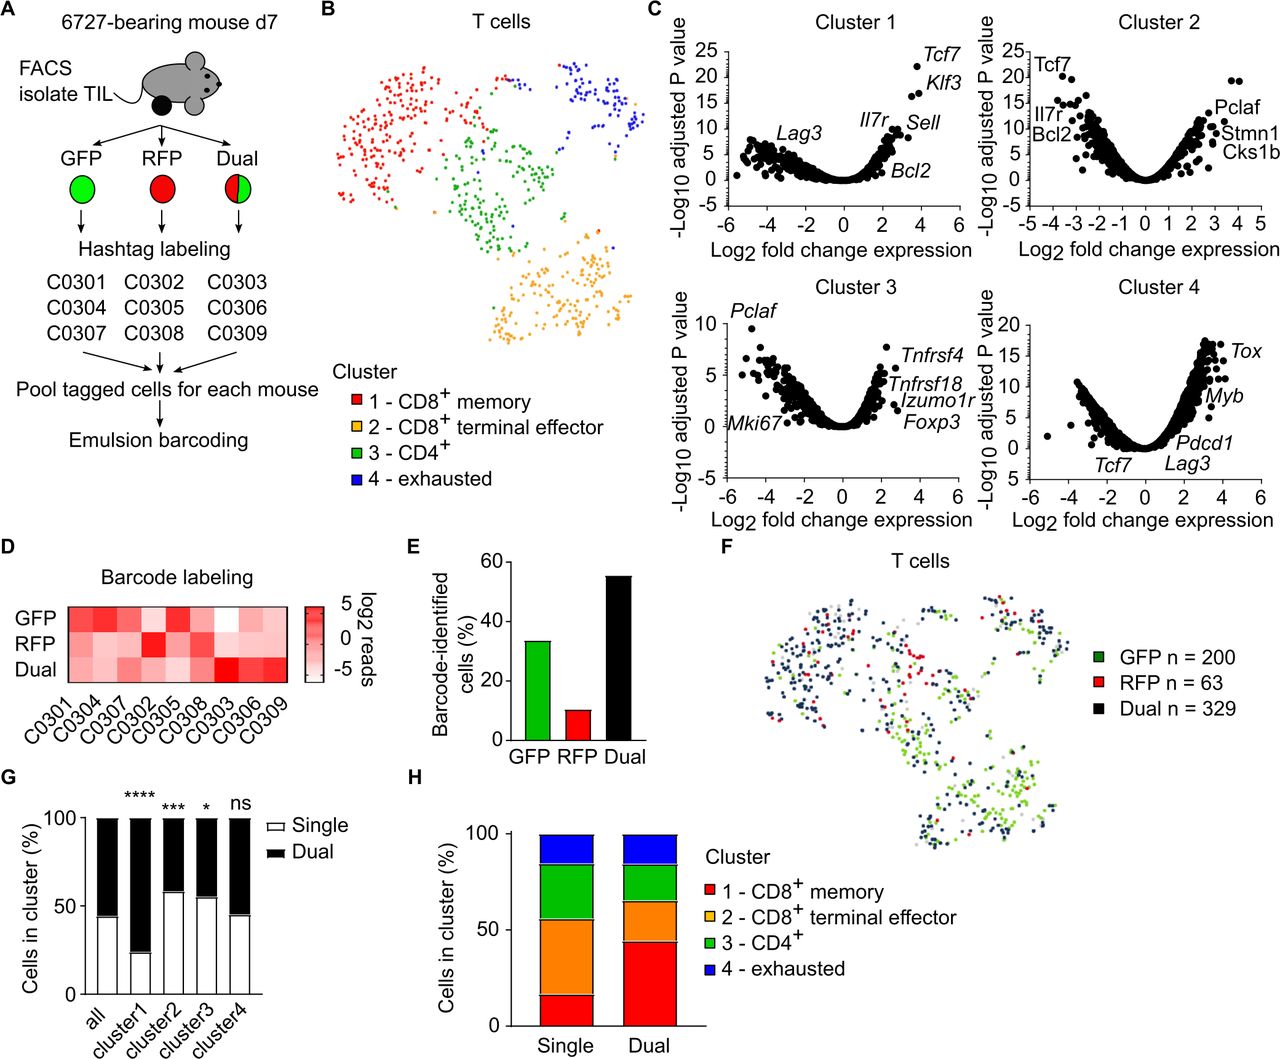 Figure 3
 Dual TCR cells predominate effector T-cell response in immunogenic tumors. TILs were recovered from 6727 tumors 7 days after implantation in B6.TCRA-GFP/RFP mice and examined by single-cell transcriptional analysis. (A) Cell hashtag barcoding strategy for GFP+, RFP+, and GFP+RFP+ cells isolated by FACS from individual TIL samples (n=5, 2 independent experiments). (B) T cells (n=658), identified as CD3e+CD3d+H2-Ab1−Klra1−Klra2−, were clustered by k-means analysis for gene expression. Data represented as t-SNE plot, with cluster identification by manual review of differentially expressed genes. (C) Differential expression of genes plotted against –log10 p value for statistical confidence for each cell cluster. (D) Cluster analysis of expression of cell hashtag barcodes based on manual differentiation (online supplemental figure S2D) of GFP+, RFP+, and GFP+RFP+ input cells. (E) Proportion of cells identified as GFP+, RFP+, or Dual TCR (GFP+RFP+) by barcode analysis. (F) Distribution of cells identified as GFP+, RFP+, or Dual TCR (GFP+RFP+) by barcode analysis among gene-expression based clusters. Data shown as t-SNE plot. (G) Proportion of cells in each cluster identified as single (GFP+ or RFP+) or dual TCR. Proportions of cells in each cluster compared with overall proportion by Fisher’s exact test. (H) Percentages of single-TCR and dual-TCR cells in each gene-expression defined cluster. *p<0.05, ***p<0.005, ****p<0.001, ns, not statistically significant. GFP, green fluorescent protein; RFP, red fluorescent protein; TCR, T-cell receptor; TIL, tumor-infiltrating lymphocyte; FACS, fluorescence-activated cell sorting; TCRA, TCRα; t-SNE, t-distributed stochastic neighbor embedding.
Cell labeling with barcoded hashtag antibodies was differentiated by feature plot analysis and manual selection for cells with only a single hashtag type present (online supplemental figure 2D). Barcodes segregated in expected groups, with the exception of barcode C0308 (used to label RFP+ cells sorted from TIL sample 7) which was detected on both GFP+ and RFP+ cells from sample 7 (figure 3D). Based on hashtag barcode analysis, 592 (90.0%) of cells were assigned to the sorted input cell subtypes; GFP+ (n=200, 33.8%), RFP+ (n=63, 10.6%), and GFP+RFP+ dual TCR (n=329, 55.6%) TILs (figure 3E). Given the limited number of cells identified from the RFP+ input cells, as well as the non-exclusive labeling of both GFP+ and RFP+ cells by the C0308 hashtag monoclonal antibody (mAb), GFP+ and RFP+ cells were combined into a single group (single TCR) for downstream analyses. The predominance of dual TCR cells among barcoded cells is consistent with their disproportionate contribution to TIL populations observed by flow cytometry (figure 1).
Single TCR (GFP+ or RFP+) and dual TCR (GFP+RFP+) T cells were present in all four functional clusters (figure 3F). Dual TCR cells were the predominant population among cluster 1 CD8+ effector memory phenotype T cells, enriched beyond their prevalence among all analyzed TIL (76.0%, p<0.001) (figure 3G). Dual TCR cells were also present at increased frequencies among cluster 2 CD8+ terminal effector cells (41.6%, p<0.005) and cluster 3 CD4+ cells (44.7%, p<0.05), though not to the same degree as the effector memory cell population. Notably, dual TCR cells were not disproportionately represented in the exhausted T-cell cluster, suggesting that the significantly increased expression of PD-1 observed by flow cytometry likely reflected T-cell activation, rather than progression to an exhausted cell state. Reciprocal analysis of phenotypes among single-TCR and dual-TCR cells illustrated the propensity of dual TCR cells for the effector memory phenotype during the antitumor response (figure 3H).
Differential gene expression analysis and hierarchical clustering demonstrated that single-TCR and dual-TCR cells within each cluster had comparable gene expression (figure 4A). Across all clusters, single and dual TCR cells demonstrated similar expression of genes associated with T-cell activation (CD44, CD69), proliferation (Mki67), and TCR signal strength (Nr4a1) (online supplemental figure 3A). Single and dual TCR cells in each category had similar expression of genes indicating cytotoxic function (Gzma, Gzmb, Prf1, Cx3cr1), terminal effector differentiation (Tox, Eomes, Prdm1), or T-cell exhaustion (Lag3, Havcr2, Tigit) (online supplemental figure 3B), consistent with the assignment of cluster 2 terminal effector and cluster 4 exhausted phenotypes. Given that clusters 1 and 3 potentially include multiple phenotypes, we attempted to disambiguate the contribution of dual TCR cells by comparison of key genes within those subsets. Cluster 3 contains the majority of CD4+ TILs, which could include memory, Treg, and cytotoxic cells. Comparison of single-TCR and dual-TCR cells did not demonstrate differences in expression of key genes associated with memory (Tcf7, Il7r, CCR7), Treg (Foxp3, Il2ra, Tigit), or cytolyic (Klrg1, Nkg7, Slamf7) TIL phenotypes (figure 4B).33 Cluster 1 is defined by increased expression of Tcf7, Klf3, and Lef1, genes associated with CD8+ naive, effector memory, and TIL with stem-like renewal capabilities. We did not observe differences in expression of Il7r, which has increased expression associated with CD8+ effector memory cells (figure 4C). However, we observed subsets of cells specifically among dual TCR cells in cluster 1 expressing Bcl6 and Tbx21 (figure 4C), genes associated with CD8+ TIL with stem-like renewal capability and associated with effective antitumor immune responses.34 35
 Figure 4
 Gene expression of single-TCR and dual-TCR TILs. Gene expression of single-TCR and dual-TCR cells, identified by hashtag barcode (figure 3D) in each functional cluster (figure 3B) was compared. (A) Hierarchical clustering of single-TCR and dual-TCR cells. (B) Differential expression of key genes related to memory (Tcf7, Il7r, Ccr7), regulatory (Foxp3, Il2ra, Tigit), and cytotoxic (Klrg1, Nkg7, Slamf7) CD4+ subsets contained within Cluster 3. (C) Differential expression of key genes related to memory (Il7r) and stem-like renewal capacity (Bcl6, Tbx21) for CD8+ cells in Cluster 1. Distribution of gene expression shown as violin plot. TCR, T-cell receptor; TIL, tumor-infiltrating lymphocyte.
Using these results as a guide, we further investigated expression of key transcription factors by single-TCR and dual-TCR TIL at the protein level by intracellular flow cytometry. We isolated TIL from 6727 tumors 7 days after transplantation and evaluated expression of Bcl6, Tox, Eomes, and Nur77. Consistent with gene expression data (figure 4), a subset of dual TCR CD8+ TIL expressing Bcl6, which is associated with memory and effector memory CD8+ T-cell phenotypes including CD8+ TIL with stem-like renewal capacity 36,37, were identifiable (figure 5A). On average, dual TCR CD8+ TIL had increased frequencies of Bcl6+ cells (7.8±3.6%) compared with single-TCR CD8+ TIL (5.5±2.1%), though the difference did not reach statistical significance (figure 5B). We attempted to identify cells co-expressing Bcl6 and Tbet (encoded by Tbx21) by flow cytometry, but were unable to identify sufficient numbers of cells for statistical analysis (data not shown).
 Figure 5
 Flow cytometry analysis of transcription factors associated with TIL function. Expression of key transcriptions factors in TILs from 6727 sarcoma-bearing B6.TCRA-GFP/RFP mice 1 week after tumor implantation was examined by intracellular flow cytometry. (A) Identification of Bcl6+ CD8+ GFP+, RFP+, and GFP+RFP+ TIL, representative sample shown. (B) Intrasample comparison of frequency of Bcl6+ single-TCR and dual-TCR TIL for five mice from two independent experiments. (C) Measurement of Tox expression in CD8+ GFP+, RFP+, and GFP+RFP+ TIL, representative sample shown, geometric mean fluorescence indicated. (D) Intrasample comparison of Tox expression by single-TCR and dual-TCR TIL for 11 mice from four independent experiments. (E) Measurement of Eomes expression in CD8+ GFP+, RFP+, and GFP+RFP+ TIL, representative sample shown, geometric mean fluorescence indicated. (F) Intrasample comparison of Eomes expression by single-TCR and dual-TCR TIL for five mice from two independent experiments. (G) Measurement of Nur77 expression in CD4+ and CD8+ GFP+, RFP+, and GFP+RFP+ TIL, representative sample shown, geometric mean fluorescence indicated. (H) Comparison of Nur77 expression by single-TCR and dual-TCR cells from TIL of individual mice, linked dots representing individual mice. All statistical analyses using Wilcoxon matched-pairs test. ***p<0.05, ns, not statistically significant. GFP, green fluorescent protein; RFP, red fluorescent protein; TCR, T-cell receptor; TIL, tumor-infiltrating lymphocyte; TCRA, TCRα.
Examination of Tox expression, associated with an exhausted T-cell state during antitumor responses,38 ,39 demonstrated selectively increased expression in dual TCR TIL (figure 5C,D). However, Eomes, another transcription factor associated with T-cell exhaustion 40 ,41 was not differentially expressed between single-TCR and dual-TCR cells (figure 5E,F). This seeming discrepancy may relate to a recent report indicating that Tox expression can contribute to CD8+ T-cell memory formation,42 which would be consistent with the increased frequency of Bcl6+ cells and the over-representation among memory phenotype cells identified by single-cell gene expression analysis (figure 4). Intracellular flow cytometry measuring Nur77 expression (encoded by Nr4a1) demonstrated mixed results, with no measurable difference between single-TCR and dual-TCR CD4+ TIL, but a consistent increase in dual TCR CD8+ TIL (figure 5G,H). Together, these data support the idea that dual TCR expression may influence the quality of antitumor immune responses.
留言 (0)