
記住我


Consecutive trauma patients admitted to the Emergency Department of Raja Permaisuri Bainun Hospital from November 2021 to January 2022 who required endotracheal intubation and a cervical computed tomography (CT) scan were enrolled.
Ethical approval was obtained from the Medical Research and Ethics Committee of Malaysia Ministry of Health was granted [NMRR-21-1852-61475 (IIR)]. Study was also registered at the ClinicalTrials.gov (Identifier: NCT04739878). Written informed consent was obtained from the patients or their next of kin.
ParticipantsThe inclusion criteria were: (1) ≥ 18 years old; (2) requirement of endotracheal intubation (either via mouth or nose); and (3) clinically indicated cervical CT scan.
Patients were excluded if they had any of the following criterion: (1) subcutaneous emphysema of the neck; (2) scars or surgical dressing around the neck which can lead to difficulty in obtaining optimal ultrasound images.
InterventionAll patients were kept in the supine position, intubated with an Idealcare (Ideal Healthcare Sdn Bhd, Malaysia) oral high volume low pressure cuffed ETT, and then mechanically ventilated. The decision to intubate the patient was made by the primary care team, without the participation of the investigator team. The ventilator machine setting was initiated at the discretion of the treating physician.
The ETT pilot balloon was connected to a cube pressure tube with filter, (Promepla S.A.M, Monaco, France) and inflated with air to adequately seal the airway. The ETT cuff pressure was continuously measure, and monitored using the IntelliCuff of the Hamilton G5 ventilator (Hamilton, Switzerland). The target cuff pressure was set between 20 and 30 cm H2O [12]. IntelliCuff® automatically adjusted the cuff pressure within these values. In the event of a damaged cuff, the device generated an alarm while simultaneously increasing the pressure as a way to maintain the desired cuff pressure.
The following data were recorded at the time of intubation: patients’ demographics, size of the ETT, and physiological parameters. Studied patient outcomes include the incidence of VAP, mortality, intensive care unit (ICU) and hospital length of stay, and days on mechanical ventilation. The CT scan was used as the gold standard for delineating supraglottic secretions. All patients were admitted to the ICU after CT scan.
Ultrasound examinationAirway US was performed at the bedside immediately before the patient was transferred to the CT scan suite. This ensures that the subglottic secretions that was observed by US would also be detected by CT.
Airway US was performed by critical care physicians and emergency physicians who were trained in critical care sonography with a minimum of 5 years of experience. All investigators had undergone airway US training by the World Interactive Network Focused On Critical Ultrasound (WINFOCUS).
Airway US was performed with the Mindray M9 US machine, using a 7.5 MHz linear array probe (Mindray M9, UMT-500 Plus, Germany, 2016). A standard scanning protocol was used (Figs. 1, 2 and 3).
Fig. 1
a A longitudinal view was obtained with the transducer placed at the anterior midline of the neck; b airway ultrasound (longitudinal view) showing subglottic secretions. c Relation of heterogenous subglottic secretions (blue watermark) and homogenous subglottic secretions (green watermark) with endotracheal (ETT) cuff, cricoid cartilage (CC) and cricothyroid membrane (yellow line)
Fig. 2
a A transverse view was obtained with the transducer placed across the anterior surface of the neck at the level of cricoid cartilage. b A cross-section of the cricoid cartilage (yellow watermark), ETT (white line) and presence of subglottic secretions (green watermark) were depicted
Fig. 3
a and b A sagittal view of cervical CT scan showed a subglottic secretions (green watermark) above the ETT cuff (pink watermark) and its relation with other structures; c and d axial views of cervical CT showed subglottic secretions. Ss subglottic secretion; C cricoid cartilage; T thyroid cartilage; ETT endotracheal tube
A sagittal (longitudinal) view examination was performed at anterior midline of the neck to identify the air–mucosal (A–M) interface, ETT cuff, surrounding structures of importance such as the thyroid cartilage, cricoid cartilage, cricothyroid membrane and tracheal rings (Fig. 1, Additional file 1: Video S1). Transverse view examination was performed at the level of cricoid cartilage transversely across the anterior surface of the neck (Fig. 2, Additional file 2: Video 2). In order to acquire the image of subglottic secretion at the posterior part of ETT cuff, a parasagittal (lateral to the midline) scan was performed at the lateral right side of the neck with the transducer tilted towards caudad (Additional file 1: Video S3). The presence of subglottic secretions was defined as heterogenous or homogenous fluid collections or comet-tail artefacts caused by bubble-rich secretions above the ETT cuff [10].
The air–mucosal interface was observed as bright hyperechoic mobile lines. The thyroid and cricoid cartilages both had oval hypoechoic appearance in the parasagittal view and appeared like a hump in the transverse view. The thyroid cartilage was more anterior and larger in size compare to the cricoid cartilage. In longitudinal plane, the tracheal cartilage was seen as a “string of beads” and inverted U in the transverse plane. A failed US consisted in the inability to identify key anatomical structures or the inability to visualize the ETT balloon cuff [13, 14].
Neck CT scan was performed using a 64-multislice detector CT machine (Toshiba Aquilion CX 2010, Japan). CT findings were examined by a radiologist with more than 10 years of experience. The investigator radiologist and US operators were blinded to the findings obtained with the other technique.
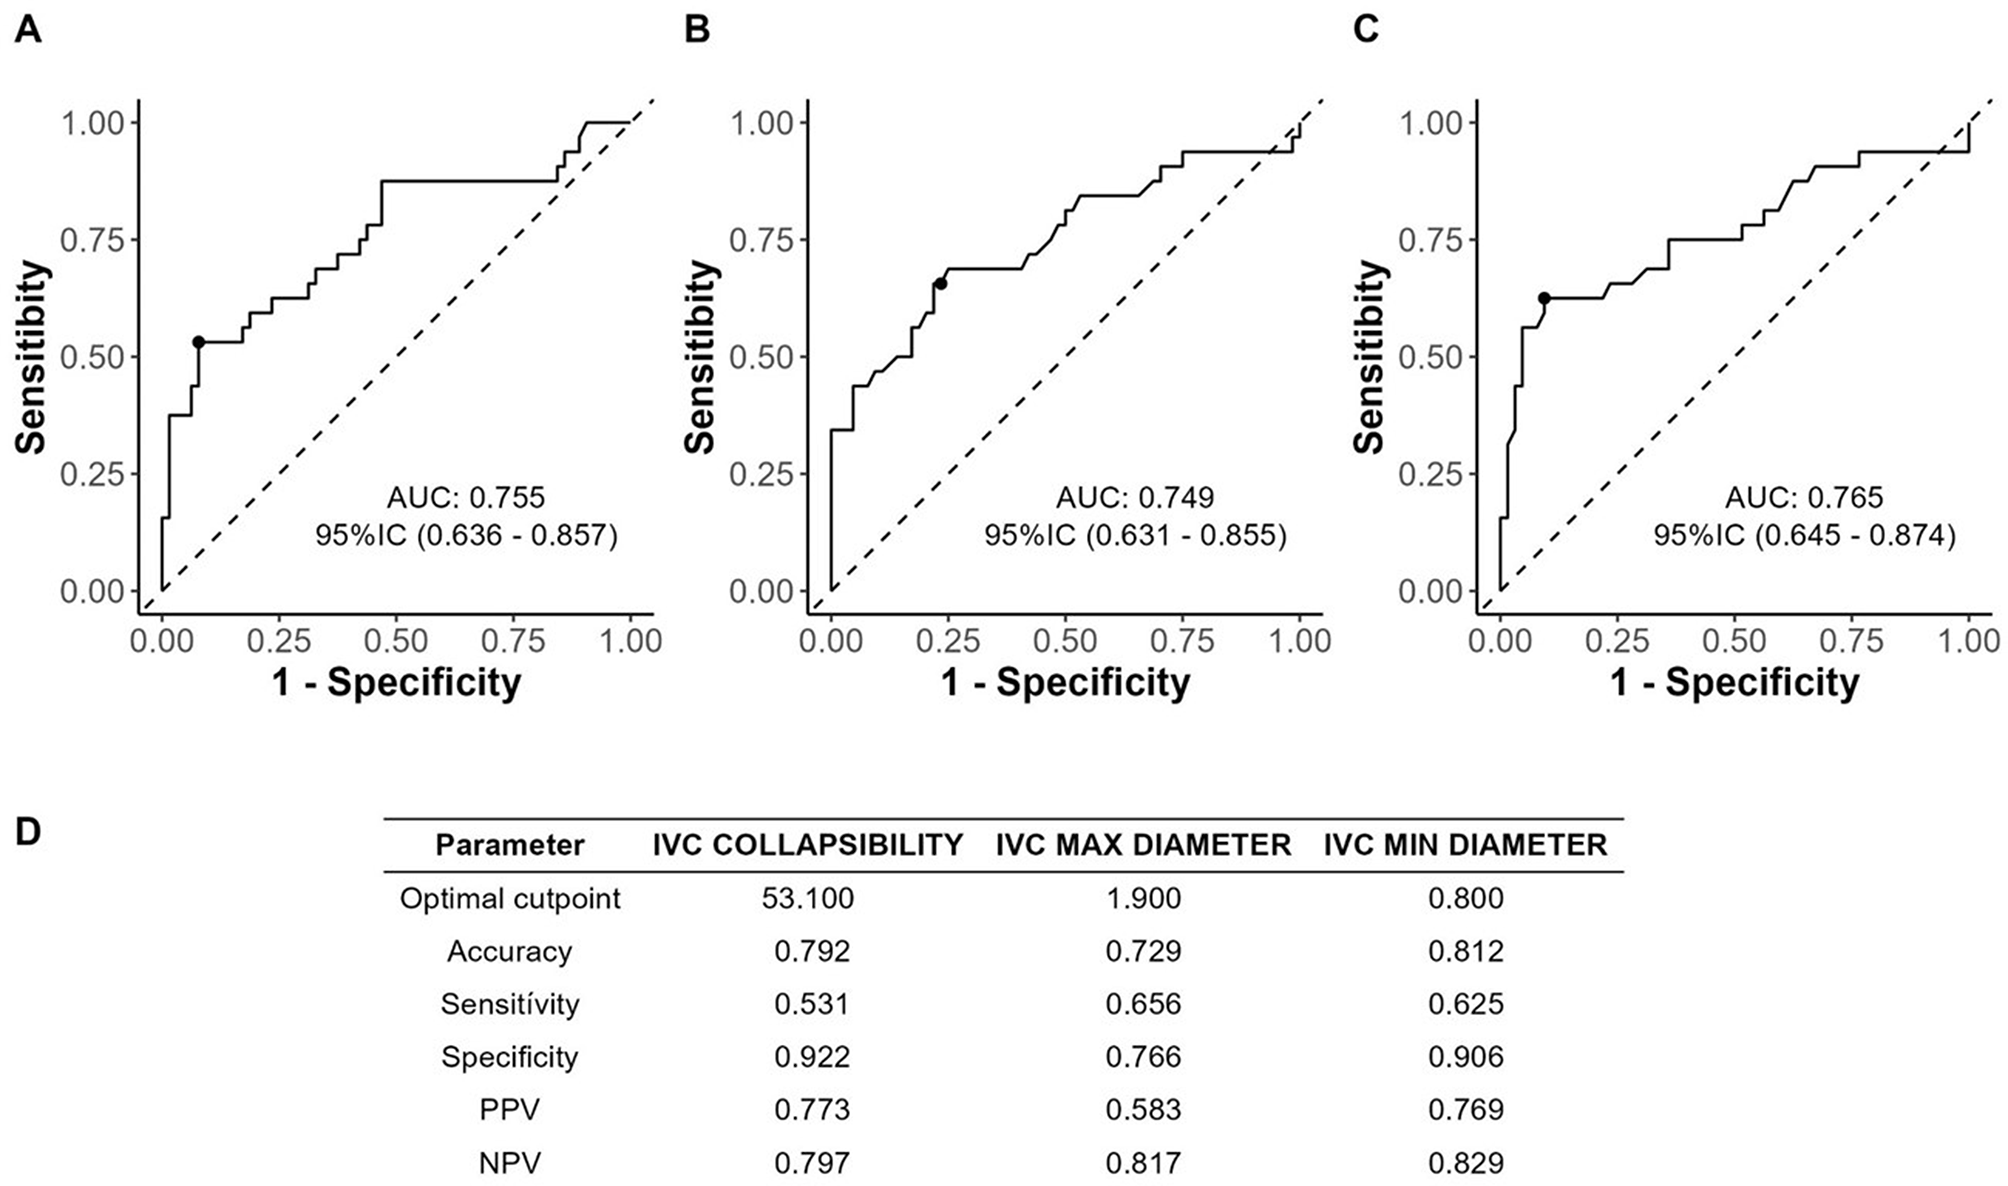
Sample size considerationsWe calculated the sample size to determine whether an area under the curve (AUC) of ≥ 0.75 was achieved for a receiver operator characteristic (ROC) plot of neck US for detecting subglottic secretions versus cervical CT as a gold standard. The null hypothesis was set as AUC 0.5 (meaning no discriminating power), Type 1 error of 0.05 and power of 80%. Based on the unpublished data from our own experience, with a precision of 10%, and an expected proportion of subglottic secretions on chest CT scan of 80%, the sample size required was 45. Taking into account the potential for 10% incomplete data from neck US or cervical CT, we included 49 patients for the final analysis. AUROC sample size calculation was performed using MedCalc for Windows, version 19.4 (MedCalc Software, Ostend, Belgium). [15]
Statistical analysisThe characteristics of the patients were summarized as medians and interquartile ranges for continuous variables, and as numbers and percentages for qualitative variables. The ROC curve and AUC estimates were determined for the relationship of neck US and cervical CT to diagnose subglottic secretions. Sensitivity (Se), specificity (Sp), negative predictive value (NPV) and positive predictive value (PPV) were provided with their 95% confidence intervals (CIs).
ROC and AUC, Se, Sp, NPV and PPV were determined for neck US to diagnose subglottic secretions according to the cervical CT findings as a gold standard. For all calculations, SPSS Statistics for Windows, Version 20.0 (IBM, Armonk, NY, USA) were used. The significance level was set at p < 0.05.
The inter-observer and intra-observer agreement percentages were calculated by dividing the number of occasions of agreement by the total number of occasions. Weighted kappa statistics were applied to determine the degree of agreement. The kappa statistics was interpreted as follows: less than 0.00, poor agreement, 0.00–0.20, slight agreement; 0.21–0.40, fair agreement; 0.41–0.60, moderate agreement; 0.61–0.80, substantial agreement and 0.81–1.00, almost perfect agreement. The level of statistically significant difference was p < 0.01. Statistical analyses were performed with SAS software version 9.1 (SAS Institute) [16].
留言 (0)