
記住我
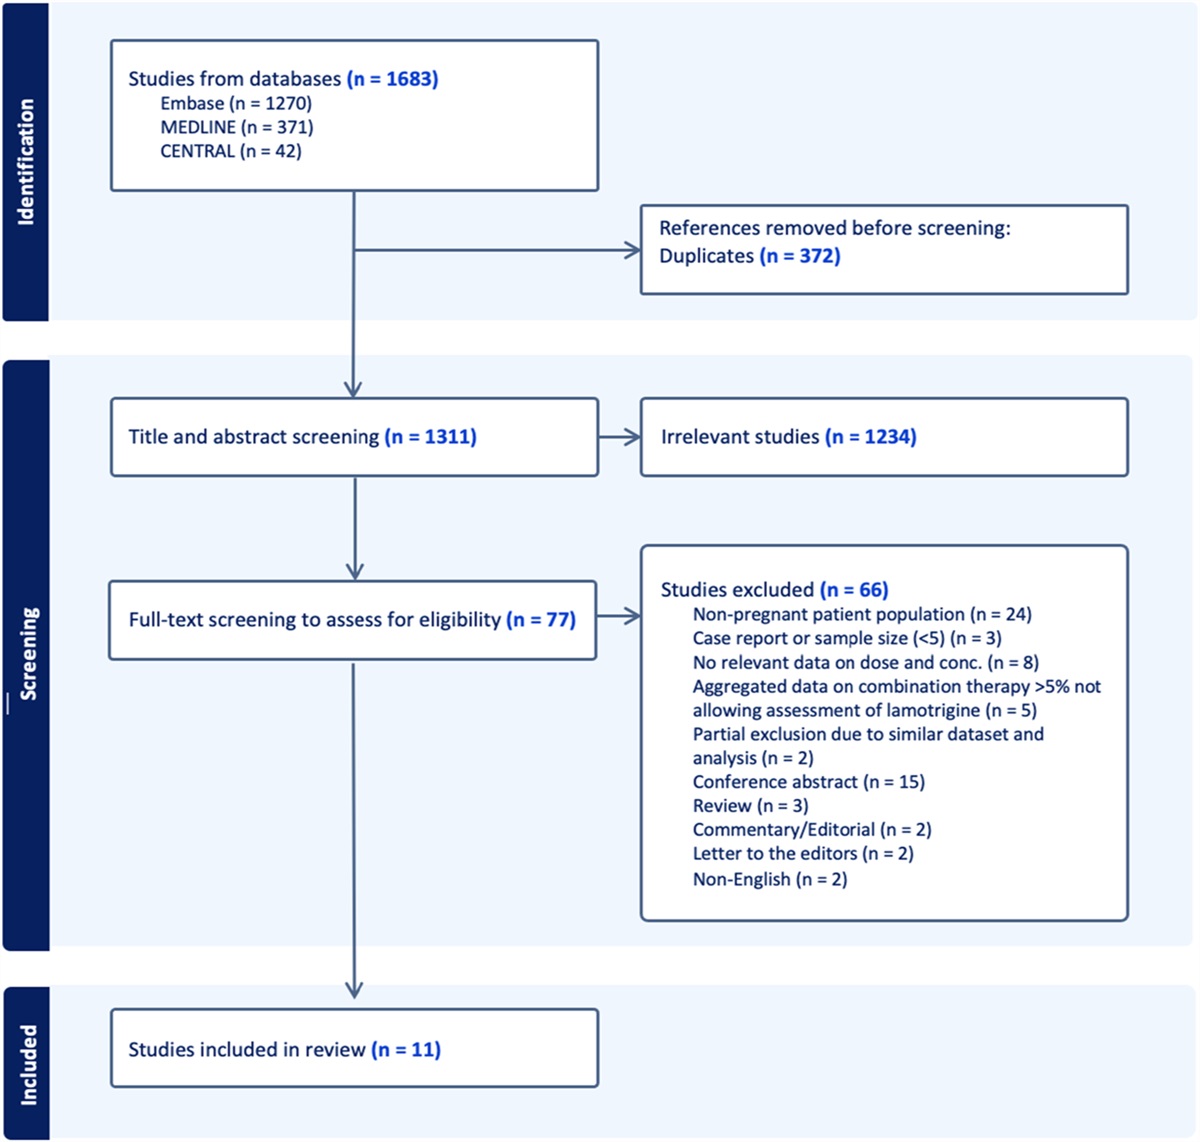
Sepsis and sepsis shock lead to severe organ dysfunction and are life-threatening conditions.1 A total of 48.9 million cases and 11 million sepsis-related deaths occurred worldwide in 2017, accounting for almost 20% of all global deaths.2
Sepsis-causing pathogens must be identified to enable targeted antimicrobial treatment, and antimicrobial agents should be administered early.1 Antibiotics are selected and administered based on the isolation and identification time of the causative organism, including its sensitivity to various antibiotics. When the wait for culture results is not feasible, broad-spectrum meropenem is widely used as an empiric therapy for critically ill patients. The microbial efficacy of meropenem is predicted by the percentage of the dosing interval in which free drug concentrations remain above the infecting organism's time above the minimum inhibitory concentration (% T > MIC).3 Moreover, the bacteriostatic and maximal bactericidal activities require meropenem concentrations of approximately 20,, 30, and 40–50% of the dosing interval above the MIC, respectively.4
The pharmacokinetics (PK) parameters, including the volume of distribution (Vd) and clearance (CL), are markedly affected by the pathophysiological changes observed in patients with severe infectious diseases.5 In particular, patients with a severe sepsis condition may have decreased renal function due to acute renal failure. By contrast, renal function in patients with sepsis may be enhanced due to aggressive fluid resuscitation and vasopressor use, resulting in lowered serum trough concentration of renally excreted drugs. According to Ehmann et al,6 46.2% of patients with creatinine clearance (CCr) ≥ 60 mL/min achieved an MIC ≥ 2 mcg/mL when administered the standard meropenem regimen (1 g every 8 hours as 0.5 hours infusions). Previously, we found that the trough values in patients with sepsis with augmented renal clearance (ARC), defined as a CCr ≥ 130 mL/min, were lower than those in patients with sepsis with CCr < 130 mL/min (0.59 mcg/mL versus 1.73 mcg/mL).7 Accordingly, the standard dosing regimen may not provide sufficient clinical efficacy in patients with sepsis. Therefore, dosing regimens based on renal function must be considered in patients with sepsis.
The dosing regimen should be determined using the population PK (PPK) model to optimize antimicrobial therapy based on renal function. In the PK/pharmacodynamics (PD) analysis of renally excreted drugs, renal function is evaluated using the estimated CCr according to the Modification of Diet in Renal Disease (MDRD) and the Cockcroft–Gault (CG) equations. However, serum creatinine (SCr) levels fluctuate considerably in patients with sepsis due to decreased creatinine (Cr) production and changes in the glomerular filtration rate. In addition, a large volume of fluids is administered to patients with sepsis to maintain the volume of circulating blood, leading to increased body fluid volume and body weight. Renal function in patients with sepsis should be assessed using the measured CCr as the MDRD and CG equations cannot effectively estimate renal function. Previous studies have assessed the meropenem dosing regimen based on the PPK model using the CG or MDRD formulas.8,9
Only few reports revealed the assessment of the renal function of patients with sepsis using the measured CCr. Furthermore, the administration regimen has not been sufficiently evaluated using a PPK model across renal function broad ranges.
The primary aim of this study was to construct a meropenem PPK model using the measured CCr for patients with sepsis. The secondary aim was to assess the optimized meropenem dosing regimen based on the CCr.
MATERIALS AND METHODS Study PopulationThis prospective observational study included 32 patients with sepsis who were administered meropenem at the emergency center or intensive care unit (ICU) of Showa University Hospital between June 2016 and August 2021. The patients were diagnosed by specialized physicians. The exclusion criteria were as follows: <18 years, on hemodialysis, massive bleeding, pregnant women, and death during the 24-hour urine collection. We excluded one patient who met the criteria and evaluated 31 patients with sepsis. The Sequential Organ Failure Assessment (SOFA) score at admission and other background data obtained during blood collection were retrieved. The patient background data included age, sex, weight, body surface area (BSA), body mass index (BMI), SOFA score, and hospital mortality. Blood test data included SCr, CG-CCr, measured CCr, estimated glomerular filtration, white blood cells (WBC), C-reactive protein (CRP), and albumin. The drug-related data included the meropenem dosing regimen.
This study was approved by the Ethics Committee of the Showa University School of Medicine (approval no. 3188). Informed consent was obtained from patients or their legal substitute decision makers according to the principles of the Declaration of Helsinki.
Evaluation of the Measured CCrMost patients in the emergency center or ICU had indwelling urinary catheters. Urine output was measured through 8-hour urine collections, and the measured CCr was calculated using Equation 1. To verify the accuracy of the measured CCr values, the difference between the measured CCr and CG-CCr values of patients with normal renal function (CCr < 90 mL/min) and those of patients with normal or enhanced renal function (CCr ≥ 90 mL/min) was compared using the Wilcoxon rank-sum test.(1)Measured CCr (mL/min)=(Urine Cr (mg/dL)SCr (mg/dL))×Urine output (mL/min)×1.73 m2BSA (m2)
Meropenem AssayMeropenem was administered intravenously at a dose of 0.5 g every 8 or 12 hours and 1 g every 8 or 12 hour for a dosing time of 0.5 hours. The dosing regimens for each patient were determined by specialized physicians based on sepsis and renal function severity. Blood samples were collected from patients who had received at least 3 doses of meropenem. Blood samples were collected during a single dosing interval from 2 to 5 points: predose (trough) and 0.5, 1, 2, 4, and 8 hours after administration. The samples were immediately centrifuged at 3000g for 0.5 hours, and the plasma samples were stored at −80°C until analysis for the meropenem concentration. The meropenem plasma concentration was measured using high-performance liquid chromatography (Shimadzu, Kyoto, Japan).10 Plasma samples (400 µL) were centrifuged at 14,000g for 30 minutes at 4°C, and 5 μL of the internal standard (cefotaxime, final concentration: 30 mcg/mL) was added to 145 μL of the supernatant to prepare the sample. The samples were separated on a CAPCELL PAK C18 UG120 (150 mm × 46 mm, 5 µm) column with a CAPCELL PAK C18 UG120 S5 (4.0 × 10 mm, 5 µm) guard column at 40°C. The mobile phase was a mixture of 0.01 mol/L phosphate buffer at pH 7.4 and acetonitrile (94:6), with a flow rate of 1 mL/min. The detector was set at 300 nm. The calibration curve was linear over the concentration ranges of 0.1 mcg/mL–80 mcg/mL for plasma (R > 0.99). The intermeasurement trueness and accuracy were < 15%.
Analysis and Evaluation of the Meropenem PPK ModelMeropenem PPK analysis was performed using the first-ordered conditional estimate-extended least squares in the Phoenix NLME 8.1 (Certara, Princeton, NJ). Meropenem concentrations were fitted to one-compartment and two-compartment models to identify the most suitable structure models. The intraindividual PPK model variation was evaluated using the additional, proportional, and mixed error models. The interindividual variability was evaluated using an exponential error model. The model was examined using the goodness-of-fit (GOF) plot and objective function value (OFV) test. Validation of the final model was based on the relative standard error (RSE), η-shrinkage, prediction-corrected visual predictive check, and bootstrap sampling (1000 pairs).
Covariate AnalysisCovariate analysis was performed using stepwise forward addition (P < 0.05), followed by backward elimination (P < 0.01). The following covariates were comprehensively evaluated owing to their association with renal function or sepsis severity: age, sex, weight, Alb, SCr, eGFR, measured CCr, CG-CCr, CRP,11 and SOFA score.
PK/PD TargetThe % T > MIC variable indicates the percentage of time (T) that the drug concentration is above the MIC. The % T > MIC for meropenem was set as 50% or 100% T > MIC.
Monte Carlo SimulationMonte Carlo simulations were performed to determine the probability of target attainment (PTA) of achieving a PK/PD target of 50 or 100% T > MIC for various MICs and dosing regimens. Meropenem was intravenously administered over 0.5 hours (intermittent), 3 hours (prolonged), 8 hours, and 12 hours (continuous) in 1 or 2 g and at various dosing intervals (8 and 12 hours) and MICs (0.5–64 mcg/mL) to 10,000 virtual patients based on their renal functions (CCr: 30, 50, 70, 80, 85, 100, 130, 160, and 200 mL/min). The PTA indicates the likelihood of achieving 50 or 100% T > MIC based on 10,000 virtual patients and Monte Carlo simulations and was calculated using Equation 2.(2)PTA=the frequency of 50% or 100% T>MIC in the simulation for each dosing regimen10,000 times×100
Regimens with PTAs of at least 90% were considered optimal. The MIC was based on the relevant Clinical and Laboratory Standards Institute recommendations.12
Meropenem is known to be stable within 12 hours of dissolution.13 A previous study revealed that no adverse events occurred during continuous or prolonged administration of β-lactam antibiotics.14 Thus, the Monte Carlo simulations were performed with continuous and prolonged meropenem administration.
RESULTS Patient CharacteristicsThe patient characteristics are outlined in Table 1. One hundred samples were collected from 31 patients. The patient characteristics (25 men and 6 women) were as follows: age, 72 (18–94) years; body weight, 53.7 (35.3–91.7) kg; BMI, 22.2 (13.8–29.9); SCr, 0.69 (0.29–2.39) mg/dL; CG-CCr, 81.1 (14.0–246) mL/min; measured CCr, 87.6 (12.3–223) mL/min; WBC, 13.0 (2.70–30.6) × 103/µL; and CRP, 11.0 (0.72–41.0) mg/dL [median(range)]. Nine patients used vasopressors. Five patients received intravenous diuretics (16%), and the median daily intravenous fluid volume given for resuscitation was 1000 (200–3900) mL. In addition, 8 (26%) and 3 (10%) patients had CCr ≥ 130 mL/min and CCr ≤ 30 mL/min, respectively. The observed plasma meropenem concentrations in all patients are shown in Supplemental Figure S1 (Supplemental Digital Content 1, https://links.lww.com/TDM/A613). The median (range) trough was 4.04 (1.43–19.7) mcg/mL in patients with CCr < 50 mL/min and 1.13 (0.21–6.34) mcg/mL in patients with CCr ≥ 50 mL/min.
TABLE 1. - Characteristics of Patients With Sepsis (n = 31) Characteristics n (%), Median (Min–Max) Age (yr) 72 (18–94) Male, n (%) 25 (81) Weight (kg) 53.7 (35.3–91.7) BSA (m2) 1.59 (1.26–2.01) BMI (kg/m2) 22.2 (13.8–29.9) SOFA score on admission (points) 8 (2–15) SOFA score at the time of blood collection (points) 6 (0–11) SCr (mg/dL) 0.69 (0.29–2.39) CG-CCr (mL/min) 81.1 (14.0–246) Measured CCr (mL/min) 87.6 (12.3–223) eGFR (mL/min/1.73 m2) 86.0 (15.6–222) Use of vasopressors, n (%) 9 (29) Received intravenous diuretics, n (%) 5 (16) Daily intravenous fluid volume (mL) 1000 (200–3900) WBC (103/μL) 13.0 (2.70–30.6) CRP (mg/dL) 11.0 (0.72–41.0) Alb (g/dL) 2.10 (1.50–3.10) Total sample (points) 100 Sample per patient (points) 2 (2–5) Trough concentration (µg/mL) Measured CCr CCr < 50 (mL/min) 4.04 (1.43–19.7) CCr ≥ 50 (mL/min) 1.13 (0.21–6.34)Data are presented as median value (range) for continuous variables and number and percentage for categorical variables.
The values of measured CCr and CG-CCr in both groups of patients with abnormal (CCr < 90 mL/min) and normal or enhanced renal function (CCr ≥ 90 mL/min) were compared; the results are shown in Supplementary Table S1 (Supplemental Digital Content 4, https://links.lww.com/TDM/A616). In patients with abnormal renal function, no significant difference was found in the value of measured CCr and CG-CCr. By contrast, in patients with normal or enhanced renal function (CCr ≥ 90 mL/min), the CG-CCr value was significantly lower than the measured CCr value. This result indicates that the CG-CCr value underestimates the renal function of patients with normal or enhanced renal function.
PPK ModelThe estimated PPK parameters in the final model and the median values of the parameters calculated by the bootstrap are shown in Table 2. The GOF plots' likelihood ratio tests and visual assessment revealed that a two-compartment model adequately described meropenem concentration data for all patients. The final residual error model was described using the proportional error model.
Table 2. - Final Model PPK Parameter and Bootstrap Validation of Meropenem in Patients with Sepsis Population mean V1 = θ1 θ1 L 26.5 (13.6) 26.6 21.4 36.0 −0.38 CL = θ2×(measured CCr/87.6)θ5 θ2 L/h 13.6 (5.04) 13.6 12.4 15.2 0 θ5 (−) 0.66 (11.9) 0.67 0.52 0.84 −1.52 V2 = θ3 θ3 L 13.2 (21.2) 13.4 9.51 20.0 −1.52 Q = θ4 θ4 L/h 9.80 (43.0) 9.59 2.29 20.3 2.14 Interindividual variability V1 % 23.0 (127) 21.5 0.0003 56.7 6.52 CL % 22.1 (32.4) 21.1 12.7 27.7 4.52 Residual variability Proportional (%) 19.4 (13.1) 18.4 13.0 23.4 5.15The effective interindividual variability on intercompartmental clearance (Q) and peripheral Vd (V2) did not significantly improve the model fit. Therefore, the random effects were fixed at zero. Age, Alb, SCr, eGFR, measured CCr, CG-CCr, and SOFA score were selected as the significant covariates; the results are shown in Supplementary Table S2 (Supplemental Digital Content 5, https://links.lww.com/TDM/A617). Among the covariates, the ΔOFV of the measured CCr was the most significant. These results indicate that the measured CCr values are more suitable than the predicted values calculated using CG-CCr. Thus, the final PPK model incorporating the measured CCr as a covariate in CL had the best fit.
Validation and Evaluation of the Meropenem PPK ModelThe GOF plots of the final PPK model are shown in Supplementary Figure S2 (Supplemental Digital Content 2, https://links.lww.com/TDM/A614). Supplementary Figure S2A, https://links.lww.com/TDM/A614, shows population predictions versus observations (OBS), and Supplementary Figure S2B, https://links.lww.com/TDM/A614 shows individual predictions (IPRED) versus OBS. Both plots were symmetrically distributed and close to the identity line at y = x. Supplementary Fig. S2C, https://links.lww.com/TDM/A614, shows conditional-weighted residuals (CWRES) versus population prediction, and Supplementary Fig. S2D, https://links.lww.com/TDM/A614, shows CWRES versus time after dosing. In both figures, the data were evenly distributed around CWRES = 0. The prediction corrected visual predictive check based on the final model is shown in Supplementary Figure S3 (Supplemental Digital Content 3, https://links.lww.com/TDM/A615). The model was visually valid as the median line between the concentration range predicted by the prediction-corrected visual predictive check and the measured value was within the 95% confidence interval. The mean values, variability, and 95% confidence intervals of the PPK parameters estimated from bootstrap and the RSE of each parameter in the final model are shown in Table 2. The η-shrinkage of V1 and CL were 41.4 and 7.75%, respectively. The parameters estimated in the final model approximated the median values of the parameters calculated by the bootstrap, indicating the final PPK model's acceptable robustness and accuracy. The bootstrap validation showed a 100% success rate.
Probability Target AchievementFigure 1 shows the MIC values required to achieve a PTA of 50% T > MIC of meropenem dosing regimen for patients with different CCr. When administered according to the standard dosing regimen, the MIC values for this achievement were 4 mcg/mL for patients with CCr 50 mL/min, 2 mcg/mL for those with CCr 85–130 mL/min, and 1 mcg/mL for those with CCr 160–200 mL/min. By extending the meropenem dosing time from intermittent to prolonged or continuous infusion, the MIC values for PTA achievement were 4 mcg/mL for patients with CCr 85–130 mL/min and 2 mcg/mL for those with CCr 160–200 mL/min. Table 3 shows the recommended dosing regimens for each renal function range to achieve a PTA of 50% T > MIC of 4 mcg/mL at different CCr. Patients with CCr 84 mL/min had a PTA of 92% with the standard meropenem dosing regimen, whereas those with CCr 85 mL/min failed to achieve this PTA. The regimen that could enable a PTA of 50% T > MIC was required at 1 g every 8 hours as a prolonged infusion for patients with normal renal function (CCr 85–129 mL/min) and 1 g every 8 hours as a continuous infusion for ARC patients (CCr ≥ 130 mL/min). Figure 2 shows the PTA of 100% T > MIC of 4 mcg/mL at different CCr and the meropenem administration methods. The respective PTAs for a 0.5-hour intermittent infusion, 3-hour prolonged infusion, and 8-hour continuous infusion of 1 g every 8 hours at CCr 50 mL/min were 37%, 60%, and 97%, respectively. The PTA for a 12-hour continuous infusion of 2 g every 12 hours for patients with CCr 70–100 mL/min was 90% (93.3%–98.5%). The PTAs for an 8-hour continuous infusion of a high-dosing regimen (2 g every 8 hours) for patients with CCr 130–160 and 200 mL/min were 90% and 89%, respectively.
 FIGURE 1.:
 The PTA for various meropenem dosing regimens for the achievement of 50% T > MIC in patients with sepsis with CCr of (A) 50 mL/min, (B) 85 mL/min, (C) 100 mL/min, (D) 130 mL/min, (E) 160 mL/min, and (F) 200 mL/min. The dosing regimen was 1 g every 8 hours. The dashed lines indicate a PTA of 90%, above which the PTA was considered successful. 50% T > MIC: 50% time above MIC.
TABLE 3. - PTA for Meropenem Regimens Achieving 50% T > MIC in Patients with Sepsis Based on CCr PTA (%) of 50% T > MIC at the Indicated MIC (µg/mL) CCr (mL/min)/dosing regimen 0.5 1 2 4 8 16 CCr 50–84 1 g every 8 h (0.5-h infusion) 100 100 100 92 34 0 CCr 85–99 1 g every 8 h (0.5-h infusion) 100 100 99 78 15 0 1 g every 8 h (3-h infusion) 100 100 100 98 40 0 CCr 100–129 1 g every 8 h (0.5-h infusion) 100 100 94 53 4 0 1 g every 8 h (3-h infusion) 100 100 100 92 16 0 CCr 130–159 1 g every 8 h (0.5-h infusion) 100 99 83 31 1 0 1 g every 8 h (8-h infusion) 100 100 100 97 13 0 CCr 160–200 1 g every 8 h (0.5-h infusion) 100 95 64 13 0 0 1 g every 8 h (8-h infusion) 100 100 100 90 4 0The results for an MIC of 4 mcg/mL, corresponding to the MIC of isolated pathogens, the clinical MIC breakpoint for meropenem susceptibility of most bacteria according to CLSI, are shown in bold. The upper panel shows the standard dosing regimen: 1 g every 8 h (0.5 h infusion); and the lower panel shows the recommended dosing regimen. Regimens with PTAs of at least 90% were considered optimal. PTA: probability of target attainment, MIC: minimum inhibitory concentration, 50% T > MIC: 50% time above the MIC, CCr: creatinine clearance, CLSI: Clinical and Laboratory Standards Institute.
 FIGURE 2.:
 The PTA of meropenem (100% T > MIC) at different CCr, dosing regimen, and administration methods for a meropenem target MIC of 4 mcg/mL. The dashed lines indicate a 90% PTA, above which the PTA was considered successful. 100% T > MIC: 100% time above MIC, (A) intermittent infusion is 0.5 hours, (B) prolonged infusion is 3 hours, and (C) continuous infusion is 8 hours or 12 hours.
DISCUSSIONThe construction of a model that could accurately predict meropenem concentrations in patients with sepsis by the accurate assessment of renal function using measured CCr served as the novelty of this study. In addition, the recommended administration regimen that could achieve PTA based on the renal function and pathogen's MIC was demonstrated using this model. The meropenem administration time of patients with CCr ≥ 85 mL/min should be extended as the standard dosing regimen cannot lead to the PTA of 50% T > MIC of 4 mcg/mL. Moreover, the administration time should be extended for patients with CCr ≥ 70 mL/min, and the dose should be increased to 2 g to achieve the PTA of 100% T > MIC of 4 mcg/mL. Therefore, the effectiveness of meropenem in patients with sepsis can be maximized by selecting the appropriate dosing regimen based on renal function and MIC.
The meropenem PPK model for patients with sepsis was constructed using a two-compartment model, with measured CCr as the most significant covariate. CG-CCr was frequently included as a CL covariate in the antibiotics PPK model.8,9 The PPK parameters in this study were similar to those previously reported for patients with sepsis.15 As CG-CCr is estimated using factors such as age, weight, and SCr, it is markedly affected by these factors. Arulkumaran et al16 reported that SCr values in patients with sepsis were elevated in the first 3 hours, normalized after 12 hours owing to fluid resuscitation, and increased after 24 hours. The correlation coefficient between CG-CCr and the measured CCr (8-hour urine collection) in critically ill patients admitted to the ICU was 0.2, with a precision as low as 40%.17 In addition, body weight in critically ill patients was temporarily increased by fluid resuscitation, resulting in a greater difference from the desirable weight. In this study, the CG-CCr values underestimated the renal function of patients with normal and enhanced renal function. Thus, the renal function of these patients must be accurately assessed using the measured CCr. Accordingly, renal function in patients with sepsis may not be accurately assessed by CG-CCr equations, including factors such as body weight and SCr. By contrast, the measured CCr (24-hour urine collection) is reported to correlate with the meropenem trough concentration in patients with severe infections (r = 0.76, P < 0.001).18 The correlations between the measured CCr from 8-hour urine and 24-hour collected urine have been reported.19 In this article, patients with sepsis who were admitted to the ICU and emergency center were assessed. These patients mainly had indwelling urinary catheters to accurately measure urine output or renal function or enable passive urination when they were unable to urinate on their own. Therefore, we aimed to minimize the circadian fluctuation of renal function, promote clinical convenience, and more accurately assess renal function by analyzing the measured CCr from 8-hour urine collections.
In this study, CCr was measured by an 8-hour urine collection to more accurately evaluate the renal function. Therefore, a precisely accurate model was constructed to estimate the meropenem concentration based on measured CCr.
The breakpoints for antimicrobial agents are known to differ for each bacterium.12 We demonstrated that meropenem PTA against Pseudomonas aeruginosa (MIC 4 mcg/mL) could be achieved by changing to prolonged infusion in patients with CCr 85–129 mL/min and continuous infusion in patients with CCr 130–200 mL/min. Of note, the PTA of meropenem against anaerobic bacteria (MIC 8 mcg/mL) could not be achieved with prolonged or continuous infusion in patients with CCr ≥ 85 mL/min. However, PTA could be achieved by increasing the meropenem dose to 2 g per dose. Thus, the PTA may be achieved with the recommended dosing regimen based on renal function and target MIC.
Recent studies have opted to focus on the association between the decreased plasma concentrations of antimicrobial agents and PTA in ARC patients.20,21 In this study, patients with sepsis with normal renal function (CCr ≥ 85 mL/min) could not achieve PTA (50% T > MIC of 4 mcg/mL) with the standard dosing regimen. The PK of the antimicrobial agents differs between patients with sepsis and those with other localized infections. Factors, including inflammatory mediators, nitric oxide, and vascular endothelial growth factor, are induced in sepsis, causing increased vascular permeability.11 In addition, body fluid is transported from the blood vessels into interstitial tissue spaces, resulting in increased Vd for water-soluble drugs.5 Parameters that reflected the inflammatory mediators were not measured in this study; therefore, the reason for the failure to meet the target PTA remains unclear. However, the median CRP and WBC of patients were as high as 9.25 (0.72–41.0) mg/dL and 13.0 (2.70–30.6) × 103/µL, respectively, indicating the inflammation severity. Therefore, the blood concentration of meropenem in patients with sepsis with normal renal function (CCr ≥ 85 mL/min) decreased due to increased drug tissue penetration. A prediction model that considers factors, such as systemic inflammation and increased vascular permeability, should be constructed in the future.
When the standard regimen was administered, patients with sepsis with normal renal function (CCr 85–129 mL/min) required prolonged infusion and those with ARC (CCr ≥ 130 mL/min) required continuous infusion to achieve PTA. Previous research suggests that continuous infusion takes less time to normalize WBC counts than intermittent infusion.14 In patients with sepsis with normal renal function, the meropenem dose required to achieve PTA is 2–4 times higher with intermittent infusions than continuous infusions.22 Therefore, continuous infusion will be a useful administration method for the efficacy and safety of antimicrobial agents as it maintains the meropenem concentration above the target MIC without increasing the dose.
In patients with bacterial infections, the clinical cure rate of meropenem was 36% for 0%–50% fT > MIC as the therapeutic target; however, the rate increased to 80% for 76%–100% fT > MIC.23 Therefore, the meropenem dosing regimen must be considered to achieve a PTA of 100% T > MIC. In this article, the achievement of PTA of 100% T > MIC was also assessed. The PTA in patients with CCr ≥ 70 mL/min was not achieved with the standard regimen, such as prolonged or continuous infusion. Therefore, the standard dosing of 3 g/d may be insufficient to achieve a PTA of 100% T > MIC. Extending the dosing times and administering higher doses to patients with CCr ≥ 70 mL/min are necessary.
LIMITATIONSOur study had four limitations. First, the effect of interday variability on meropenem concentration could not be assessed in the PPK model construction. Second, the interindividual variability in V1 was as high as 127%. Thus, the sample points in the elimination process might have been insufficient. Third, as the number of participants was small (31 patients), the model could not be rigorously verified by external validity. Fourth, the clinical efficacy of the recommended meropenem administration of this model was not evaluated. Despite these limitations, the study findings have important clinical implications as dosing regimens were recommended for different renal functions in patients with sepsis.
CONCLUSIONSThe constructed model precisely predicted meropenem concentration in patients with sepsis by accurately evaluating renal function using the measured CCr. In this article, extended dosing was demonstrated to be necessary to achieve a PTA of 50% T > MIC for patients with CCr ≥ 85 mL/min. Furthermore, the meropenem regimen with extended administration time and increased dose was necessary to achieve a PTA of 100% T > MIC for patients with CCr ≥ 70 mL/min. The effectiveness of meropenem in patients with sepsis can be maximized by selecting the appropriate dosing regimen based on renal function and the MIC.
留言 (0)