This was a mixed methods study including qualitative and quantitative data collection to support the primary aim of the study, and quantitative data collection to answer the secondary aim of the study.
Translation
Translations followed gold standard methods. Firstly, two translators, both with Swahili as their mother-tongue, independently translated WEMWBS from English into Swahili. Secondly, the translators shared their independent translations and worked together to produce one common consensus version of WEMWBS in Swahili. Notes were taken to document issues addressed and how they were resolved. The Swahili version of WEMWBS was sent to two translators who had never seen the original WEMWBS and they independently translated the Swahili version back into English. Although ideally, these would have been people with English as their mother-tongue, our translators were native Swahili speakers with fluent English. The two new English versions and associated notes were sent to Sarah-Stewart Brown (SSB) (one of the WEMWBS developers) who compared these against the original WEMWBS with any minor points for further discussion noted at this point. Further discussion with a native Swahili speaker (not one of the previous translators), alongside the translations and notes, further refined the translated version into the final Swahili WEMWBS.
Sample size, setting and participants
There is a lack of consensus about how to calculate sample size for validation studies for scales, with recommendations varying from a participant to item ratio of between 2 and 20 participants per item, to absolute recommendations e.g.; Comrey and Lee state 100 = poor, 200 = fair, 300 = good, 500 = very good, ≥ 1000 = excellent [8]. We considered both the sample required for the validation study, as well as our secondary aim (to investigate the determinants and distribution of wellbeing in the population examined). In order to sample enough adults to be able to have an appropriate sample size for the validation in adults, we planned to visit 100 schools, and for this reason we were able to collect data from far more students that necessary for the validation studies alone at little extra expense. These data allowed us to examine the associations between the WEMWBS and socio-demographic characteristics of participants.
CAMFED Tanzania operates within 28 districts (15 rural and 13 peri-urban districts); we purposively selected 5 of these districts based on criteria to allow a cross section of district characteristics (rural, peri-urban; coastal, inland; higher and lower scores on national exams) and bearing in mind practical considerations (for example, journey times for fieldworkers, budgetary constraints). We drew up lists of GEC schools in each of the 5 selected districts and randomly selected schools in each for our sample according to the number of supported schools in the district (between 10–34 selected schools per district = 90 schools in total).
At each school a target sample of 34 students were randomly selected from the school student roll (in a few schools there were fewer than 34 students in the specified forms), additionally 2 teachers were randomly selected from the staff list. Each school has a single teacher mentor and usually 3 learner guides engaged in delivering the GEC fund project all of whom were invited to take part in the study. These approximately 40 individuals per school were invited to participate. The fieldworker visited the school and described the project, giving the opportunity for prospective participants to ask questions, and provided the prospective participants with participant information sheets and consent forms (including second copies of these for parents and guardians if the participant was a student). They were given a minimum of 24 h to consider the information and return the consent form. No student or teacher declined consent although we planned to randomly select a further participant from the appropriate group if that situation arose (including a teacher to replace a teacher mentor in the situation that a teacher mentor declined participation).
Eight schools were purposively chosen for focus groups with students, and either older (forms 3 and 4- usually aged 17 +) or younger (forms 1 and 2- usually aged 15 +) adolescents from that school were invited to participate (four focus groups of younger or two of older adolescents respectively). Eight different schools were purposively chosen for focus groups with adults and all teachers and learner guides taking part in quantitative data collection at those schools were invited to participate. For the adult focus groups, teachers or learner guides came together from across participating schools for the four focus groups. The schools were chosen in order to reflect varying school characteristics. Equal numbers of urban and rural schools participated in qualitative data collection.
Data collection
A questionnaire to collect quantitative data was designed by the research team comprising OO, SSB, LB, DK and LW, based on questions that have been used in existing established survey questionnaires. It was designed to take approximately 15 min to complete.
The quantitative data set included: the WEMWBS, comparator questions (The World Health Organisation- Five Well-being Index (WHO5), the 12-item General Health Questionnaire (GHQ-12), Office for National Statistics-4 (ONS-4) and self-reported health), socio-demographic variables (age, sex, ‘marginality indicators’ (a set of 20 questions based on Tanzania’s national guidelines for the Care and Support of the Most Vulnerable Children)) and questions relating to GEC exposure, collected directly from participants via questionnaires on tablets using the Open Data Kit application. Please note that the short form of WEMWBS (SWEMWBS) uses 7 of the 14 WEMWBS items.
Data collection was completed by a team of 20 fieldworkers from the Tanzanian chapter of CAMA, the pan-African network of educated young African women (graduates of the CAMFED programmes), after training by the CAMFED Monitoring and Evaluation team and OO, and with continuous supervision by DK, the Head of Monitoring and Evaluation at CAMFED.
At the end of every day of data collection, the data were submitted into the CAMFED server for secure storage. These data were checked for quality, specifically that the data matches what is expected (the no. of participants for example, and that there were no duplicates).
Qualitative data were collected in 12 focus groups run after quantitative data collection in a subset of the schools, as part of the validation, in order to ask about participants’ experiences of completing the questionnaire, particularly their thoughts on the different wellbeing questions asked. In addition, the topic guide included questions on the concept of mental wellbeing more generally. Focus groups were recorded in Swahili on an encrypted audio recording device then transcribed by the CAMA fieldworkers who collected the data. Data were anonymised during transcription. Translation was then completed by CAMA fieldworkers and some English teachers based within GEC secondary schools, known to CAMFED and previously commissioned for similar work. Twelve focus groups were used, based on pragmatic considerations and with the expectation that data saturation would be reached (it was).
Qualitative analysis
Both inductive and deductive qualitative analytical techniques were used to analyse the content of the transcripts in English. This analysis was part of the validation and explored the acceptability and comprehensibility of the WEMWBS tools (and comparator tools) as well as what the concept of wellbeing means to the participants and whether WEMWBS captured this (with the deductive analysis specifically testing whether concepts relating to WEMWBS were present in the testimony). Coding was completed by one researcher (BW) and with reflection with a second researcher throughout the process (OO).
Confirmatory factor analysis
Confirmatory factor analysis (CFA) was performed for validation of the Swahili (S)WEMWBS in three steps: (1) specification of theoretical model, (2) modification based on potentially misspecified parameters, and (3) assessment of global fit of the modified model and the relative difference (RD) of parameters between theoretical and the modified model (\(\frac_-_}_}\)). The modified model was considered appropriate when (i) no parameters were severely misspecified, (ii) RD in loadings compared to the theoretical model was negligible (max. RD < 10%), and (iii) global fit indexes fell within pre-defined ranges of acceptability. We used thresholds for good fit (CFI & TLI > 0.95, RMSEA & SRMR < 0.06) and acceptable fit (Comparative Fit Index (CFI) & Tucker-Lewis Index (TLI) > 0.90, Root Mean Square Error of Approximation (RMSEA) & Standardised Root Mean Square Residual (SRMR) < 0.08). This three-step CFA allowed us to model sources of error that could be substantively irrelevant (i.e., produced negligible parameter bias or RD) but improved the precision of reliability indices (diminishing the risk of overestimating scores' reliability).
We used MacDonald's ω as a reliability index because it accounts for factor structure (including, for example, correlated residuals) and is more appropriate when the loadings vary – α is reported for discussion. Two sets of cut-off values have been considered for ω. The first is a traditional, scaled set of cut-off values: excellent (> 0.90), good (> 0.80), acceptable (> 0.70), questionable (> 0.60) and poor (> 0.50). The second is practical: adequate for general purpose or research > 0.70, best for high-stakes decisions > 0.90). We also evaluated factor score determinacy (FD: acceptable > 0.80, good > 0.90 – Grice, 2001) for use of loading-based scores and construct replicability (H: acceptable > 0.70, good > 0.85 – Hancock & Mueller [9]) or specifying SEM.
Measurement invariance was examined following Wu and Estabrook’s [10] recommendations for models with ordinal indicators (such as WEMWBS), assessing changes in the same fit indices used for global fit evaluation. Following Rutkowski and Svetina [11] changes in CFI of up to -0.02 and RMSEA of up to 0.03 were considered appropriate for tests of metric/weak invariance, while ΔCFI ≥ -0.01 for and ΔRMSEA ≤ 0.01 were considered appropriate for scalar/strong invariance tests. We also considered Chen's [12] recommendation of a change in SRMR ≤ 0.030 (for metric invariance) or ≤ 0.015 (for scalar or residual invariance).
The data for indicators in all instruments was skewed due to increased concentration in the higher (better) values; with endorsement of the highest response category over 40% in some items. All instruments presented sparse data with more than half of their items having < 0.5% of endorsement in the lowest (i.e., worse scoring) response category. Therefore, following DiStefano et al. [13] guidelines, we evaluated each model both with and without collapsed response categories. Models were fitted using unweighted least squares estimator with mean and variance adjusted (scale-shifted approach, ULSMV) since is best suited for ordered data with skewed distributions.
Details and justification about cut-off values, specification of the models, assessment, and modification of misspecified parameters, and chosen estimator are given in Supplemental Materials.
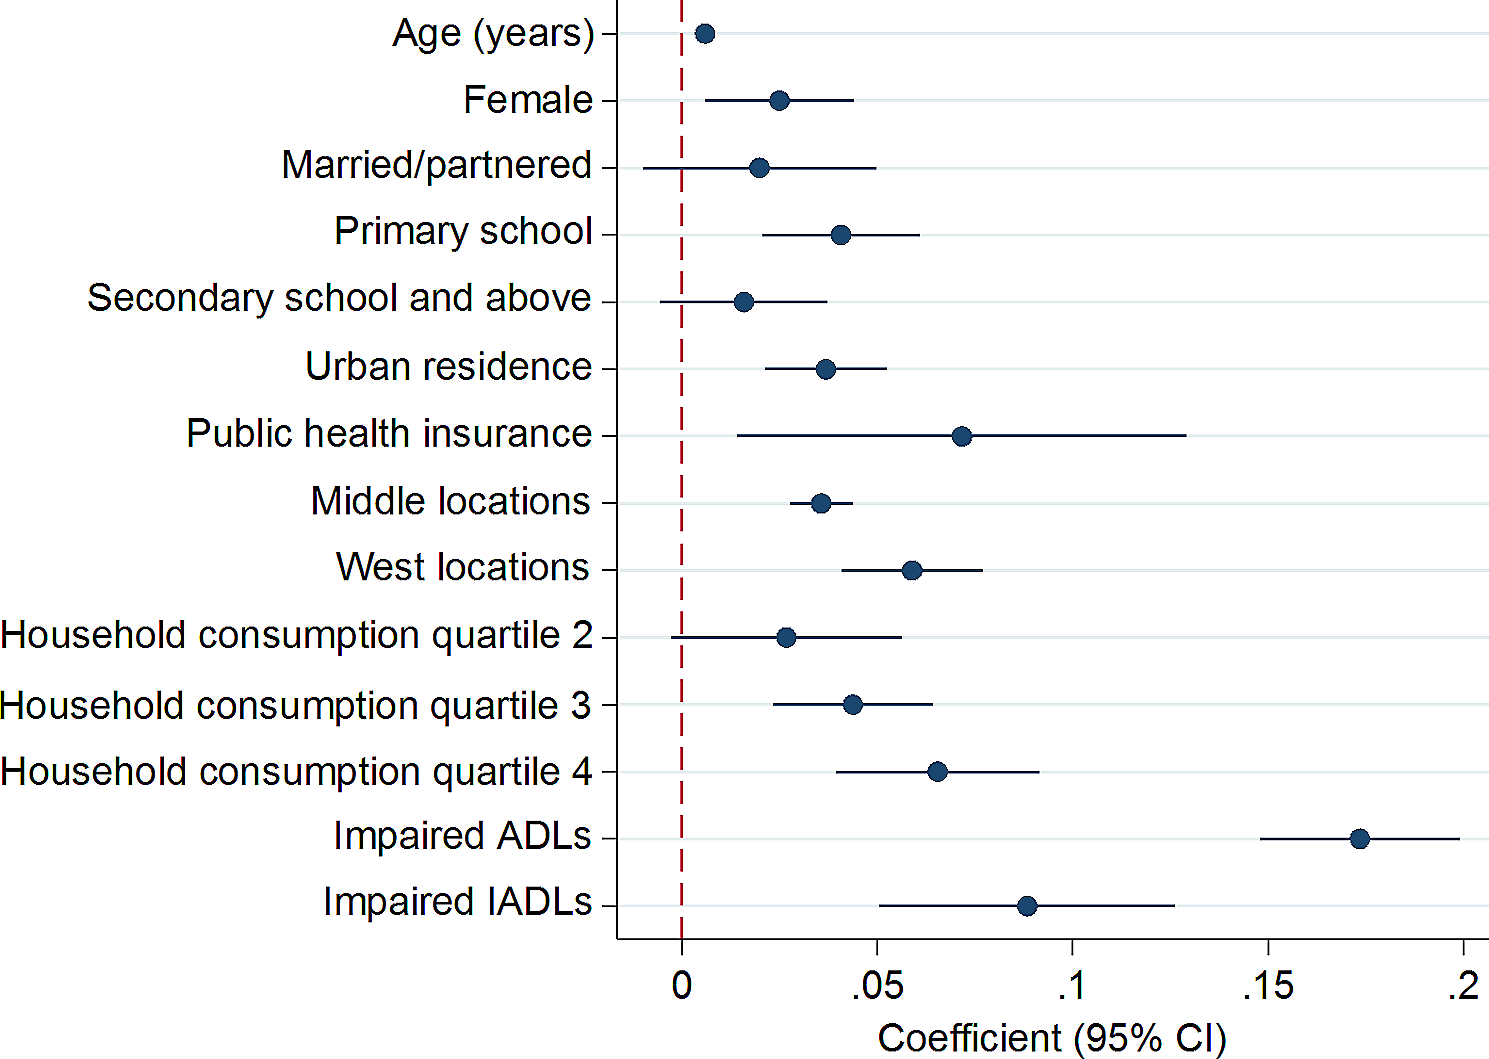
Multivariable analysis
To address the secondary aim of this study, we defined groups within the population, those with low mental wellbeing, scoring below the lowest quartile in our data; those with high mental wellbeing scoring above the highest quartile. Logistic regression models were used to generate odds of low mental wellbeing compared to the rest of the population and to generate the odds of high mental wellbeing compared to the rest of the population in two sets of models. Unadjusted models included each characteristic in turn (gender, age group, location (urban vs rural), self-reported health, form (adolescents only), marginality (adolescents only), education (adults only), role (adults only), main occupation (adults only)) and fully adjusted multivariable models included a subset of characteristics of interest, selected based on theory to reduce multicollinearity (sex, location, self-reported health, form(adolescents only), marginality (adolescents only), role (adults only) and education (adults only)).
Software
CFA and the correlation among test scores were modelled within the R language and environment (r core team, 2020) using the lavaan package [14] and related helper functions within the semTools package [15] such as reliability (for α and ω) and miPowerFit (for EPC and MI analysis), as well as the BifactorIndicesCalculator [16] for H and FD indices. Qualitative analysis was completed using Microsoft Word. Descriptive statistics, univariable and multivariable regression analyses were conducted in StataIC version 16.1.

留言 (0)