
記住我

Between May 2020 and July 2022, a total of 91 patients were found eligible for inclusion. Thirty patients were excluded: in thirteen patients the time interval between WB-MRI and 18F-FDG-PET/CT exceeded 15 days, 9 patients underwent a chemotherapy treatment session between the WB-MRI and 18F-FDG-PET/CT examinations and 8 patients refused to participate.
A total of 61 patients were evaluated (37 men, 24 women, mean age 30.7 ± 18.25 years). Thirty-four patients were treatment naïve (baseline) and 27 patients were under treatment (interim). Among the 34 treatment naïve patients, 28 had HL and 6 had DLBCL, whereas all the 27 patients under treatment had HL (25 patients were receiving doxorubicin hydrochloride, bleomycin sulfate, vinblastine sulfate, and dacarbazine (ABVD), whereas 2 received brentuximab vedotin, doxorubicin, vinblastine, and dacarbazine (A + AVD)). Baseline characteristics are shown in Table 1.
Table 1 Patients’ baseline characteristicsThe median interval between baseline 18F-FDG-PET/CT and WB-MRI examinations was 7 days (range 1–12 days).
StagingA total of 610 nodal regions were analyzed; among these, 132/610 (22%) were considered positive at 18F-FDG-PET/CT and 478/610 (78%) as negative. At WB-MRI, 127/610 (21%) were positive and 483/610 (79%) negative; 3/127 regions (2%) considered as positive at WB-MRI were negative at 18F-FDG-PET/CT, considered as false positive (1 cervical, 1 mesenteric and 1 lesion classified as “other regions” that was located at the hepatic hilum), whereas 124/ 132 were true positive (94%). Furthermore, WB-MRI did not detect 8/132 PET positive regions (6%, 1 axillary, 1 mediastinal, and 6 hilar regions), thus considered WB-MRI false negatives.
For the assessment of nodal involvement in all regions, the PPV and NPV of WB-MRI were respectively 0.98 (95% CI 0.93 to 0.99) and 0.98 (95% CI 0.97 to 0.99). The observed agreement between 18F-FDG-PET/CT and WB-MRI for all nodal regions was 0.98 (599/610, 95% CI 0.97 to 0.99); Cohen’s kappa coefficient was 0.95 (95% CI 0.92 to 0.98). Additional results are shown in Table 2(a).
Table 2 Positive predictive value (PPV), negative predictive value (NPV) of WB-MRI, Cohen’s kappa and observed agreement between WB-MRI and 18F-FDG-PET/CT for the identification of (a) nodal lesions, (b) extra-nodal lesionsBoth 18F-FDG-PET/CT and WB-MRI identified extra-nodal involvement in the liver, spleen, and bone marrow with the same accuracy. Of 61 liver regions, 61 splenic regions, and 61 bone marrow regions analyzed, 17/183 (9%) were considered positive and 166/183 (90%) as negative at both 18F-FDG-PET/CT and at WB-MRI. For the assessment of extra-nodal involvement in all regions, the PPV and NPV of WB-MRI were 1.00 (95% CI 0.82 to 1.00) and 1.00 (95% CI 0.82 to 1.00), respectively. The observed agreement between 18F-FDG-PET/CT and WB-MRI for all extra-nodal regions was 1.00 (183/183, 95% CI NA); Cohen's kappa coefficient was 1.00 (95% CI NA). Additional results are shown in Table 2(b).
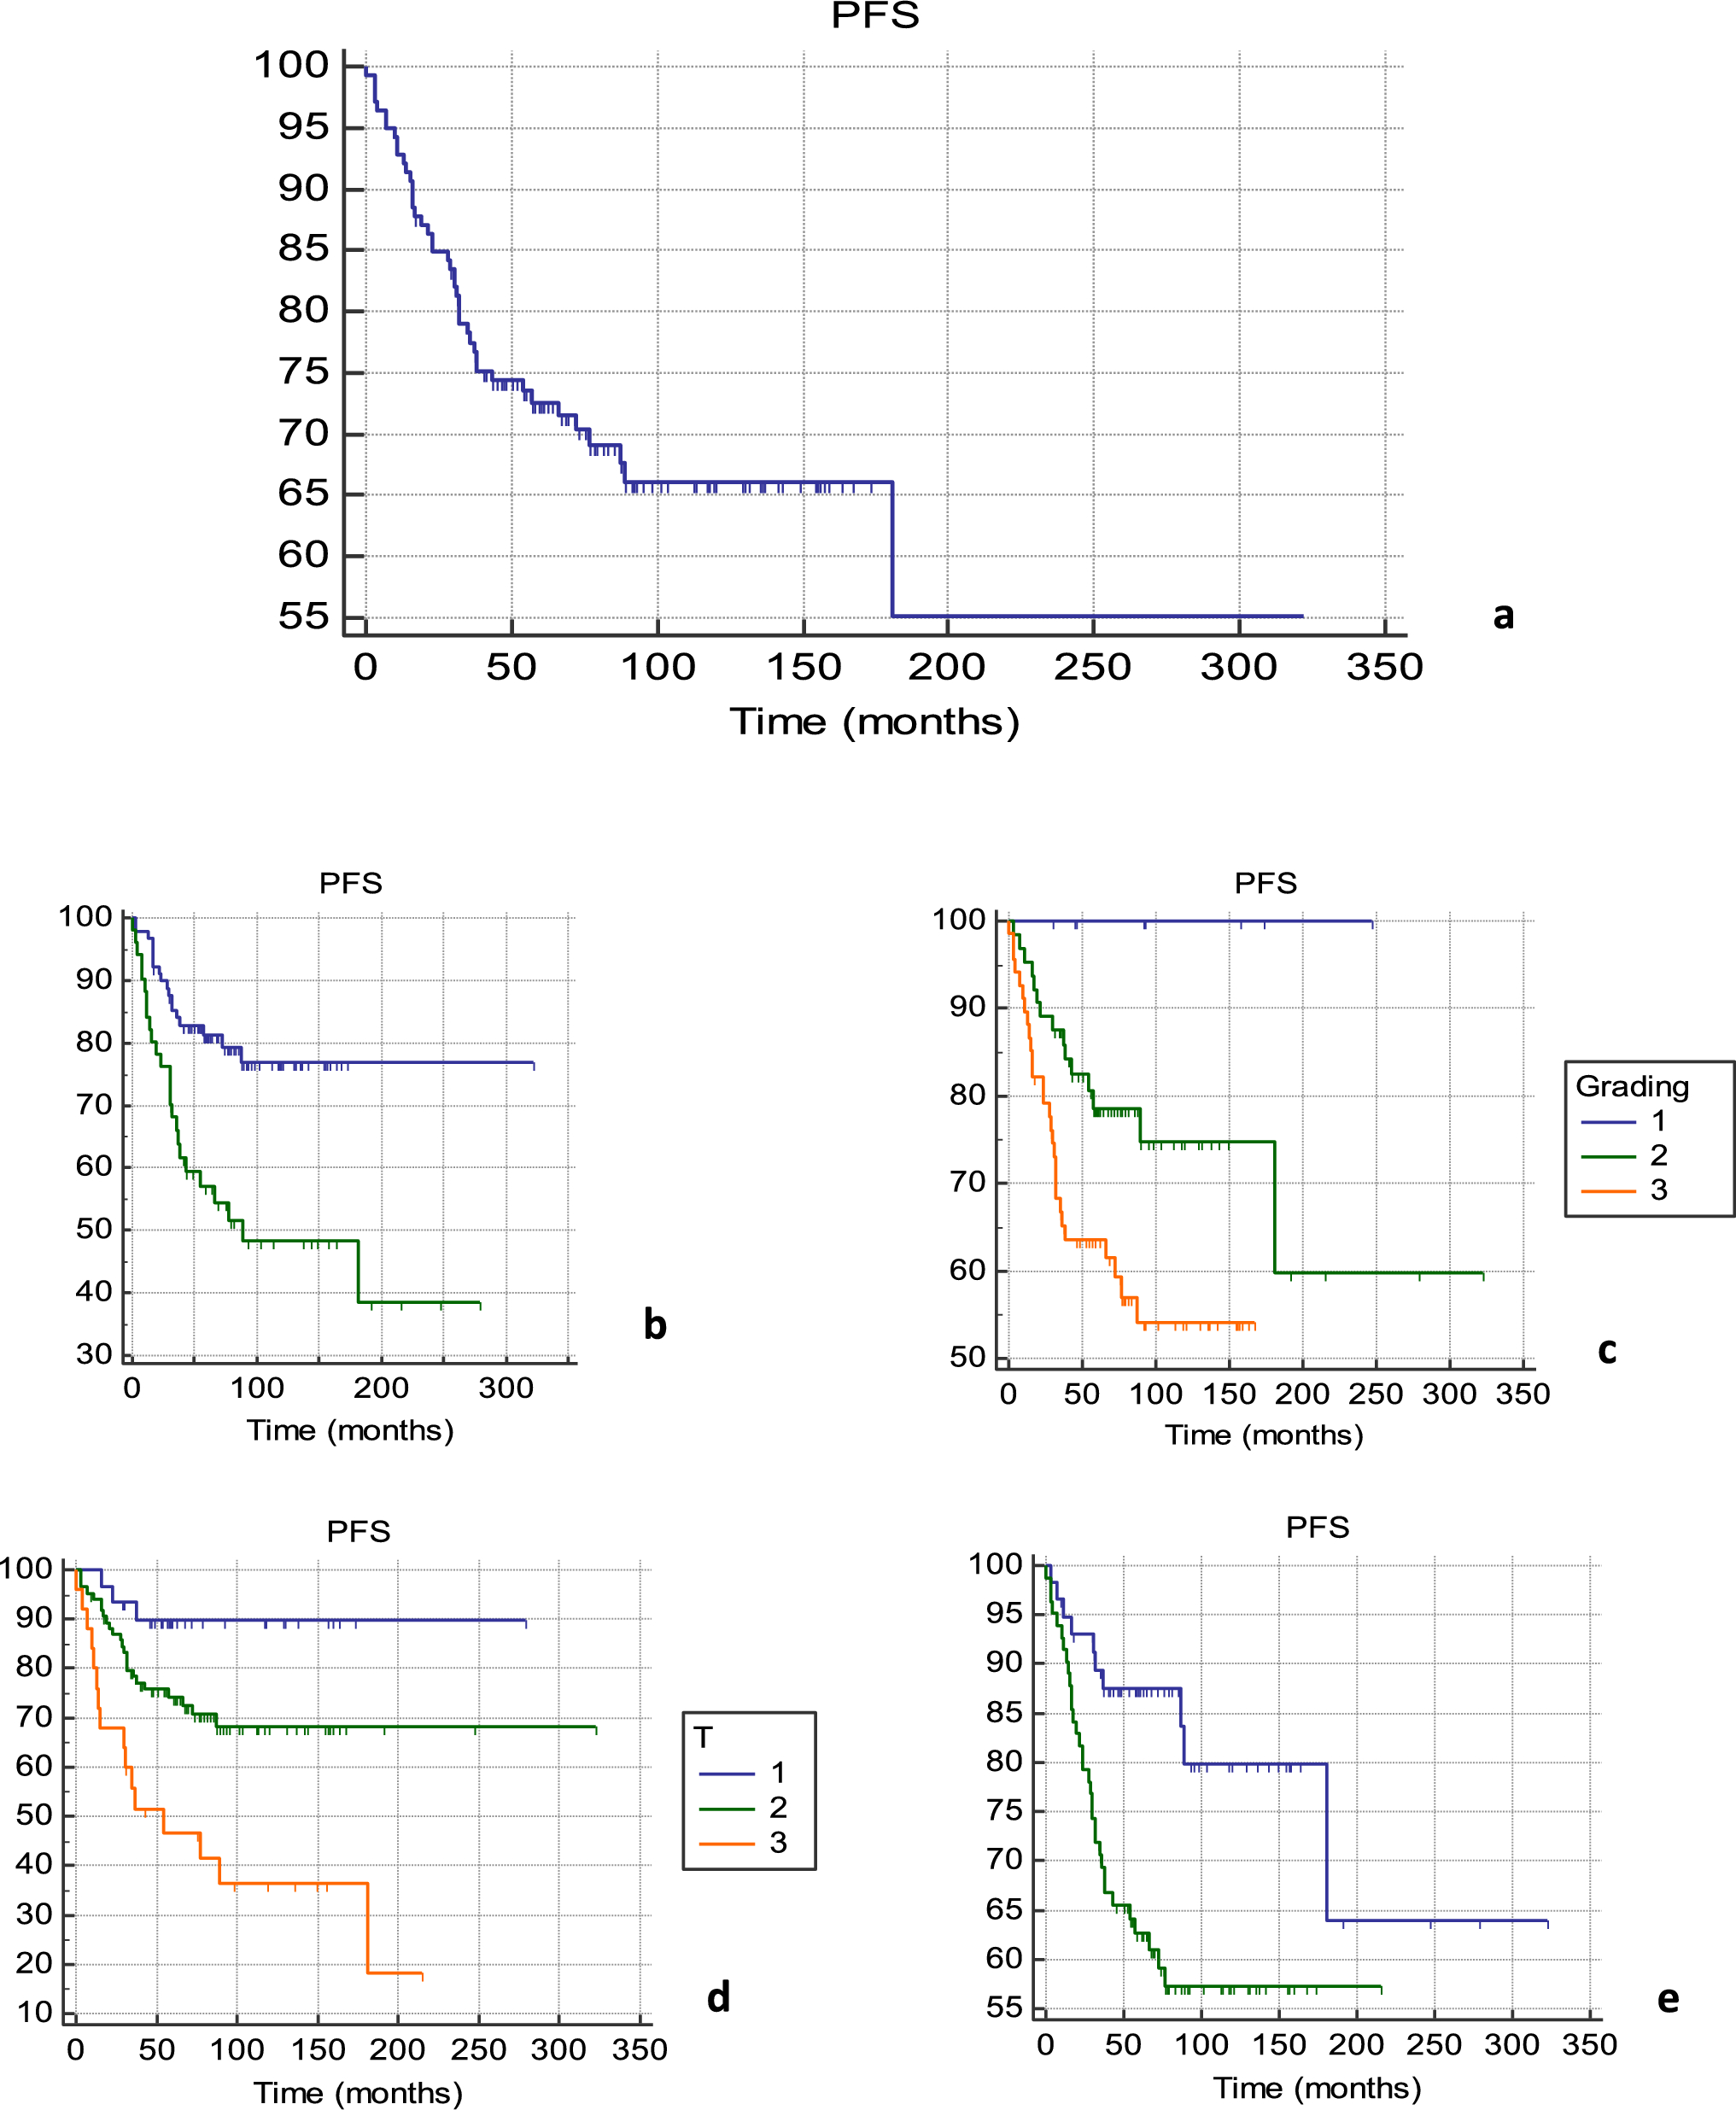
With regard to the staging, according to the reference standard evaluation, 13/61 (21%) patients were stage 1, 27/61 (44%) stage 2, 11/61 (18%) stage 3, and 10/61 (16%) stage 4. The agreement between 18F-FDG-PET/CT and WB-MRI for staging was 1.00 (95% CI NA).
Quantitative analysisBased on the Bland–Altman plot of measurements of two observers, ADCmin value measurement exhibits a bias of -0,011 and 95% limits of agreement of − 0.16 × 10⁻³ mm2/s and 0.14 × 10⁻³ mm2/s and ADCmean value a bias of − 0.0050 and 95% limits of agreement of − 0.18 × 10⁻³ mm2/s and 0.16 × 10⁻³ mm2/s.
The mean ADCmin value of all nodal lesions analyzed was 0.764 ± 0.321 × 10⁻³ mm2/s, and the mean ADCmean value of all nodal lesions analyzed was 0.974 ± 0.384 × 10⁻³ mm2/s. ADC and SUV values in the subgroups are reported in Table 1.
The median SUVmax value was 5.2 (IQR 2.5–11.7) and the median SUVmean 3.1 (IQR 2.6–4.0). A significant difference was found between baseline and interim ADCmin (p < 0.001) and ADCmean (p < 0.001) values, with higher values at interim. A significant difference was found between baseline and interim SUVmax (p < 0.001) and SUVmean (p < 0.001) values, with higher values at baseline. A negative correlation between ADCmean and SUVmean (Spearman correlation coefficient rs= − 0.61, p = 0.001) was found in naïve patients, whereas no correlation was found between ADCmean and SUVmean values at interim. 18F-FDG-PET/CT parameters were not correlated with ADCmin (p > 0.05).
Subgroup analysis: variation of 18F-FDG-PET/CT and WB-MRI parameters during treatment in patients with Hodgkin lymphomaEight participants with HL underwent both baseline and interim examinations, following 2 treatment cycles with ABVD (Fig. 1). At the interim examination, all 8 patients had a complete response, based on the Lugano classification [4]; the Deauville score was 1 in 4/8 (50%) patients, 2 in 2/8 (25%) patients and 3 in 2/8 (25%) patients. The median interval between baseline 18F-FDG-PET/CT and WB-MRI examinations was 5 days (range 1–8 days) whereas between interim examinations was 8 days (range 3–12 days).
Fig. 1
Baseline (A-E) and interim (F-I) Whole Body-MRI (WB-MRI) in a 31-year-old man with a mixed cellularity lymphoma and multiple confluent right supraclavicular nodal lesions at baseline that reduced in size at interim. At baseline, the lesions appear as hyperintense in the axial Diffusion Weighted image (b = 800 s/mm2) (A) and hypointense in the axial grayscale inverted Diffusion Weighted image (b = 800 s/mm2) (B). C On the baseline WB-MRI Apparent Diffusion Coefficient (ADC) map, the lesions appear as hypointense. D Baseline PET/CT shows large confluent nodal lesions in the same region with a high SUV value. E Coronal grayscale inverted MIP DW-MRI shows the same lesions that appear hypointense. At interim, the lesions appear significantly reduced in size and less hyperintense than baseline in the axial Diffusion Weighted image (b = 800 s/mm2) and (F) less hypointense than baseline in the axial grayscale inverted Diffusion Weighted image (b = 800 s/mm2) (G). H On the interim WB-MRI Apparent Diffusion Coefficient (ADC) map, the same lesions appear more hyperintense than baseline. I Coronal grayscale inverted MIP DW-MRI shows minimal residual disease
A total of 25 nodal lesions were analyzed. In this subgroup of patients, median ADCmin value at baseline was 0.440 (IQR 0.399–0.518) mm2/s, whereas at interim it was 0.970 (IQR 0.899–1.101) × 10−3 mm2/s (median of differences = 0.524 × 10⁻³ mm2/s, p = 0.0005) (Fig. 2a). Median ADCmean value at baseline was 0.634 (IQR 0.586–0.668) × 10−3 mm2/s, whereas at interim it was 1.221 (IQR 1.017–1.266) × 10−3 mm2/s (median of differences = 0.645 × 10⁻³ mm2/s, p = 0.002) (Fig. 2b). Regarding 18F-FDG-PET/CT values, median SUVmax values changed from 12.3 (IQR 9.73–13) to 2.7 (IQR 1.0–2.7) (median of differences = − 10.4, p = 0.002) (Fig. 2c), SUVmean values changed from 4.0 (IQR 3.9–4.8) to 2.1 (IQR 1.0–2.6, median of differences = − 2.2, p = 0.002) (Fig. 2d).
Fig. 2
WB-MRI and 18F-FDG-PET/CT parameter change at interim from baseline in patients with Hodgkin lymphoma. Median ADCmin value was 0.440 (IQR 0.399–0.518) mm2/s at baseline and 0.970 (IQR 0.889–1.101) × 10−3 mm2/s at interim (median of differences = 0.524 × 10⁻³ mm2/s, p = 0.0005 (A). Median ADCmean value was 0.634 (IQR 0.589–0.668) × 10−3 mm2/s at baseline and 1.221 (IQR 1.017–1.266) × 10−3 mm2/s at interim (median of differences = 0.645 × 10⁻³ mm2/s, p = 0.002 (B). Regarding 18F-FDG-PET/CT values, median SUVmax values changed from 12.29 (IQR 9.73–13.00) at baseline to 2.64 (IQR 1.02–2.65) at interim (median of differences = − 10.43, p = 0.002, (C), SUVmean from 4.02 (IQR 3.9–4.8) at baseline to 2.1 (IQR 1–2.62) at interim (median of differences =− 2.17, p = 0.002, (D)
A strong negative correlation between ADCmean with SUVmax (Spearman correlation coefficient rs = − 0.83, p < 0.0001) interval changes from baseline was found. No significant correlation was found between ADCmin and SUV (SUVmean and SUVmax) interval change. No correlation was found between SUV and ADC change rates (p > 0.05).
留言 (0)