
記住我


Plasma biomarkers significantly correlated with traditional biomarkers of Alzheimer’s disease, and showed high accuracy discriminating the biomarker status (normal vs abnormal) determined by using traditional biomarkers. The use of plasma as a gateway to traditional biomarkers using cohort-specific thresholds could save up to 49% of traditional exams.
HOW THIS STUDY MIGHT AFFECT RESEARCH, PRACTICE OR POLICYBackgroundAccording to the first diagnostic criteria of Alzheimer’s disease (AD) published in 1984, a definite diagnosis of AD was possible only postmortem, based on histopathological evidence of AD pathology.1 Since then, increased understanding of AD pathophysiology and technological advancements have favoured the development of new techniques assessing AD biomarkers, allowing to detect AD pathology not only in vivo, but also before the onset of clinical symptoms. Thus, AD biomarkers have been progressively introduced into clinical practice and their clinical use is constantly growing, consistently with the most recent diagnostic criteria that acknowledged their key pathophysiological meaning.
AD biomarkers can be grouped into three main categories: ‘A’ refers to β-amyloid, ‘T’ to tau, and ‘N’ to neurodegeneration.2 They can be assessed through different techniques such as neuroimaging (ie, MRI and positron emission tomography (PET)), cerebrospinal fluid (CSF), or plasma. Each technique features advantages and disadvantages. Specifically, neuroimaging techniques allow a direct measure of AD biomarkers and provide precious information on their topography, but their information is limited to individual biomarkers (ie, only A, T or N), they are more expensive and might involve small amounts of radiations. CSF analysis is a cheaper and more accessible technique providing information on all ATN (and other) biomarkers at the same time, yet it is an indirect measure, does not provide information on topography, and is sometimes not well accepted by patients due to its invasive nature. Plasma has the same advantages as CSF, yet its higher accessibility might make possible a large-scale screening for AD in the near future, better selection of patients who should undergo more advanced investigations (eg, neuroimaging), and monitoring of disease progression with more regular repeated sampling.
Some neuroimaging techniques (ie, structural MRI and fluorodeoxyglucose (FDG)-PET) and CSF measures have been used for clinical purposes for a long time, and their clinical validity is supported by consistent evidence.3 PET tracers allowing to assess amyloid and tau deposition have been recently developed, and preliminary evidence suggests their clinical validity and diagnostic impact.4 Therefore, neuroimaging and CSF measures can be considered as traditional techniques/exams assessing AD biomarkers. Differently, plasma biomarkers have become available even more recently,5 and evidence regarding their clinical validity is not yet available. However, given the advantages of plasma over neuroimaging and CSF biomarkers, evidence on their clinical validity and their performance to screen memory clinic patients is strongly needed.
The aims of the present study were: (1) to confirm the correlations between plasma and homologous traditional AD biomarkers, (2) to assess the diagnostic accuracy of plasma biomarkers as compared with traditional biomarkers, and (3) to estimate the proportion of traditional exams potentially saved thanks to the use of plasma biomarkers.
MethodsParticipantsParticipants were patients previously enrolled at the Memory Centre of the Geneva University Hospitals for whom plasma biomarkers and at least one homologous traditional biomarker collected within 12 months were available. Patients came to the centre because of cognitive complaints and underwent diagnostic workup including clinical and neuropsychological assessments, and biomarker investigations when clinically relevant or as part of research projects.6 Patients were classified by cognitive stage (cognitively unimpaired (CU), mild cognitive impairment (MCI), dementia). MCI7 and dementia8 stages were defined based on their respective clinical diagnostic criteria.
Biomarker classificationNeuroimaging and CSF measures were considered as traditional biomarkers due to the long-standing clinical experience with them.9 Neuroimaging, CSF, and plasma biomarkers were grouped into amyloid, tau, and neurodegeneration categories as follows (table 1).
Table 1Biomarker classification and comparisons performed in the present study
Amyloid: amyloid-PET, CSF Aβ42, plasma Aβ42/Aβ40, plasma p-tau181/Aβ42, and plasma p-tau231/Aβ42.
Tau: tau-PET, CSF p-tau181, plasma p-tau181, plasma p-tau231, plasma p-tau181/Aβ42, and plasma p-tau231/Aβ42.
Neurodegeneration: structural MRI, FDG-PET, and plasma neurofilament light (NfL). Note that we compared biomarkers measuring different pathophysiological processes associated with neurodegeneration, namely: atrophy, hypometabolism and axonal injury and astrogliosis, respectively.
We assessed plasma Aβ42/Aβ40 as a measure of amyloid consistently with previous studies reporting that this measure identifies amyloid deposition better than Aβ42 alone.10 Moreover, we considered plasma p-tau/Aβ42 as a measure of both amyloid and tau as previous studies suggested that this measure is predictive of both amyloid10 11 and tau12 deposition.
Biomarkers collection, analyses, and assessmentPlasma biomarkersPlasma samples were collected in EDTA tubes at the Memory Centre of the Geneva University Hospitals, homogenously kept 2 hours at room temperature before centrifugation (1700 g 15 min), aliquoted as 500 μL in 1.2 mL polypropylene tubes and stored at −80°C in the local biobank until the time of shipment. Aliquots were shipped under protected conditions and analysed at the Clinical Neurochemistry Laboratory, University of Gothenburg, Sweden. Plasma Aβ42, Aβ40, and NfL concentrations were measured using commercially available Single molecule array (Simoa)13 assays on an HD-X Analyser according to instructions from the kit manufacturer (Quanterix, Billerica, MA), while p-tau18114 and p-tau23115 concentrations were measured using in-house Simoa methods developed at the Clinical Neurochemistry Laboratory, University of Gothenburg, Sweden.
Biomarkers concentrations were measured by board-certified laboratory technicians who were blinded to clinical data in two rounds of experiments, using two batches of reagents: values extracted from the second and more comprehensive round were used to assess the main study outcomes, while the first round consisted in the extraction of p-tau181 (n=82) and NfL (n=87) values of a subset of participants and was used to assess the test–retest reliability of these plasma measures. Intra-assay coefficients of variation were below 10%.
Neuroimaging biomarkersIn the present study, we used both continuous and dichotomous (normal vs abnormal) measures of AD biomarkers assessed using traditional techniques. Detailed information on acquisition protocols is available in a previous publication.6
Structural 3T MRI images were acquired. The average of left and right hippocampal volumes (extracted using automated segmentation from FreeSurfer (V.7.0) recon-all tool),16 adjusted by total intracranial volume, was used as a continuous variable. As a clinically meaningful measure, we used the average medial temporal lobe atrophy scale (MTA) visual score of the left and right hemispheres, and MTA positivity was defined using the age-specific cutoffs that best discriminate between patients with AD dementia and controls (ie, ≥1 for patients aged <65 and ≥1.5 for patients aged ≥65).17
Amyloid-PET images were acquired using 18F-florbetapir or 18F-flutemetamol tracers, and tau-PET images were acquired using 18F-Flortaucipir, using standard imaging protocol and reconstructions, previously described in detail18 and briefly summarized here. 18F-florbetapir images were acquired 50 min after injection of 200 MBq during 15 min; 18F-flutemetamol images were acquired 90 min after injection of 150 MBq, during 20 min; and 18F-flortaucipir images were acquired 75 min after injection of 180 MBq, during 30 min.18 All acquisitions were performed on Siemens Biograph and Biograph Vision scanners, and reconstructed using a 3D OSEM iterative reconstruction, corrected for randoms, dead time, normalisation, scatter, attenuation, and sensitivity.18 PET images were processed using an in-house pipeline based on SPM12 (Wellcome Department of Cognitive Neurology, London, UK).18 FDG-PET images were acquired using 18F-FDG, following the European Association of Nuclear Medicine guidelines.19 PET images were processed using an in-house code as described in a previous publication.18
As in our cohort we used two different amyloid-PET tracers, the standardized uptake value ratio (SUVr) was converted to the Centiloid (CL) scale, according to the Global Alzheimer’s Association Interactive Network guidelines,20 and used as a continuous measure. Indeed, as the two tracers have different but strongly correlated uptakes,21 their standardisation in a common scale has been proposed to harmonise the results obtained across tracers.22 Amyloid-PET positivity was visually assessed by an expert in nuclear medicine physician (VG, > 15 years of experience in the field) using visual assessment and standard operating procedures approved from the European Medicines Agency.23 24
Global tau-PET SUVr was computed as an average across parahippocampal gyrus, amygdala, mid-occipital cortex, and inferior temporal cortex,25 and used a continuous measure. Tau distribution was determined in each patient by the same expert in nuclear medicine (VG), who visually analysed images in agreement with recently published recommendations,26 describing regions of increased 18F-flortaucipir uptake in the regions corresponding to the pathologically defined Braak stages: medial temporal regions for Braak stages I–III, later temporal regions for Braak stage IV, parietal and frontal lobes for Braak stage V, and sensorimotor areas and visual primary cortex for Braak stage VI (see a previous paper4 for a more detailed description). To define tau-PET positivity, visually scored Braak stages 0–III were considered as tau negative, and Braak stages IV–VI as tau positive, in accordance with current knowledge on cognitive impact of tau pathology27 and on detectability of tau pathology with 18F-flortaucipir,28 and consistently with a recent study.29
Global FDG-PET SUVr was extracted from a composite region of five metaROIs: left and right angular gyrus, left and right temporal cortices, and posterior cingulate.30 FDG-PET positivity was defined based on a previously published cut-off (ie, SUVr<1.21).31
CSF biomarkersCSF samples were collected at the Memory Centre of the Geneva University Hospitals. More information on CSF collection protocol is reported in a previous paper.6 CSF Aβ42 (product number 81576) and p-tau181 (product number 81574) were analysed using INNOTEST32 assays following the manufacturer’s instructions (Fujirebio, Ghent, Belgium) at the Chemistry Laboratory of the Geneva University Hospitals. CSF biomarkers positivity was determined using cohort-specific thresholds (CSF Aβ42 < 880.5 pg/mL and CSF p-tau181>80.5 pg/mL).
Test–retest reliabilityFor a subset of participants, plasma p-tau181 and plasma NfL concentrations from the same-day plasma withdrawal were assessed in two different batches of laboratory analyses (see section 'Plasma biomarkers'). Values from the first batch were used to assess the test–retest reliability of plasma p-tau181 (n=82) and plasma NfL (n=87).
Statistical analysisThe associations between plasma and traditional biomarkers and the test-retest reliability of plasma biomarkers were assessed by using Pearson’s correlation (r).
The diagnostic accuracy of plasma biomarkers over amyloid-PET and tau-PET was assessed through the area under the curve (AUC) of the receiver operating characteristics (ROC) using the ‘pROC’ package in R.33
To estimate the proportion of traditional exams that could be saved by using plasma biomarkers in clinical practice, we derived from the ROC curves cut-offs with 95% sensitivity or 95% specificity, and then computed the number of scans below and above these cut-offs (ie, true negative + false negative using the 95%-sensitivity cut-off, and true positive + false positive using the 95%-specificity cut-off). For each proportion of saved exams, we computed the ‘error rate’, that is, the proportion of exams incorrectly saved, consisting of the sum of the false negatives resulting from the 95%-sensitivity cut-off and the false positives resulting from the 95%-specificity cut-off out of the total of the saved exams.
Finally, test–retest reliability was assessed by using Pearson’s correlation (r) and fold change (using the following formula: (second batch values – first batch values) / first batch values).
All statistical analyses were performed with R, version 4.1.2 (R Foundation for statistical computing, https://www.r-project.org/).
ResultsParticipantsPlasma biomarkers and at least one traditional biomarker were available for 200 patients (82 CU, 99 MCI, 19 dementia). Overall, the level of cognitive impairment and positivity to traditional biomarkers were directly proportional to the cognitive stage severity (table 2). The average time (median±IQR) between the collection of plasma and traditional biomarkers was 14±142 days for amyloid-PET, 14±127 days for tau-PET, 9±69 days for CSF, 42±124 for MRI, and 48±139 for FDG-PET. Online supplemental table S1 illustrates the demographic and clinical features of each subsample of participants with plasma biomarkers and at least one traditional biomarker.
Table 2Demographic, clinical, cognitive and biomarker features of participants with biomarkers assessed through plasma and at least one traditional exam (ie, PET, CSF, MRI or FDG-PET)
Correlation among biomarkersAmong plasma A biomarkers, plasma p-tau231/Aβ42 showed the highest correlation with amyloid-PET CL (r=0.50, p<0.001), and plasma Aβ42/Aβ40 with CSF Aβ42 (r=0.42, p=0.002) (online supplemental figure S1). Among plasma T biomarkers, plasma p-tau231 showed the highest correlation with tau-PET (r=0.37, p<0.001), and plasma p-tau181 showed the highest correlation with CSF p-tau181 (p=0.43, p=0.002) (online supplemental figure S2). Finally, plasma NfL significantly correlated with hippocampal volume (p=−0.23, p=0.001) (online supplemental figure S3).
 Figure 1
 Performance of 95%-sensitivity and 95%-specificity plasma biomarkers cutoffs over traditional (A) amyloid (amyloid-PET and CSF Aβ42), (B) tau (tau-PET and CSF p-tau181), and (C) neurodegeneration (MRI MTA, FDG-PET) biomarkers. Amyloid-PET positivity: visual reading. CSF Aβ42 positivity: <880.5 pg/mL. Tau-PET positivity: Braak stages IV-VI. CSF p-tau181 positivity: >80.5 pg/mL. MTA positivity: age-based cut-off. FDG-PET positivity: SUVr <1.21. One plasma p-tau181/Aβ42 value (24.0) and two plasma NfL values (188.1 pg/mL and 260.1 pg/mL) were not displayed to improve data visualisation (but were included in the analyses). CSF, cerebrospinal fluid; CU, cognitively unimpaired; FDG, fluorodeoxyglucose; MCI, mild cognitive impairment; NfL, neurofilament light; PET, positron emission tomography; SUVr, standardised uptake value ratio.
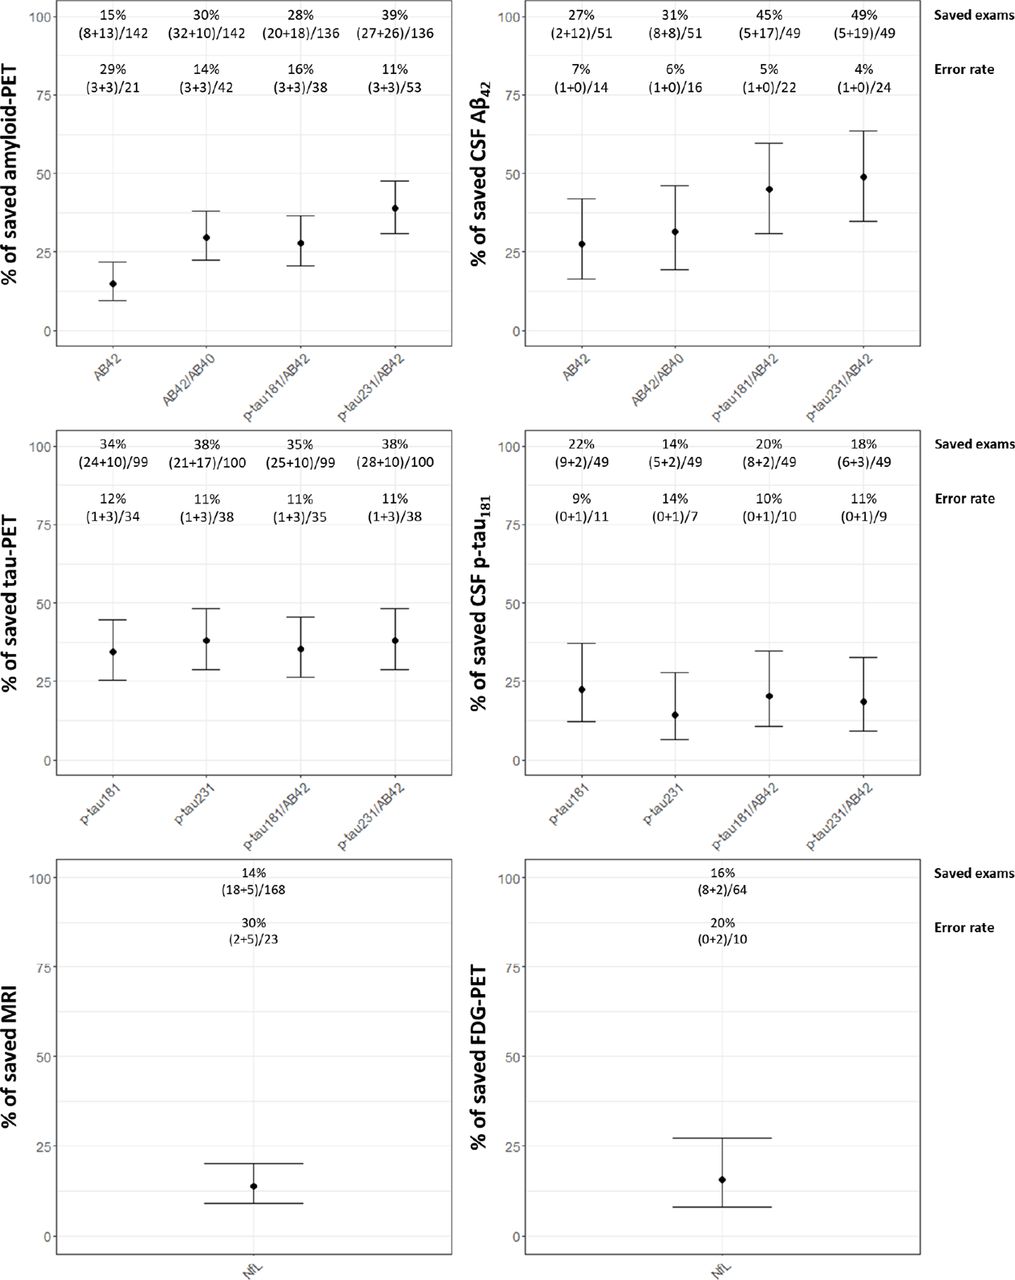 Figure 2
 Proportion of traditional exams that could be saved by using plasma biomarkers with 95%-sensitivity or 95%-specificity cut-offs. Values indicate the proportion of saved traditional exams and the ‘error rate’. The proportion of saved traditional exams was defined as the number of patients identified with the use of plasma biomarkers with 95%-sensitivity and 95%-specificity cut-offs (ie, true negatives+false negatives resulting from the 95%-sensitivity cut-off, and true positives+false positives resulting from the 95%-specificity cut-off) out of the total number of participants with plasma and traditional biomarkers. The ‘error rate’ is defined as the number of traditional exams incorrectly saved (ie, false negatives resulting from the 95%-sensitivity cut-off+false positive resulting from the 95%-specificity cut-off) out of the total number of the saved traditional exams. CSF, cerebrospinal fluid; FDG, fluorodeoxyglucose; NfL, neurofilament light; PET, positron emission tomography.
Diagnostic accuracy of plasma biomarkersWhen testing the accuracy of plasma A biomarkers (ie, plasma Aβ42, plasma Aβ42/Aβ40, plasma p-tau181/Aβ42 and plasma p-tau231/Aβ42) in predicting A status defined using traditional A biomarkers (ie, amyloid-PET or CSF Aβ42), AUC values ranged from 0.66 (plasma Aβ42) to 0.83 (plasma p-tau231/Aβ42) when using amyloid-PET as the gold standard, and from 0.69 (plasma Aβ42) to 0.87 (plasma p-tau231/Aβ42) when using CSF Aβ42 as the gold standard (online supplemental figure S4).
When testing the accuracy of plasma T biomarkers (ie, plasma p-tau181, plasma p-tau231, plasma p-tau181/Aβ42, and plasma p-tau231/Aβ42) in predicting T status defined using traditional T biomarkers (ie, tau-PET or CSF p-tau181), AUC values ranged from 0.78 (plasma p-tau181) to 0.81 (plasma p-tau231/Aβ42) when using tau-PET as the gold standard. and from 0.75 (plasma p-tau231) to 0.82 (p-tau181/Aβ42) when using CSF p-tau181 as the gold standard (online supplemental figure S4).
When testing the accuracy of plasma N biomarker (ie, plasma NfL) in predicting N status defined using traditional N biomarkers (ie, MTA or FDG-PET), AUC values were 0.58 when using MTA score as the gold standard, and 0.63 when using FDG-PET as the gold standards (online supplemental figure S4).
Traditional exams saved using plasma biomarkersFigure 1 illustrates the performance of 95%-sensitivity and 95%-specificity plasma biomarkers cutoffs over traditional homologous biomarkers. The estimated proportion of saved amyloid-PET scans ranged from 15% using plasma Aβ42 (error rate: 29%) to 39% using plasma p-tau231/Aβ42 (error rate: 11%) (figure 2). The estimated proportion of saved CSF Aβ42 ranged from 27% using plasma Aβ42 (error rate: 7%) to 49% using p-tau231/Aβ42 (error rate: 4%) (figure 2). The estimated proportion of saved tau-PET scans ranged from 34% using plasma p-tau181 (error rate: 12%) to 38% using plasma p-tau231 or p-tau231/Aβ42 (error rate: 11%) (figure 2). The estimated proportion of saved CSF p-tau181 ranged from 14% using p-tau231 (error rate: 14%) to 22% using p-tau181 (error rate: 9%) (figure 2). The estimated proportion of saved MRI scans was 14% using plasma NfL (error rate: 30%) (figure 2). The estimated proportion of saved FDG-PET scans was 16% using plasma NfL (error rate: 20%) (figure 2).
Test–retest reliabilityThe test–retest reliability of plasma biomarkers assessed from the same sample but in different batches was good both for plasma p-tau181 (r=0.82, p<0.001; fold change: 0.8±0.7) and for plasma NfL (r=0.97, p<0.001; fold change: 0.9±0.2) (online supplemental figure S5).
DiscussionIn the present work, we observed that amyloid and tau plasma biomarkers significantly correlated with traditional biomarkers (ie, amyloid-PET, tau-PET, CSF Aβ42 and CSF p-tau181), and that correlations between plasma NfL and traditional biomarkers (MRI and FDG-PET) were weaker. Moreover, plasma biomarkers reached an excellent diagnostic accuracy in detecting positivity to traditional amyloid and tau biomarkers (with plasma Aβ42/p-tau ratios showing the best performance), while the diagnostic accuracy in detecting positivity to neurodegeneration biomarkers was overall lower and not acceptable. Finally, we estimated that up to 39% of amyloid-PET, 49% of CSF Aβ42, 38% of tau-PET, 22% of CSF p-tau181, 14% of MRI, and 16% of FDG-PET could be saved with a relatively low error rate using plasma biomarkers.
Our results showed that, overall, plasma p-tau (both alone and in combination with Aβ42) showed the best performance both in terms of correlation with traditional biomarkers and of diagnostic accuracy over traditional biomarkers, while Aβ42 alone and NfL showed weaker associations with and poorer diagnostic accuracy over amyloid and neurodegeneration traditional biomarkers, respectively. Moreover, plasma biomarkers proved to be useful tools to detect the amyloid and tau status of memory clinic patients, while their potential to detect the neurodegeneration status seemed inadequate. This might be due to the non-specific and more heterogeneous nature of neurodegeneration and its imaging markers, while amyloid and tau deposits are more closely related to the presence of specific neurodegenerative diseases such as AD which are associated with plasma biomarkers. Finally, the implementation of plasma biomarkers as screening tools can remarkably reduce the number of traditional exams, as previously shown by Verberk and colleagues in a population of individuals with subjective cognitive decline (−51% of CSF and −54% of amyloid-PET using plasma Aβ42/Aβ40).34
The screening strategy we suggest here could be implemented in clinical practice by performing plasma assessment in patients for whom an investigation of amyloid, tau and neurodegeneration statuses is considered appropriate. Patients with values below or above the thresholds for a sensitivity and specificity of 95% could be considered classifiable with a relatively high confidence, while others should be addressed for further investigation using traditional biomarkers in an integrated diagnostic approach.35
Before its clinical implementation, however, three main achievements should be fulfilled. (1) The test-retest reliability of the test should be evaluated systematically for all biomarkers and combinations thereof.36 In our sample, we could only evaluate test–retest stability of two biomarkers (p-tau181 and NfL), considering only analytical and postanalytical variables. Indeed, the test–retest variability shown here is an underestimation, as we tested twice samples that were collected at the same blood withdrawal, and thus our estimates did not take into account many other variables that can affect plasma biomarkers, such as concomitant medications and physiological and pathological conditions.37 (2) An optimisation of operating procedures and assay reproducibility should be achieved, with a detailed protocol for the handling of plasma AD biomarkers and a cross-validation across laboratories, in analogy with what has been already achieved for CSF markers.38 39 This step would be a prerequisite to derive cohort-independent thresholds which would be necessary for a widespread clinical implementation. It is to be expected that different thresholds will be needed for different goals. Indeed, cut-offs might largely vary depending on the purpose (screening vs population enrichment), on the strategy adopted (data-driven from healthy controls or to maximise difference between two populations), and on individual characteristics of the included sample, for example, with different recommendations for different age ranges.40 (3) Specific strategies need to be developed to minimise the impact of errors. As mentioned, even selecting conservative thresholds to achieve a sensitivity and specificity of 95%, respectively, the error rates measured here ranged from 4% to 30%. These error rates are, by definition, underestimated as they do not take into account the impact of the observed test–retest variability. It will also be important to develop specific strategies to independently verify the results, for example, testing if the concordance of the clinical hypothesis and the test result might help identifying patients erroneously classified, or estimating the consequences of false negative and false positive results on the basis of disease severity and patient profile.
LimitationsThe main limitation of the present study is its retrospective nature. Indeed, the thresholds used here to classify patients were derived from the same cohort on which they were applied. As such, the cut-offs derived in the present study are cohort-specific and should not be used to classify patients from different memory clinics or with different clinical features. Nevertheless, this study should be considered as a demonstration that it is possible to implement plasma biomarkers in clinical practice, and that the use of these might result in a more efficient diagnostic workup. Prospective studies are needed to replicate these results and possibly to provide reliable cut-offs that might be used by other centres or in clinical settings different than specialised memory clinics.
Furthermore, our sample mostly included patients with MCI, as it commonly happens in memory clinic populations,41 preventing us from drawing conclusions on the individual disease stages. For this reason, we chose not to focus on the individual disease stages, but to consider all patients (irrespective of the clinical stages) as a unique memory clinic sample. The over-representation of MCI patients allows us to generalise our results to a wider memory clinic population undergoing biomarker testing (as MCI patients are the ones who might benefit the most from biomarker testing3).
Moreover, in the present study, we did not include the mass spectrometry version of plasma biomarkers.
Finally, it is important to underline that the procedures described here include some specificities that might impact their performance. Factors that might lead to an overestimation of the diagnostic accuracy are the fact that the assessment of all experimental samples was performed in the same reference laboratory and based on only one or two analytical batches. One main factor that could instead negatively influence the diagnostic performance is the fact that frozen samples were stored for a variable duration. Nevertheless, the plasma biomarkers examined here all seem to be stable at different storage temperatures and not sensitive to effects of freeze-thawing.42
ConclusionsPlasma biomarkers were overall concordant with traditional biomarkers, reached an excellent diagnostic accuracy compared with traditional amyloid and tau biomarkers (and a lower accuracy when compared with traditional neurodegeneration biomarkers), and their implementation might save up to 49% of traditional exams with a relatively low error rate.
Data availability statementData are available on reasonable request.
Ethics statementsPatient consent for publicationEthics approvalThis study involves human participants and was approved by Geneva Ethics Committee (IDs of the ethics approvals: PB_2016-01346 and 2020_00403). Participants gave informed consent to participate in the study before taking part.
AcknowledgmentsThe Memory Centre is funded by the following private donors under the supervision of the Private Foundation of Geneva University Hospitals: A.P.R.A. - Association Suisse pour la Recherche sur la Maladie d’Alzheimer, Genève; Fondation Segré, Genève; Race Against Dementia Foundation, London, UK; Fondation Child Care, Genève; Fondation Edmond J. Safra, Genève; Fondation Minkoff, Genève; Fondazione Agusta, Lugano; McCall Macbain Foundation, Canada; Nicole et René Keller, Genève; Fondation AETAS, Genève. The Clinical Research Center, at Geneva University Hospitals and Faculty of Medicine provides valuable support for regulatory submissions and data management, and the Sérothèque Centrale/Biothèque SML at Geneva University Hospitals for biofluid processing and storage. Competitive research projects have been funded by: H2020, Innovative Medicines Initiative (IMI), IMI2, Swiss National Science Foundation, VELUX Foundation.
留言 (0)