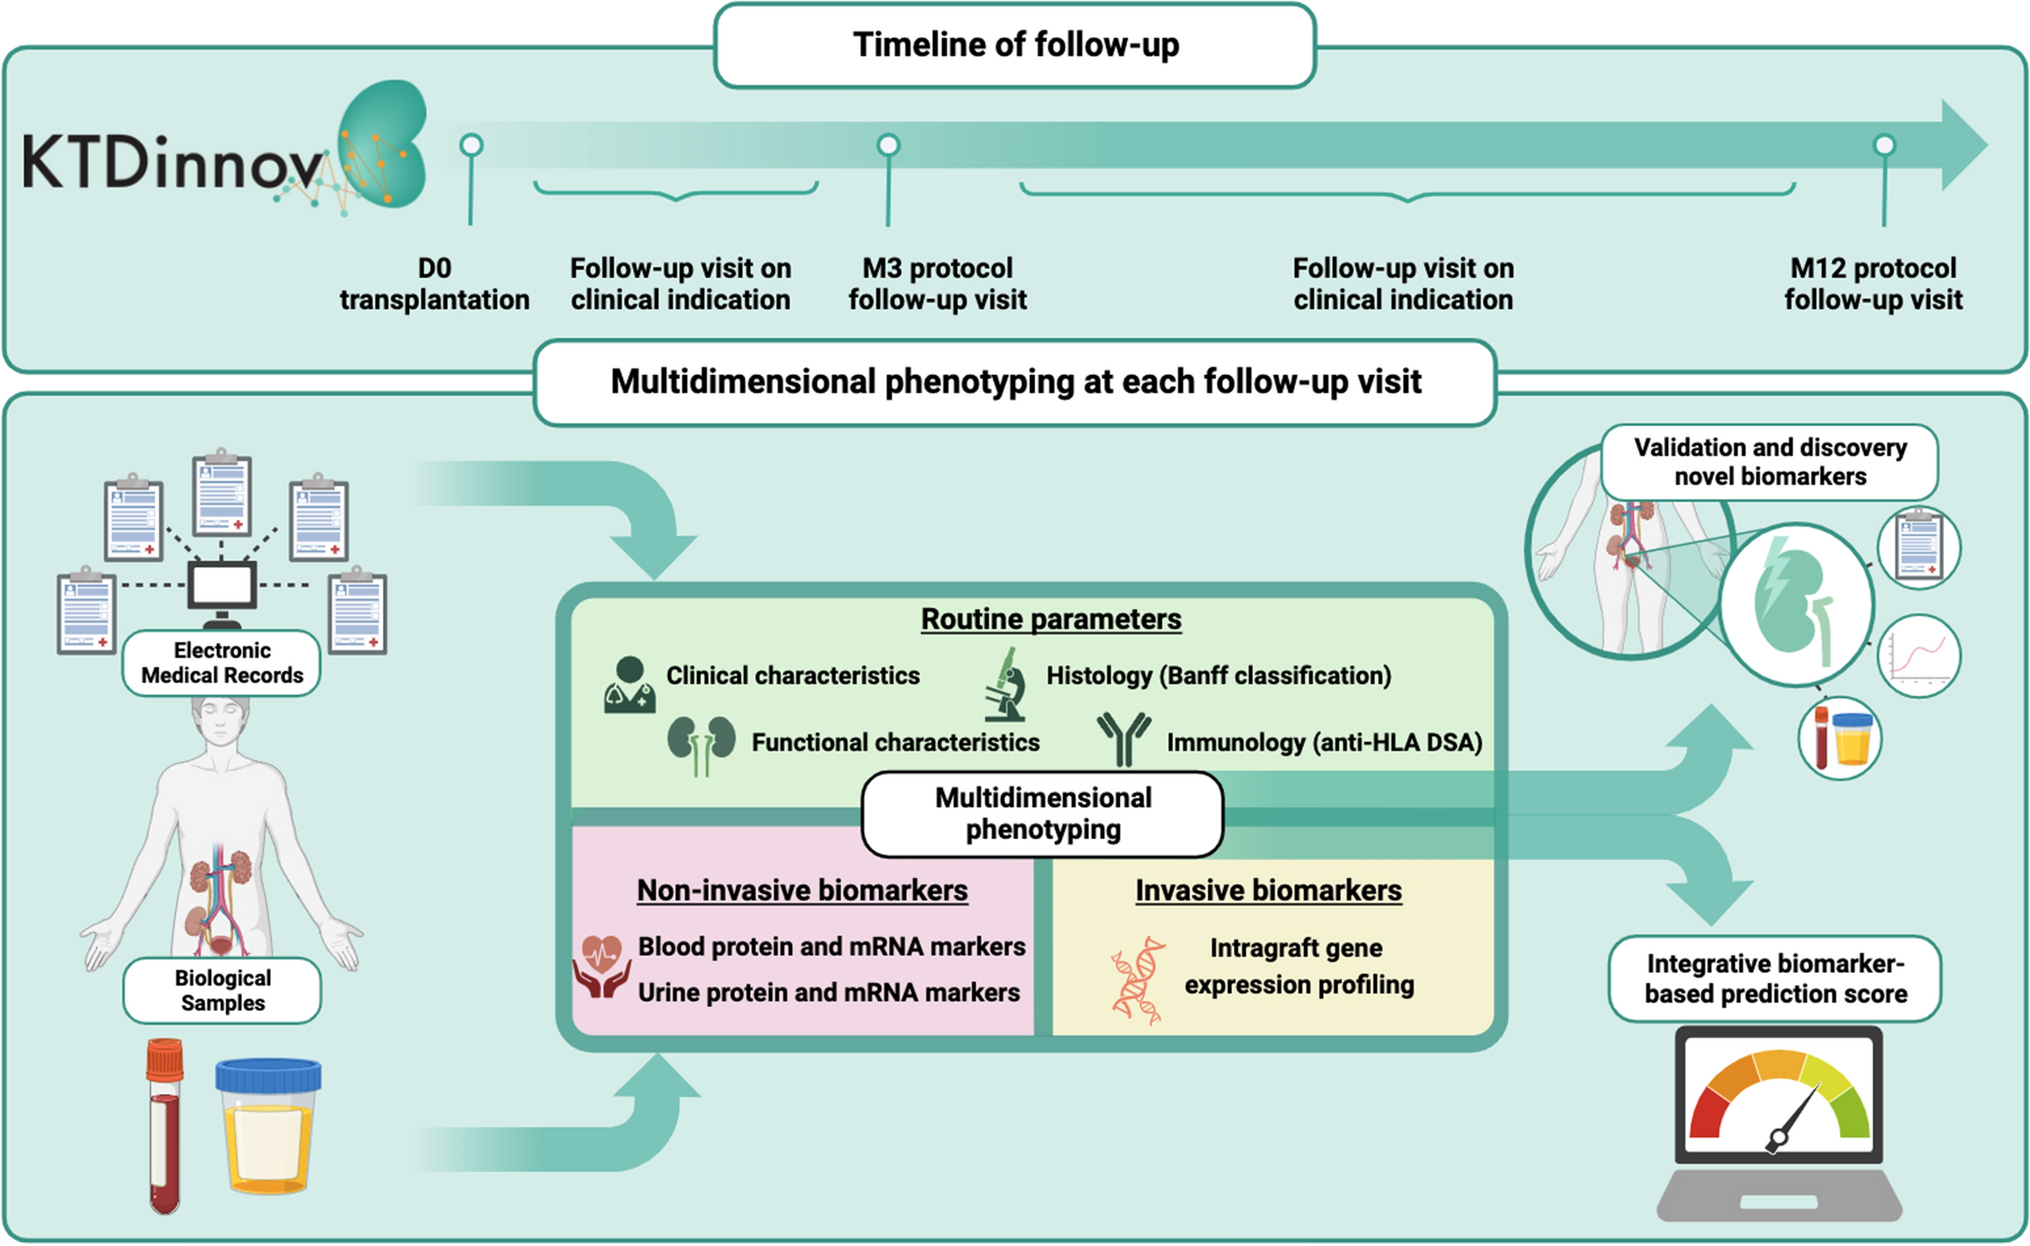
Study design and cancer follow-up
The NLCS started in September 1986 and the female part included 62,573 women aged 55–69 years [30]. At baseline, participants completed a mailed, self-administered questionnaire on cancer risk factors. The NLCS study was approved by institutional review boards from Maastricht University and the Netherlands Organization for Applied Scientific Research. All cohort members consented to participation by completing the questionnaire. For efficiency, we applied the nested case-cohort method [31], requiring only data-entry of questionnaires (which could not be scanned) of cases and a random subcohort. Following this method [30], cases were enumerated from the entire NLCS-cohort of 62,573 (numerator information of incidence rates), whereas the accumulated person-years at risk in the cohort were estimated using a subcohort of 2589 women (denominator information). The case-cohort method implies that the persontime at risk is estimated through a sample of the total cohort, instead of actively following the total cohort. Data entry of questionnaires is only needed for cases and subcohort members, instead of the total cohort [30, 31]. Immediately after the NLCS-baseline measurement, the subcohort (2589 women) was randomly sampled from the cohort, and actively followed up since 1986 for vital status and migration. The follow-up of the subcohort was 100% complete at 20.3 years of follow-up.
Follow-up for cancer incidence in the entire cohort was established by annual record linkage with the Netherlands Cancer Registry and PALGA, the nationwide Dutch Pathology Registry [32]. Completeness of follow-up through record linkage with cancer registries and PALGA was estimated to be greater than 95% [33]. After 20.3 years of follow-up (September 17, 1986 until January 1, 2007), a total of 3354 incident breast cancer cases were detected among women. Cases and subcohort members were excluded if they reported a history of cancer (except skin cancer) at baseline. Furthermore, participants with incomplete or inconsistent dietary data [34], or missing values for the other considered lifestyle factors and predefined confounders were excluded from the analysis. Figure S1 (Supplementary data) shows the selection and exclusion steps that resulted in the number of postmenopausal breast cancer cases (including subtypes defined by hormone receptor status) and female subcohort members that were included in the analysis. There were 1665 subcohort members and 2321 breast cancer cases available for analysis.
Exposure assessment
The 11-page baseline questionnaire measured dietary intake (including alcohol), detailed smoking habits, anthropometry, physical activity and other risk factors related to cancer [30]. Habitual consumption of food and beverages during the year preceding baseline was assessed using a 150-item semi-quantitative food-frequency questionnaire. The food-frequency questionnaire has been validated and tested for reproducibility [34, 35]. Nutrient intakes were calculated using the computerized Dutch food composition table [36]. Consumption of alcoholic beverages was addressed by questions on beer, red wine, white wine, sherry and other fortified wines, liqueur types containing on average 16% ethanol, and (Dutch) gin, brandy, and whiskey. Respondents who consumed alcoholic beverages less than once a month were considered non-users. Tobacco smoking was addressed through questions on smoking status (never, ex, or current smoker) and inhalation for cigarette, cigar, and pipe smokers. Additional questions were asked on the ages at first and last exposure to smoking, smoking frequency, and duration for cigarette, cigar, and pipe smokers. Information on height (in cm) and weight at baseline (in kg) was also collected using the self-administered questionnaire, from which BMI (weight/height2) was calculated in kg/m2. Non-occupational physical activity was calculated by adding the minutes spent per day on cycling or walking, shopping, walking the dog, gardening, and sports or exercise as reported previously [27].
Mediterranean diet score
Adherence to the MD was assessed using the alternate Mediterranean Diet Score (aMED) [37, 38], which is an adapted version of the traditional Mediterranean Diet Score created by Trichopoulou et al. [39] [40]. The aMED contains 9 dietary components that are typical of the Mediterranean diet. To control for energy intake, the intake of each component was first adjusted to a daily intake of 2000 kcal [37, 38, 40]. For each of the presumed beneficial food items (vegetables (without potatoes), legumes, fruits, nuts, whole grains, fish, and the ratio of monounsaturated to saturated fatty acid intake (MUFA:SFA)), one point was given when the intake was at least the sex-specific median intake, and zero otherwise. For red and processed meat, 1 point was given (and 0 otherwise) when the intake was below the sex-specific median intake. In the full aMED, 1 additional point is normally given when alcohol intake is between 5–25 g/day, and 0 otherwise [38]. However, since alcohol is a risk factor for breast cancer, alcohol was excluded from the aMED score. The reduced 9-point sum score (aMEDr) ranged from zero to eight points (minimal to maximal conformity).
Healthy lifestyle score
As in a previous analysis of lifestyle factors and risk of esophageal and gastric cancer subtypes [23], a combined healthy lifestyle score was constructed. In this healthy lifestyle score (HLS), scores for five modifiable lifestyle factors (BMI, smoking, physical activity, Mediterranean diet adherence, and alcohol intake) were combined, while each component factor was scored on three levels, representing full (score 1), partial (0.5) and noncompliance (0) with the public health recommendation for that component. Table 1 shows the cutoffs and scores for each of these five factors. The cutoffs for physical activity and alcohol were in line with recommendations from the Health Council of the Netherlands [41, 42]. The combined sum score ranged from zero to five points (minimal to maximal healthy lifestyle).
Table 1 Definition of the combined healthy lifestyle score (HLS), representing full, partial and noncompliance with public health recommendationsTable 2 Baseline characteristics (means, or percent) by combined healthy lifestyle score (HLS) in female subcohort members with complete dietary and covariable data, Netherlands Cohort StudyTable 3 Hazard Ratio of breast cancer (subtypes), according to healthy lifestyle score in multivariable-adjusteda analyses, Netherlands Cohort StudyStatistical analysis
The distribution of the subcohort members by the combined healthy lifestyle score and various characteristics was examined by cross-tabulations and summary statistics. Hazard ratios (HRs) and 95% confidence intervals (95% CIs) for associations of the combined healthy lifestyle score with incidence of breast cancer subtypes were estimated using Cox proportional hazards models with follow-up duration as time variable. Person-years at risk for subcohort members were calculated from baseline until diagnosis of breast cancer, death, emigration, loss to follow-up or end of follow-up, whichever came first. Standard errors were estimated using the Huber-White sandwich estimator to account for the increased variance because of subcohort sampling [43]. It was verified that the proportional hazards assumption was not violated using scaled Schoenfeld residuals [44] and -ln(-ln) survival plots.
The associations between the HLS and risk of breast cancer subtypes were investigated on a categorical and continuous scale in survival analyses. The HLS score was categorized based on the distribution in the subcohort into 6 categories: 0–1.5, 2, 2.5, 3, 3.5, and 4–5 points [23]. Participants with a HLS of 2.5 points formed the reference group in categorical analyses, because categories 0–1.5 and 2 were too small. Tests for trends were assessed by assigning median values of the lifestyle score in the subcohort to the exposure categories and fitting these as continuous terms in the regression models. In the continuous analyses, HRs were estimated per increment of 1 point.
In multivariable-adjusted survival analyses, the associations were adjusted for the following predefined (literature-based) confounders, which were included in the final multivariable-adjusted model independent of their effect on the estimated HRs: age at baseline (55–59, 60–64, 65–69 years), smoking frequency (number of cigarettes per day; continuous, centered), and duration (number of years; continuous, centered), body height (continuous, cm), highest level of education (primary school or lower vocational (low), secondary school or medium vocational (medium), and higher vocational or university (high)), total energy intake (kcal/day; continuous), family history of breast cancer in mother or sisters (no, yes), history of benign breast disease (no, yes), age at menarche (≤ 12, 13–14, 15–16, ≥ 17 years), parity (nulliparous, 1–2, ≥ 3 children), age at first birth (< 25, ≥ 25 years), age at menopause (< 45, 45–49, 50–54, ≥ 55 years), oral contraceptive use (never, ever), postmenopausal hormone replacement therapy (never, ever).
For the analyses regarding the healthy lifestyle score, the association between each of the component lifestyle factors and cancer risk was also evaluated in Cox regression analyses, while controlling for age, education, energy intake, family history of breast cancer, the abovementioned reproductive/ hormonal variables, and additionally for the other lifestyle components.
Besides overall postmenopausal breast cancer, we conducted these analyses for subtypes defined by hormone receptor status: ER + , ER-, PR + , PR-, ER + PR + , ER-PR-, and ER + PR-. The number of ER-PR + cases was too small for separate analyses. Differences in associations with the healthy lifestyle score between breast cancer subtypes were tested using a heterogeneity test [45], in which the standard error for the observed difference in rate ratios was estimated using a bootstrapping method developed for the case-cohort design [46].
To further investigate the dose–response relations between the healthy lifestyle score and risk of breast cancer subtypes, restricted cubic splines with three knots were used to graphically present the dose–response curves without making a priori assumptions about their shapes. Wald tests were performed to evaluate the linearity of these relationships.
In addition to the main analyses of the healthy lifestyle score and risk of cancer subtypes, analyses were also stratified by age, level of education, family history of breast cancer, history of benign breast disease, body height, oral contraceptive use and hormone replacement therapy. Interactions with these factors were tested using Wald tests and cross-product terms. Because of low cancer case numbers, these analyses were conducted using continuous lifestyle scores. In sensitivity analyses, analyses were repeated after excluding cancers (and person-years) occurring in the first two years of follow-up. In addition, a sensitivity analysis was conducted in which alcohol intake was categorized as 0, > 0–< 25, 25 + g/day (instead of 0–10, > 10–< 25, 25 +), to use nondrinkers as separate category.
Population attributable fractions (PAFs) were calculated [47] to estimate the potentially avoidable proportion of cancer if all participants would shift towards the healthiest lifestyle category. The STATA-command “punafcc” was used to calculate the population attributable fractions and 95% Cis [48]. Analyses were performed using Stata version 14; presented P-values are two-sided, with p < 0.05 considered as statistically significant.


留言 (0)