
記住我

Bile, which has had a medical lineage dating back to ancient civilizations, is an obligatory biofluid packaged with several organic and inorganic constituents [1–4]. In all vertebrates, bile salts are the most prolific organic solutes found in bile, perhaps due to their executive, physiologic role of enterohepatic fat absorption. Host hepatocytes synthesize primary bile salts by catabolizing cholesterol into bile acids and conjugating them with an amino acid side chain for the final amphipathic bile salt product. Upon passing through the hepatobiliary tract and small intestine, bile salts can be enzymatically transformed into secondary bile acids by gut microbiota. Despite the efficient enterohepatic recycling of bile acids being a well established segment of the gut-liver axis for many decades, the recognition of bile, and thus bile acids, as an important factor impacting gut and liver health is a more recent acknowledgment [5–9].
Recent works by us and others show that the gut-liver axis is a major and previously underrecognized factor governing cardiovascular health [10–15]. Specifically, blood pressure homeostasis, which is one of the cardinal signs of health, is regulated not only by gut microbiota-derived metabolites such as short chain fatty acids, but also by host metabolites originating from the liver such as the ketone body β-hydroxybutyrate [10,16–20]. These studies represent only a small fraction of metabolites traversing the gut-liver axis, signifying a severely limited knowledge gap to the putative effects of these host and gut microbiota co-metabolites on blood pressure regulation. As such, we tested the hypothesis that derangements in bile acid composition occur and adversely impact blood pressure regulation to promote hypertension.
The rationale for focusing on bile acid conjugation in our study is because it is a key, terminal step in bile acid metabolism and the only one requiring both the host and microbiota. There are two main types of conjugation – taurine conjugation and glycine conjugation. In humans the prominent type of conjugation is glycine conjugation, whereas in rodent models the prominent type of conjugation is taurine conjugation [21]. Therefore, associations for glycine and taurine conjugation in humans and rats were assessed first, followed by assessments of taurine and taurocholic acid as nutraceutical antihypertensive metabolites.
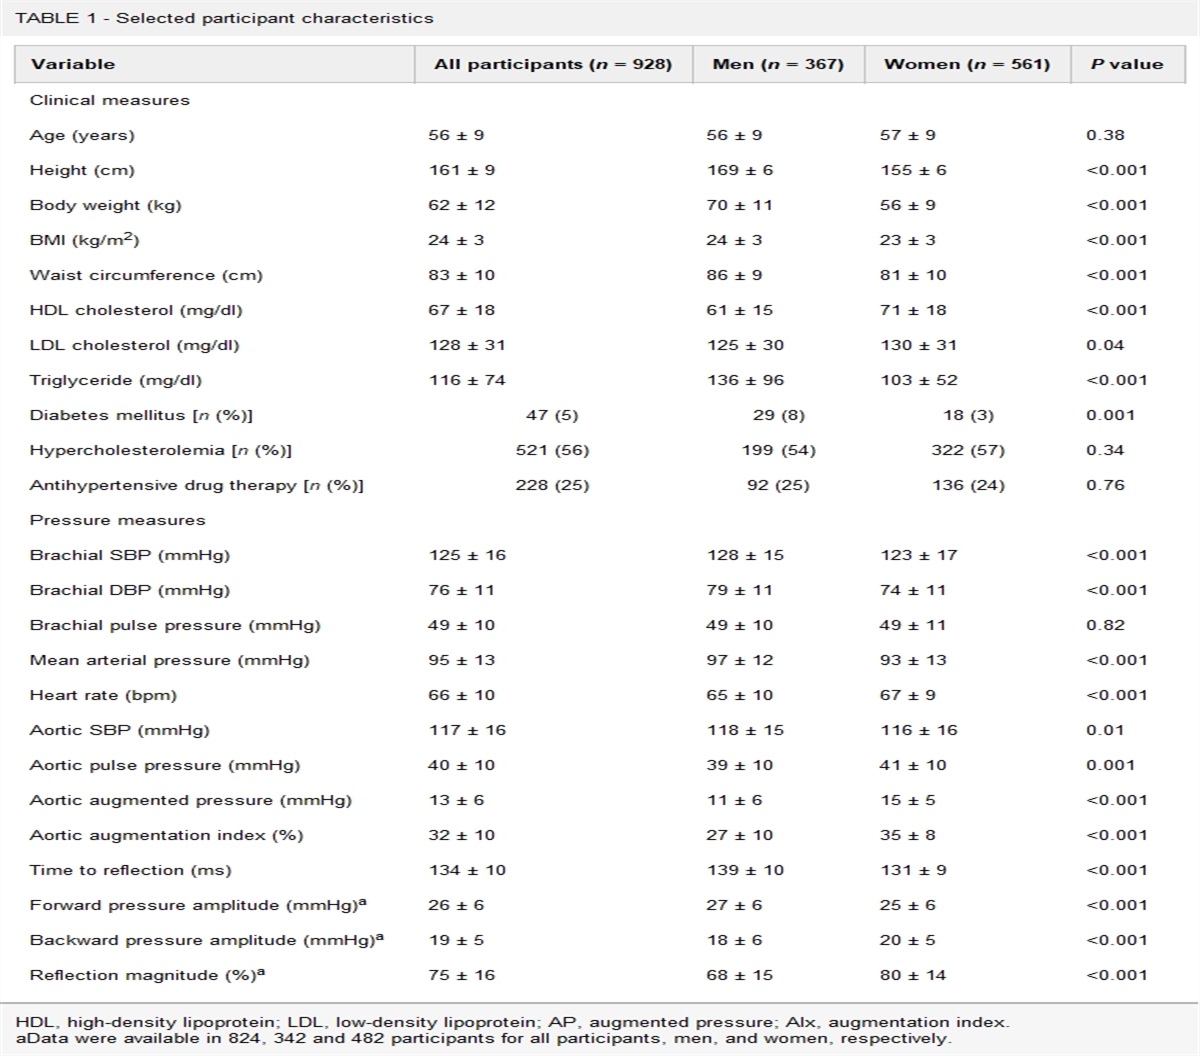
METHODS Experimental model and participant details: human study Study participantsData from the coronary artery risk development in young adults (CARDIA) study, an ongoing prospective cohort study of cardiovascular disease (CVD) risk factors in Black and White American adults was used. CARDIA was designed to study the evolution of cardiovascular disease (CVD) risk over adulthood. CARDIA participants were recruited in 1985–1986 (n = 5115, aged 18–30) from four U.S. urban centers (Birmingham, Alabama; Chicago, Illinois; Minneapolis, Minnesota; Oakland, California) [1,22]. Data had been collected from CARDIA participants at baseline and (for time-varying measures) during follow-ups by standardized procedures using validated survey instruments and clinical assessments. The majority of surviving participants have attended follow-up examinations, including 71% at the eighth follow-up at Year 30 (2015–2016). The present analysis includes data from a sample (n = 240) of CARDIA participants who attended the Year 30 exam (Table 2, Supplemental Digital Content, https://links.lww.com/HJH/C166). Exam-specific protocol details can be found on the central CARDIA website: https://www.cardia.dopm.uab.edu/scientific-resources-landing-page2. All relevant ethical regulations are in compliance for this study.
MeasuresData have been collected from CARDIA participants at baseline and (for time-varying measures) over follow-up using standardized procedures, and validated survey instruments and clinical assessments. Participants self-reported their age, race, sex, educational attainment, and use of lipid-lowering and antihypertensive medication use. Trained clinical staff measured resting systolic and diastolic blood pressure from participants in the seated position with elbow and forearm resting on the chair armrest. Blood pressure values were calculated as the mean of the second and third of three measurements taken with oscillometer (OmROn HEM907XL automated/oscillometric blood pressure monitor) calibrated to a random-zero sphygmomanometer. Arm cuff bladder size was based on arm circumference as follows: 9 cm cuff for 17.0–22.5 cm arm; 12.0 cm for 22.6–32.5 cm arm; 15.0 cm for 32.6–42.5 cm arm; and 17.5 cm cuff for 42.6–50.0 cm arm. For individuals with an arm circumference >50 cm, a thigh cuff was used with an OmROn 108ML aneroid/manual blood pressure monitor [23].
Bile acid analysis in human urineFasting spot urine samples were collected from participants in the clinic, immediately aliquoted and stored at −70°C. BAs in urine were measured according to previously reported methods [24]. BAs were quantified using ultra-performance liquid chromatography-triple quadrupole time-of-flight mass spectrometry (UPLC-MS) (Waters Corp., Milford, Massachusetts, USA). Raw data obtained from UPLC-MS were analyzed and quantified using Target-Lynx version 4.1 applications manager (Waters Corp.). Creatinine was measured using the Jaffe method.
Statistical analysisWe conducted multivariable-adjusted linear regression of systolic blood pressure on urinary bile acids, with separate regressions for each bile acid. For analysis, we normalized BAs to constant sum (total of measured bile acids for each participant sum to a 100). Model 1 was unadjusted for covariates; Model 2 included age, race, sex, study center, and educational attainment; Model 3 adjusted for Model 2 covariates plus lipid-lowering medication use, BMI, and urine creatinine. P-values were adjusted for multiple comparisons using the Benjamini–Hochberg false discovery rate (FDR).
Animal modelsAll procedures were performed in accordance with the Guide for the Care and Use of Laboratory Animals and were reviewed and approved by the Institutional Animal Care and Use Committee of the University of Toledo College of Medicine and Life Sciences, Toledo, Ohio, USA. This report comprises three different studies the timelines for which are shown in Figure 1, Supplemental Digital Content, https://links.lww.com/HJH/C166. The methods for these studies are listed below for each study:
Study 1: Hypertensive and normotensive rat modelsThe inbred Dahl salt-sensitive (SS/Jr or S) and Dahl salt-resistant (SR/Jr or R) rat strains were used in the study. The S and R rats are a widely used preclinical model selectively bred for hypertension in response to a high salt diet [25–29]. These rats were inbred in our Institution in 1985 and since then have been maintained in-house [29]. Due to their inherent propensity to develop hypertension, the entire S rat colony is bred and maintained on a low salt diet (0.3% NaCl; Harlan Teklad diet TD 7034, Madison, Wisconsin, USA). The Harlan Teklad diet (TD94217) was used for experiments involving a high salt regimen (2% NaCl). All rats in any single experiment were raised by breeding animals concomitantly. Both male and female S and R rats were used, totaling eight groups. Details on the group names, abbreviations and blood pressure indices are provided in the Table 1, Supplemental Digital Content, https://links.lww.com/HJH/C166. Blood pressure index is defined as a relative value that depicts the reported blood pressures of these strains for both systolic and diastolic, recorded for >35 years. The timeline for the study is shown in Figure 1A, Supplemental Digital Content, https://links.lww.com/HJH/C166. Rats were weaned on day 28 and high salt feeding commenced on day 42 for 3–4 weeks. From days 60 to 69, fresh feces were collected and archived at –80°C. At the end of the study, rats were euthanized for archival of serum and tissues.
Study 2: Germ-free versus germ-free conventionalized ratsInbred, male 7-week-old Sprague Dawley (SD) rats from Taconic Biosciences (Rensselaer, New York, USA) that were either germ-free (GF) or germ-free conventionalized (GFC) with microbiota (n = 5–6/group) were used for this study. Conventionalization of GF rats was performed by co- housing GF rats with conventionally raised rats (outbred) for 10 days (1:1 ratio). This allowed GF rats to receive a natural, continuous infusion of microbiota via coprophagy. Upon arrival at the University of Toledo, blood pressure was measured by tail-cuff method and animals were immediately sacrificed and fecal, serum, and tissue samples were collected. The timeline of the study is shown in Figure 1B, Supplemental Digital Content, https://links.lww.com/HJH/C166.
Study 3: Nutritional supplementation of hypertensive S rats with TaurineSix-week-old rats were raised on a high salt (2% NaCl) diet along with or without 3% taurine (Sigma-Aldrich, St Louis, Missouri, USA) in their drinking water for 6–7 weeks during which blood pressure was monitored (timeline shown in Figure 1C, Supplemental Digital Content, https://links.lww.com/HJH/C166). Rats were surgically implanted with radiotelemetry transmitters as described previously [30]. Postsurgery, rats were housed individually and allowed to recover prior to recording their blood pressure using the DSI software and equipment (https://www.datasci.com/). Systolic, diastolic, and mean arterial pressures were collected at 5-min intervals and analyzed using the Dataquest A.R.T 4.2 Software.
Study 4: Nutritional supplementation of hypertensive S rats with tauro-cholic acidEight-week-old rats were raised on a high salt (2% NaCl) diet along with or without 7.5 umol/l tauro- cholic acid (Sigma-Aldrich) in their drinking water for 5 weeks during which blood pressure was monitored (timeline shown in Figure 1D, Supplemental Digital Content, https://links.lww.com/HJH/C166). Rats were surgically implanted with radiotelemetry transmitters as described previously [30]. Postsurgery, rats were housed individually and allowed to recover prior to recording their blood pressure using the DSI software and equipment (https://www.datasci.com/). Systolic, diastolic, and mean arterial pressures were collected at 5-min intervals and analyzed using the Dataquest A.R.T 4.2 Software.
Bile acid analysis for studies 1 and 4Serum samples from rats (n = 5–6/group) were collected and shipped to the West Coast Metabolomics Center at UC Davis (http://metabolomics.ucdavis.edu/) for bile acids profiling by GC-TOF-MS based targeted metabolomics (http://metabolomics.ucdavis.edu/core-services/metabolomics-central-service-core).
Bile acid metabolomic analyses for rat studies 2 and 3Serum samples from rats were profiled by the Dan L. Duncan Cancer Center's Advanced Technology Core, Baylor College of Medicine. Serum Bile acids were quantified using the Biocrates Bile Acids (Biocrates Life Sciences AG, Innsbruck, Austria) kit in accordance with the user's manual [31]. In brief, 10 μl of the supplied internal standard solution was added to each well on a filter spot of the 96-well extracted plate. Next, 10 μl of each serum sample, quality control samples, blank, zero sample, or calibration standard were added to each well. Sample extract elution was performed with methanol and subjected to liquid chromatography and mass spectrometry (LC–MS/MS). LC–MS analysis were performed based on standard operating procedures provided by Biocrates bile acids kit. Chromatographic separation of the analytes was performed by LC system (Agilent Technology, Santa Clara, California, USA) using a reverse-phase LC and guard column provided by Biocrates then quantified by a calibration curve. Samples were introduced directly into a 6500 QTRAP (Sciex) using negative electrospray ionization operating in the Multiple Reaction Monitoring (MRM) mode and acquisition methods provided in the Biocrates bile acids kit. Data was exported for statistical analysis. The quantified Biocrates data are in absolute concentration (μmol/l) and used directly without further normalization for statistical analysis. The differentially regulated bile acids were identified by performing t-test for adjusted P-value of Padj. <0.25 (FDR, Banjamini–Hochberg procedure).
Additional targeted metabolomic profiling for studies 2 and 3Serum metabolites were extracted from using previously described standard procedures for targeted metabolomic profiling using ultra high-performance liquid chromatography/tandem- mass spectrometry [32,33].. The extracted samples were analyzed using high-performance liquid chromatography (HPLC) coupled to Agilent 6495 QQQ mass spectrometry. In ESI positive mode, the HPLC column was waters X-bridge amide 3.5 μm, 4.6 × 100 mm (Waters). Mobile phases A and B were 0.1% formic acid in water and acetonitrile respectively. Gradient flow: 0–3 min 85% B; 3–12 min 30% B, 12–15 min 2% B, 16 min 95% B, followed by re-equilibration till the end of the gradient 23 min to the initial starting condition of 85% B. Flow rate of the solvents used for the analysis is 0.3 ml/min. Data were normalized with internal standards and log2-transformed on a per-sample basis.
16S RNA analysis DNA extraction and quantificationFecal DNA was extracted from one fecal pellet (approximately 0.2 g) using QIAampPowerFecalDNA kit (QIAGEN, Hilden, Germany) followed by provided protocol. At the elution step, 50 ml of low TE buffer (0.1 mmol/l EDTA, Tris–HCl buffer, 10 mmol/l, pH 8.5) was used instead of AE buffer from the kit. DNA concentration was measured by NanoDrop and diluted to be 5 ng/ml in low TE buffer for PCR library preparation as per the Illumina User Guide: 16S Metagenomic Sequencing Library Preparation-Preparing 16S Ribosomal RNA Gene Amplicons for the Illumina MiSeq System (Part # 15044223 Rev. B).
PCRThe 16S rRNA gene targeting V3-V4 region was amplified using the Illumina primers: 5’TCGTCGGCAGCGTCAGATGTGTATAAGAGACAGCCTACGGGNGGCWGCAG and 5’GTCTCGTGGGCTCGGAGATGTGTATAAGAGACAGGGACTACHVGGGTWTCTAAT for index PCR, the Nextera XT index kit (FC-131-1002) was used to attach dual indices. Following the Illumina User Guide for the Illumina MiSeq System, 10 pmol/l denatured and diluted library was mixed with 10 pmol/l PhiX control spike-in to be 10% PhiX in the final volume and loaded on Illumina MiSeq V3 flow cell kit with 2 × 300 cycles.
Quality filtering, operational taxonomic unit picking and data analysisRaw paired-end reads were merged to create consensus sequences and then quality filtered using USEARCH (version 9). Chimeric sequences were identified and filtered using QIIME combined with the USEARCH (version 6) algorithm. Open reference operational taxonomic units (OTUs) were subsequently picked using QIIME combined with the USEARCH (version 6) algorithm, and taxonomy assignment was performed using Greengenes [34] as the reference database.
Statistical analyses of all animal studiesGraph Pad Prism version 8.4.3 (GraphPad Software, San Diego, California, USA) was used for all analyses. Student's t-test was used to compare two groups, whereas one-way ANOVA with Bonferroni post hoc test was used for studies with more than two groups. Pearson correlation was used to determine correlation. IBM SPSS Statistics v25 (IBM, Armonk, New York, USA) was used to determine correlation. R studio v3.5.2 (R Foundation for Statistical Computing, Vienna, Austria) and Graph Pad Prism 8.4.3 was used to generate heatmap. A P-value <0.05 was considered to be significant. All bar graph values are expressed as mean ± SEM.
Data availabilityAll the raw metabolomic and metagenomic data are available in Mendeley Data, V1, doi: 10.17632/jfc3n6rwh3.1.
RESULTS Conjugated bile acids were negatively associated with systolic blood pressure in humansIn multivariable-adjusted regression analysis, systolic blood pressure was negatively associated with glycohyodeoxycholic acid (GHDCA) [mean (SD): 1.06 (1.02)] at FDR of <0.10 (Fig. 1). The beta-coefficient for GHDCA and systolic blood pressure was −3.33 [95% CI: (−5.33, −1.32); FDR = 0.03], indicating a lower −3.33 mmHg systolic blood pressure per unit of normalized GHDCA (Table 3, Supplemental Digital Content, https://links.lww.com/HJH/C166). We note that covariate adjustment did not materially impact the magnitude of association or level of significance (Table 3, Supplemental Digital Content, https://links.lww.com/HJH/C166), which is consistent with the lack of association between GHDCA and all covariates aside from urine creatinine (Figures 2A−D, Supplemental Digital Content, https://links.lww.com/HJH/C166). Other bile acids were not significantly associated with systolic blood pressure at FDR of 0.10. The next most inversely associated bile acid with systolic blood pressure was glycolithocholic acid (GLCA), which attained significance only in Model 3 (Fig. 1). Therefore, the two top inversely associated bile acids with SBP were glycine conjugated GHDCA and GLCA.
 FIGURE 1:
 Conjugated bile acids (glycine conjugation for human) were negatively associated with systolic blood pressure (mmHg). Heatmap of multivariable-adjusted associations between bile acids and systolic blood pressure in CARDIA. Model 1 represents the association of bile acids (relative abundance) with respect to systolic blood pressure. Model 2 represents the adjusted Model 1 for sex, race, study center, age, and educational attainment. Model 3 represents adjusted Model 2 for the use of cholesterol lowering drugs, BMI, and urine creatinine. The tile colors represent beta coefficient values, with red color indicating negative association of systolic blood pressure with bile acids and blue color indicating positive association of systolic blood pressure with bile acids. The circle size is inversely related to P-value and only the circles representing bile acids with P < 0.05 are displayed.
Bile acid conjugation was inversely associated with systolic blood pressure in hypertensive ratsNext, we examined if a similar inverse correlation of bile acid conjugation was evident in the Dahl rat model, which is a widely studied genetic model of hypertension. Bile acid metabolomes of a cohort (n = 48, 6 rats per group) from Dahl salt-sensitive (S) and Dahl salt-resistant (R) rats on different dietary salt regimens were examined. These rats were 63–70 day old adults fed with either a high salt diet (2% NaCl) or a low salt diet (0.3% NaCl) for 3–4 weeks (Figure 1A, Supplemental Digital Content, https://links.lww.com/HJH/C166). An unbiased heatmap was generated with the normalized mean systemic bile acid concentration in each group. Hierarchical clustering showed that independent of strain and dietary salt-consumption, there was a distinct clustering of taurine-conjugated bile acids (Fig. 2a). Taurine-conjugated bile acids were most abundant in both sexes of the high salt fed normotensive R rat (Fig. 2a), suggesting a protective nature of taurine-conjugated bile acids against the development of elevated blood pressure. A heatmap was generated using the correlation between bile acids and blood pressure (Fig. 2b, Table 1, Supplemental Digital Content, https://links.lww.com/HJH/C166). The predominant form of conjugation in rodents, that is, taurine- conjugation was clustered and inversely associated with blood pressure (Fig. 2b). It is noteworthy that the collective data from humans and rats (Figs. 1 and 2b) support the same conclusion that conjugated bile acids have an inverse relationship with systolic blood pressure when considering that glycine is predominantly conjugated with bile acids in humans, whereas taurine is the dominant bile acid conjugate in rats.
 FIGURE 2:
 Taurine conjugation was negatively associated with blood pressure in hypertensive rat strains. Serum bile acid concentration was determined as described under Methods for study 1. (a) Heatmap with hierarchical clustering using the Ward method represented the bile acid concentration in eight different hypertensive groups (R Studio v3.5.2). Blue color represents lower bile acid concentration and red color represents higher bile acid concentration. S = hypertensive Dahl S rat, R = normotensive Dahl R rat (b) Heatmap showing correlation between blood pressure index and bile acids (GraphPad Prism v8.4.3). Blue color indicates negative correlation and red color indicates positive correlation. Blue box shows the negatively correlated bile acids which predominately contained taurine-conjugated bile acids. ♂: male, ♀: female.
Lack of microbiota in germ-free rats elevated conjugated bile acids and lowered blood pressureAs the gut microbiota deconjugates bile acids, we examined the contribution of gut microbiota on bile acid composition and blood pressure. We used GF rats, wherein the host-microbial synergy is nonexistent, and compared their systemic bile acid composition and blood pressure to concomitantly raised GF rats co-housed with conventional (GFC) rats to acquire microbiota (Figure 1B, Supplemental Digital Content, https://links.lww.com/HJH/C166). GF rats had significantly elevated taurine-conjugated bile acids and lower blood pressure compared to GFC rats which had acquired microbiota (Fig. 3a−c). These data show that the absence of the microbiota dependent deconjugation process resulted in the accumulation of conjugated bile acids. Further, reconstitution of gut microbiota in GF rats was sufficient to reprogram the bile acid composition to lower taurine-conjugated bile acids (Fig. 3a) and increase blood pressure (Fig. 3b and c).
 FIGURE 3: Germ-free (GF) Sprague−Dawley rats had a higher amount of taurine conjugated bile acids and reduced systolic blood pressure when compared to conventionalized GF rats. (a) Targeted metabolomic analyses of serum were performed by HPLC-MS to measure the concentration of bile acids as described under Methods for study 2. Heatmap represents the normalized concentration of bile acids. Blue color represents lower bile acid concentration and yellow color represents higher bile acid concentration. Hierarchical clustering using the Ward method. (b, c) Tail-cuff method was used to measure the systolic (b) and diastolic (c) blood pressures of the germ-free (n = 6) and germ-free conventionalized (n = 6) rats [56], presented here for clarity) (∗PShared microbiota associated with hypertension in humans and in rats
To further examine the relationship of particular bacterial taxa with the conjugation of bile acids, we compared the 16S rRNA bacterial profile from the human CARDIA study and our experimental animal model study. Based on the finding from CARDIA study, Sun et al. showed that Veillonella as the only vector aligned with hypertension and higher systolic blood pressure, whereas the taxa Akkermansia, Ruminococcus, Anaerovorax, Sporobacter, Asacharobacter were vectors aligned with normotension and lower systolic blood pressure [23]. When we examined the commonality between this published human study and the current rat study 1, we found that the family Veillonellaceae was directly proportional to the extent of blood pressure both in humans and in rats (Fig. 4a, Figures 3 and 4, Supplemental Digital Content, https://links.lww.com/HJH/C166) and Akkermansia of the family Verrucomicrobiaceae was the only taxa inversely proportional to the extent of blood pressure (Fig. 4a, Figure 4, Supplemental Digital Content, https://links.lww.com/HJH/C166). The only other commonality between humans and rats for their association with BP was Ruminococcus. However, unlike in humans wherein Ruminococcus was negatively associated with blood pressure, both the family Ruminococcaceae and genus Ruminococcus was positively associated with blood pressure in the rat models (Fig. 4a, Figure 4A, B, Supplemental Digital Content, https://links.lww.com/HJH/C166) [23]. These data indicate that in the setting of hypertension, consistent reprogramming of two specific taxa, Akkermansia and Veillonellaceae occurs both in humans and in rats.
 FIGURE 4:
 Association of Veillonella and Akkermansia with blood pressure in rats. (a) Heatmap showing the correlation between blood pressure index and microbiota. Blue color indicates microbiota features negatively correlated with blood pressure index and red color indicates microbiota features positively correlated with blood pressure index. Black arrows highlight the common bacteria between human CARDIA study and the current rat study (study 1).
Enhancing taurine-conjugation of bile acids lowered systolic and diastolic blood pressureTo examine if hypertension could be treated by replenishing systemic conjugated bile acids, we administered groups of hypertensive S rats with 3% (w/v) taurine in drinking water (Figure 1C, Supplemental Digital Content, https://links.lww.com/HJH/C166). Nutritional supplementation with taurine significantly elevated the systemic taurine-conjugated bile acid levels of hypertensive male rats (Fig. 5a). Taurine-fed male rats had a remarkable lowering of both their systolic and diastolic blood pressures (Fig. 5b, and c, Figure 6, Supplemental Digital Content, https://links.lww.com/HJH/C166). To determine if there are any sex effects, we repeated these studies in female hypertensive S rats. Consistent with the observations in males, female rats given taurine also elevated levels of their taurine-conjugated bile acids and demonstrated a significant lowering of their systolic and diastolic blood pressures (Fig. 6a−c, Figure 7, Supplemental Digital Content, https://links.lww.com/HJH/C166) indicating that the observed protective effect of nutritional supplementation of taurine to correct the deficiency of the antihypertensive taurine-conjugated bile acids was independent of sex.
 FIGURE 5: Feeding taurine to male rats decreased blood pressure through conjugation of bile acids. (a) Targeted metabolomic analyses of serum were performed by HPLC-MS to measure the concentration of bile acids as described under the Methods section for study 3. Control: Dahl S rats fed with high salt diet (2% NaCl); Taurine: Dahl S rats fed with high salt diet (2% NaCl) and 3% v/v taurine with drinking water. Heatmap was generated using the bile acid profiles (Figure 6, Supplemental Digital Content, https://links.lww.com/HJH/C166) with FDR-adjusted P-value ∗PTaurine: Dahl S rats fed with high salt diet (2% NaCl) and 3% v/v taurine with drinking water.
 FIGURE 6: Feeding taurine to female rats decreased blood pressure through conjugation of bile acids. (a) Targeted metabolomic analyses of serum were performed by HPLC-MS to measure the concentration of bile acids. Heatmap was generated using the bile acid profiles (Figure 7, Supplemental Digital Content, https://links.lww.com/HJH/C166) with FDR-adjusted P-value Taurine: Dahl S rats fed with high salt diet (2% NaCl) and 3% v/v taurine with drinking water. (b, c) Dahl S rats were fed with high salt diet (2% NaCl) and 3% v/v taurine with drinking water along with high salt diet. Radiotelemetry was used to measure the systolic (b) and diastolic (c) blood pressure of the high salt control and high salt taurine fed groups. Blood pressure data were presented as mean ± SEM (∗PTaurine: Dahl S rats fed with high salt diet (2% NaCl) and 3% v/v taurine with drinking water.Systemic levels of taurine-conjugated bile acids are not responsible for reshaping the compositions of Akkermansia and Veillonellaceae
Next, we examined whether the circulating levels of conjugated bile acids reshaped the compositions of Akkermansia and Veillonellaceae. While feeding taurine to rats increased their systemic taurine-conjugated bile acids (Figures 5a and 6a, Figure 6, Supplemental Digital Content, https://links.lww.com/HJH/C166, Figure 7, Supplemental Digital Content, https://links.lww.com/HJH/C166), this did not result in an altered composition of either Akkermansia or Veillonellaceae (Figure 8, Supplemental Digital Content, https://links.lww.com/HJH/C166). These data indicated that Akkermansia and Veillonellaceae were nonresponsive to increments in conjugated bile acids. Therefore, we inferred that Akkermansia and Veillonellaceae are likely upstream of the deconjugation process. In support of this inference, at least one of these microbiota, that is, Veillonella are known to deconjugate bile acids [35].
Amelioration of hypertension by taurine conjugated bile acids was not linked to changes in bile acid metabolism related transcripts in the kidneyTo test if alterations in conjugated bile acid levels played any role in renal bile acid related gene expression, we examined transcript levels of genes that are known to be regulated by bile acids [36]. None of the genes examined (Glp1r, Tgr5, Pgc1a, and Ucp1) were differentially expressed in kidneys from either male or female rats fed with or without taurine (Figure 9, Supplemental Digital Content, https://links.lww.com/HJH/C166).
Taurine-conjugated bile acids reshaped the serum metabolomeTo address the question of how conjugated bile acids lowered blood pressure, we reasoned that the mediators connecting conjugated bile acids to blood pressure should be identical and prominently traceable in all our studies regardless of the variations in their experimental designs. We therefore conducted a series of untargeted metabolomic studies from both male and female S rats in the taurine-feeding study as well as from the cohort of GF and germ-free conventionalized (GFC) rats and cross-compared our findings. Heatmaps documented the wide variety of differential metabolomes in each of the three experimental conditions (Figs. 7, 8 and 9). Among these, none of the differentially upregulated metabolites were consistently found in the three groups of rats that has higher circulating taurine-conjugated bile acids and lower blood pressure (i.e. GF, male and female S rats with Taurine) (Fig. 10a). Interestingly and in contrast, there were only 7 metabolites consistently downregulated in all the rat studies, wherein circulating taurine-conjugated bile acids were higher and both systolic and diastolic blood pressures were lower (Fig. 10b). These metabolites were succinate, betaine, cytosine, valine, malate, 4-coumarate and guanidine acetate. Importantly, succinate, which we and others have reported as a pro-hypertensive metabolite [37–41], was prominently increased in animals in all studies wherein their systemic taurine-conjugated bile acids were lower and blood pressures were elevated (Fig. 10c−e).
 FIGURE 7:
 Altered metabolomic profiles of germ-free rats compared to germ-free conventionalized rats. Metabolomic analyses of serum samples were performed by HPLC-MS to measure the concentration of primary metabolites as described under the Methods section for study 2. Heatmap was generated using the metabolite profile that were FDR-adjusted P-value <0.25. Blue color represents lower normalized metabolite concentration and yellow color represents higher normalized metabolite concentration. Hierarchical clustering using ward Method was used to assign the clustering showed in the dendrogram.
 FIGURE 8:
 Administration of taurine to male rats altered the metabolomic profiles of Dahl salt-sensitive (S) rats. Metabolomic analyses of serum samples were performed by HPLC-MS to measure the concentration of primary metabolites as described under the Methods section for study 3. Heatmap was generated using the metabolite profiles with FDR-adjusted P-value <0.25. Blue color represents lower normalized metabolite concentration and yellow color represents higher normalized metabolite concentration. Hierarchical clustering using Ward method was used to assign the clustering and showed in dendrogram. Control: Dahl S rats fed with high salt diet (2% NaCl); Taurine: Dahl S rats fed with high salt diet (2% NaCl) and 3% v/v taurine with drinking water.
 FIGURE 9:
 Administering taurine to female rats altered the untargeted metabolomics profiles of Dahl salt-sensitive (S) rats. Untargeted metabolomic analyses of serum were performed by HPLC-MS to measure the concentration of primary metabolites as described under the Methods section for study 3. Heatmap was generated using the metabolite profiles that were FDR-adjusted P-value <0.25. Blue color represents lower bile acid concentration and yellow color represents higher bile acid concentration. Hierarchical clustering using the Ward method was used to assign the clustering and showed in dendrogram. Control: Dahl S rats fed with high salt diet (2% NaCl); Taurine: Dahl S rats fed with high salt diet (2% NaCl) and 3% v/v taurine with drinking water.
 FIGURE 10:
 Intermediary metabolites were identically altered both in male and female rats fed with taurine as well as in germ-free rats. (a) Venn diagram showing downregulated metabolites. (b) Venn diagram showing the numbers of upregulated metabolites. Relative abundance of succinate in (c) the germ-free study (study 2), (d) taurine feeding study (study 3, males), (e) taurine feeding study (study 3, females). Control: Dahl S rats fed with high salt diet (2% NaCl); Taurine: Dahl S rats fed with high salt diet (2% NaCl) and 3% v/v
留言 (0)