
記住我
In the last years, immunotherapy has emerged as a very promising treatment against cancer. Immune checkpoint inhibitors, in particular blocking antibodies against the cytotoxic lymphocyte-associated protein 4 (CTLA-4), the programmed cell death protein 1 (PD-1) and its ligand PD-L1, have been approved for several tumor types including advanced melanoma, non-small cell lung cancer and renal cell carcinoma.1 In 2017, two chimeric antigen receptor (CAR) T-cell therapies received Food and Drug Administration approval for hematopoietic tumors.1 However, long-term durable responses remain limited to a relatively low percentage of patients and tumor types.1 Whether consisting in the reinvigoration of pre-existing but suppressed tumor-specific CD8 T cells, as is the case for immune checkpoint inhibitors, or in the infusion of CD8 T cells recognizing tumor antigens, as for adoptive cell therapies (ACT), immunotherapies depend on CD8 T cell-tumor infiltration, localization, fitness and effector activity in the hostile, immunosuppressive tumor microenvironment (TME).
Hypoxia is a common feature of most solid tumors, which are poorly or inefficiently perfused due to insufficient or aberrant blood vessel formation within the tumor, leading to low concentrations of oxygen and nutrients and accumulation of waste products.2–5 Through the activity of the hypoxia-inducible factor (HIF)-1, hypoxia enhances glycolysis and reduces oxidative phosphorylation, exacerbating the competition for glucose.4–6 Beside metabolic stress, hypoxia also promotes tumor malignancy, favors tumor immune evasion by downregulating major histocompatibility complex class I expression on tumor cells, and affects immune-cell infiltration and phenotype through the production of chemokines and cytokines.4 5 7 Hypoxia induces the recruitment of myeloid cells and regulatory T cells,4 5 and it enhances their immunosuppressive phenotype inducing the expression of arginase-1, nitric oxide synthase, PD-L1 and of the ectonucleotidases CD39 and CD73 which degrade extracellular ATP into the immunosuppressive metabolite adenosine.4 5 8
Overall, even though HIF-1α stabilization sustains CD8 T-cell effector function by increasing the expression of effector molecules and inhibitory or costimulatory receptors,9 10 tumor hypoxia creates a highly immunosuppressive environment so that these cells do not usually infiltrate hypoxic tumor areas but rather tend to localize close to blood vessels.11 12 Therefore, tumor hypoxia remains a challenge that restrains the success of immunotherapy.
Metformin, the first-line therapy for type 2 diabetes, was shown to reduce tumor incidence in patients with diabetes and is currently evaluated in several cancer clinical trials.13 14 Various direct and indirect antitumoral effects of metformin have been described. Metformin was reported to target cancer-initiating stem cells.14 15 Preclinical studies have shown a synergism between metformin and different types of immunotherapies.16–21 Metformin can modulate the TME through several mechanisms, for instance, by diminishing intratumoral accumulation of myeloid-derived suppressor cells (MDSCs)22 or by reducing their suppressive phenotype.23 24 Metformin was also shown to downregulate PD-L1 expression on cancer cells,20 21 25 26 thus improving CD8 T-cell function against the tumor. Moreover, by reducing oxidative phosphorylation through mitochondrial complex I targeting, metformin attenuates tumor hypoxia in certain cancer types, resulting in better tumor response to PD-1 blockade, γδ T cells immunity or radiotherapy.16 17 27 Metformin was also shown to affect memory/effector T-cell differentiation.18–20 28 In particular, Eikawa et al demonstrated that metformin protects tumor-infiltrating CD8 T cells from apoptosis and exhaustion while favoring conversion from central memory (TCM) to effector memory T cells (TEM) in highly immunogenic tumor models.18 However, the cellular and molecular mechanisms through which metformin reverted immune exhaustion were not explored.
Here, we show that metformin has a direct effect on CD8 T-cell survival and fitness in hypoxia, in vitro and in vivo. This results in improved response to immunotherapies in different tumors, including an autochthonous melanoma model developed in our lab and named TiRP.29 30 This model expresses the MAGE-type antigen P1A and is highly immunosuppressive, representing therefore a clinically relevant model to study primary resistance to immunotherapy.30–32 Through this newly described mode of action, metformin rescues CD8 T cells from a strong immunosuppressive cue that limits the efficacy of immune checkpoint inhibitors or ACT. Alone or in synergism with the lymphodepleting preparative drug cyclophosphamide (CTX), metformin sensitizes resistant and hypoxic tumors to immunotherapy.
Materials and methodsMiceB10.D2 TiRP-10B+/+;Ink4a/Arfflox/flox (TiRP) mice, B10.D2;Ink4a/Arfflox/flox mice and B10.D2-Rag1KO mice heterozygous for the H-2Ld/P1A35-43-specific TCR transgene (TCRP1A) were previously described.30 C57BL/6 mice, C57BL/6-Tg(Tcra Tcrb)1100Mjb/Crl (OT-1 OVA-TCR) and NOD scid gamma (NSG) mice were purchased, respectively, from Harlan, Charles River, Jackson lab. TiRP RAG1KO mice were a gift from A.M. Schmitt-Verhulst (Marseille)31. Mice were maintained under specific pathogen-free conditions at the Platform Laboratory Animal Facility of the de Duve Institute.
Cell linesL1210.P1A.B7-1, P511 and P1.204 cell lines were already described.30 MC38 cells were a gift from P. Berraondo (Navarra); LL2-Thy1.1-OVA (LLC-OVA) cells, expressing a cytoplasmic form of ovalbumin, were a gift from D. Fearon (Cambridge); OVA-transfected EL-4 cells (EG7) were a gift from J. Van Ginderachter (Brussels); B16F1 cells were obtained from ATCC (CRL-6323). T429.11 clone was derived from an inducible TiRP melanoma as already described.30
All cells were maintained at 37°C and 8% CO2. All culture media contained 10% fetal bovin serum, L-arginine (0.55 mM, Merck), L-asparagine (0.24 mM, Merck), glutamine (1.5 mM, Merck), 50 U/mL penicillin and 50 mg/mL streptomycin (Life Technologies) (complete medium). Cell lines were routinely tested for mycoplasma contamination. For experiments in hypoxia, a hypoxystation (Whitley H35) at 37°C, 8% CO2 and 1% O2 was used.
Mice treatments4OH-Tamoxifen (Imaginechem) dissolved in ethanol and mineral oil (1:9 ratio) and sonicated for 30 min, was injected subcutaneously (2 mg/200 µL) in the neck area of gender-matched TiRP mice aged 7–9 weeks; experiments were performed on unpigmented tumors. Gender-matched C57BL/6 wild-type mice aged 7–9 weeks were injected subcutaneously with 106 B16F1, LLC-OVA, EG7-OVA or MC38 cells; B10.D2;Ink4a/Arfflox/flox or TiRP RAG1KO mice were injected intradermally with 2×10⁶ million cells of freshly dissociated TiRP tumors. Tumor volume was calculated as: volume=π×width2×length/6. Before treatment, mice were randomized based on tumor size. CTX (Sigma C7397) was injected intraperitoneally at 100 mg/kg. For ACT, 107 TCRP1A CD8 T cells or 2×10⁶ OT-1 CD8 T cells (in 200 μL phosphate buffered saline) were injected in the mouse tail vein. Metformin (Enzo ALX-270-432) was dissolved in mice drinking water at 0.5 mg/mL and refreshed every 3 days. Four injections of anti-PD1 antibody (Bio-X-Cell, RMP1-14) or RatIgG2a isotype (Bio-X-Cell, 2A3) at 100 µg/mouse (B16F1) or 200 µg/mouse (MC38) were performed intraperitoneally every 3 days. For hypoxia detection, 60 mg/kg of pimonidazole hydrochloride (Hypoxyprobe) was injected intraperitoneally 45 min before mice sacrifice. Sample sizes for all experiments were chosen based on previous experiences.
Mouse CD8 T-cell activation and treatmentCD8 T cells were isolated from spleen, axillary and inguinal lymph nodes of TCRP1A females aged 7–10 weeks using antimouse CD8α (Ly-2) MicroBeads (Miltenyi Biotech, 130-117-044), and co-cultured with irradiated (10 000 rads) L1210.P1A.B7-1 cells at 1:2 ratio in IMDM (GIBCO 12440053) complete medium containing b-mercaptoethanol (50 μM, Sigma, M3148). Four days later, CD8 T cells were purified on a lymphoprep gradient (StemCell, 07851) and used for ACT or cultured in presence of rhIL-2 (25 U/mL, StemCell, 78036.2) and the indicated treatment at 21% or 1% O2. The following reagents were used: metformin (Enzo, ALX-270-432, 2 mM in H2O), tert-butyl hydroperoxide (Sigma, 458139), L-glutathione (Sigma, G6529, 3.2 mM in H2O), N-acetyl-L-cysteine (Merck Life Science, A7250-25G, 10 mM in PBS), IACS-010759 (Axon Medchem, 2909, 100 nM in dimethyl sulfoxide). For proliferation, 106/mL cells were labeled with Violet CellTrace (Invitrogen, C34557) at 5 µM for 20 min at 37°C according to the manufacturer’s instructions, before treatments. For preconditioning experiments, CD8 T cells were treated with metformin (2 mM) or H2O for 3 days before ACT.
For OT-1 CD8 T-cell activation, splenocytes of OT-1 OVA-TCR females aged 7–12 weeks were cultured for 3 days in RPMI (GIBCO 52400041) complete medium containing b-mercaptoethanol (50 μM, Sigma), sodium pyruvate (1 mM, GIBCO 11360070), 1 µg/mL SIINFEKL peptide and rhIL-2 at 25 U/mL. On day 3, cells were seeded in fresh medium with rhIL-2. After 3 days, CD8 T cells were purified on a lymphoprep gradient and used for in vitro experiments or for ACT, as above; for preconditioning experiments, metformin (2 mM) or H2O were added during the last 3 days of culture.
Flow cytometry stainingAnnexin V staining was performed in annexin buffer (20 min, room temperature); 7-aminoactinomycin D was added before acquisition. CM-H2DCFDA or dihydrorhodamine 123 staining were performed in preconditioned Hank’s balanced salt solution (Sigma, 6648) in normoxia or hypoxia for 30 min. Fixable viability dye (15 min, 4°C) was used to identify dead cells, followed by CD16/CD32 blocking (15 min, 4°C) and incubation with extracellular antibody (20 min, 4°C). Intracellular stainings (30 min, 4°C) were performed after cell fixation and permeabilization; anti-pimonidazole antibody was incubated 1 hour at 37°C. Samples were acquired at BD LRSFortessa or BD FACSVerse based on the experiment and analyzed with FlowJo V.10.7.1. Antibodies and reagents are listed in online supplemental table S1.
StatisticsData entry and analyses were performed in a blinded fashion. Statistical analyses were performed using GraphPad Prism software (V.9.2) using two-tailed unpaired t-test for pairwise comparison; for tumor growth two-way analysis of variance was used, with Tukey’s correction for multiple comparisons when comparing groups; survival curves were compared with log-rank (Mantel-Cox) test.
Additional information, including lists of antibodies used for immunohistochemistry (online supplemental table S2) and for western blot (online supplemental table S3), can be found in the online supplemental material.
ResultsMetformin rescues CD8 T-cell fitness in hypoxia in vitroTo study the effect of hypoxia on activated CD8 T cells, we used CD8 T cells from TCRP1A transgenic mice, which recognize the MAGE-type tumor antigen P1A. After 4 days of activation in normoxia, cells were incubated at 21% or 1% oxygen for 24–72 hours. Exposure to hypoxia reduced cell number and expansion compared with cells incubated in normoxia (figure 1A); in particular, hypoxia increased early and late apoptosis and reduced CD8 T-cell proliferation (figure 1B–D and online supplemental figure 1A–D). Interestingly, the reduced cell number and proliferation and the induction of apoptosis in cells incubated at 1% oxygen were partially rescued when CD8 T cells were treated with metformin, indicating that this drug directly improved CD8 T-cell survival in hypoxic conditions (figure 1A–D and online supplemental figure 1A–D). Similar results were obtained with OT-1 CD8 T cells, which recognize the ovalbumin antigenic peptide (OVA) (online supplemental figure 1E–H).
 Figure 1
 Metformin rescues CD8 T-cell fitness in hypoxia in vitro. (A) Viable cell count of activated TCRP1A CD8 T cells incubated in normoxia (21% O2) or hypoxia (1% O2) in presence or not of metformin (2 mM). (B, C) Quantification of early (B) and late (C) apoptosis measured by fluorescence-activated cell sorting (FACS) staining for Annexin V and 7-aminoactinomycin D (7-AAD) in cells treated as in (A) for 72 hours. (D) Activated TCRP1A CD8 T cells were labeled with CellTrace Violet Cell Proliferation Kit before being treated as in (A) to assess cell proliferation; proliferation was calculated as dilution of median fluorescence intensity of the violet dye between day 0 (before treatments) and 72 hours of treatments. (E, F) Programmed cell death protein 1 (PD-1) (E) and lymphocyte-activation gene 3 (LAG3) (F) expression measured by FACS in cells treated as in (A). (G) ELISA for interferon (IFN)-γ in the supernatant of cells treated as in (A) for 48 hours before being co-cultured ON with P511 or P1.204 cells, pulsed or not with the P1A antigen as indicated. (H) tumor necrosis factor (TNF)-α, IFN-γ and lysosomal-associated membrane protein 1 (Lamp-1/CD107) expression measured by FACS in cells treated as in (A) for 48 hours before being stimulated with P511 cells for 5 hours. Results in B-H are expressed in fold changes compared with normoxia control. A–C, E, F, H is a pool of three independent experiments; D, G is a pool of four independent experiments. All the conditions are assessed in triplicate in each individual experiment. MFI, median fluorescence intensity. All data are mean±SEM. *P<0.05; **p<0.01; ***p<0.001; ****p<0.0001, calculated by two-tailed unpaired t-test.
We also analyzed CD8 T-cell phenotype. As previously reported,9 hypoxia increased the expression of the immune checkpoint markers PD-1 and LAG3 (figure 1E,F); yet, this induction was reduced by metformin (figure 1E,F). Consistent with the immunosuppressive effect of hypoxia, incubation at low oxygen tension reduced interferon (IFN)-γ production by CD8 T cells co-cultured with P815 cells expressing the P1A antigen (P511) or with P1A-negative cells (P1.204) pulsed with the P1A antigenic peptide (figure 1G); however, metformin restored cytokine production in response to target cell exposure in hypoxic condition (figure 1G). Similar results were obtained by intracellular cytokine staining (ICS) for tumor necrosis factor (TNF)-α, IFN-γ and lysosomal-associated membrane protein 1 (Lamp-1/CD107) (figure 1H).
These findings indicated a direct beneficial effect of metformin on CD8 T cells exposed to hypoxia, rescuing them from cell growth arrest and apoptosis, and restoring CD8 T-cell effector function, by downregulating the expression of exhaustion markers and improving cytokine production.
Metformin improves tumor response to adoptive cell therapy and CD8 T-cell infiltration in hypoxic TiRP tumor areasGiven these results we sought to investigate whether metformin could improve CD8 T-cell fitness in vivo in hypoxic tumors. We previously showed that the autochthonous melanoma TiRP tumors are resistant to ACT with activated TCRP1A CD8 T cells due to an immunosuppressive TME that induces apoptosis of tumor-specific CD8 T cells and their disappearance from the tumor.30 Apoptosis of tumor-infiltrating T lymphocytes (TILs) was triggered by Fas-L expressed by polymorphonuclear MDSC (PMN-MDSC), which are highly enriched in TiRP tumors. Therefore, to create a favorable milieu for the engraftment of newly transferred CD8 T cells, we treated TiRP mice with one injection of lymphodepleting dose of cyclophosphamide (CTX) one day before ACT, similarly as in the preparative regimen for CAR T-cell therapy.33 34 In parallel, metformin was supplemented in the drinking water from the day of ACT until the end of the experiment. Consistent with our previous report,30 ACT per se did not affect tumor growth in TiRP mice (figure 2A and online supplemental figure 2A). In contrast, both CTX or metformin alone sensitized TiRP tumors to ACT, resulting in reduced tumor growth and enhanced mice survival (figure 2A,B and online supplemental figure 2A); these effects were further improved when CTX and metformin were combined together (figure 2A,B and online supplemental figure 2A). Interestingly, we observed that a single injection of CTX significantly delayed tumor growth in TiRP mice even in the absence of ACT, although tumor response was further improved by immunotherapy (figure 2A and online supplemental figure 2A), suggesting a direct antitumor effect that could be due to the cytostatic properties of CTX. In contrast, metformin was ineffective in the absence of ACT (figure 2A and online supplemental figure 2A), indicating that the antitumoral effect of metformin was dependent on adoptively transferred tumor antigen-specific CD8 T cells in this model. In line with that, we confirmed that CTX, but not metformin, retarded growth of TiRP and MC38 tumors, in both immunocompetent and immunodeficient mice (online supplemental figure 2B,C). We further validated the direct cytostatic effect of CTX on tumor cells by treating the TiRP-derived cell line (T429.11) and the MC38 cell line in vitro with an active metabolite of CTX, 4-hydroperoxycyclophosphamide (online supplemental figure 2D).
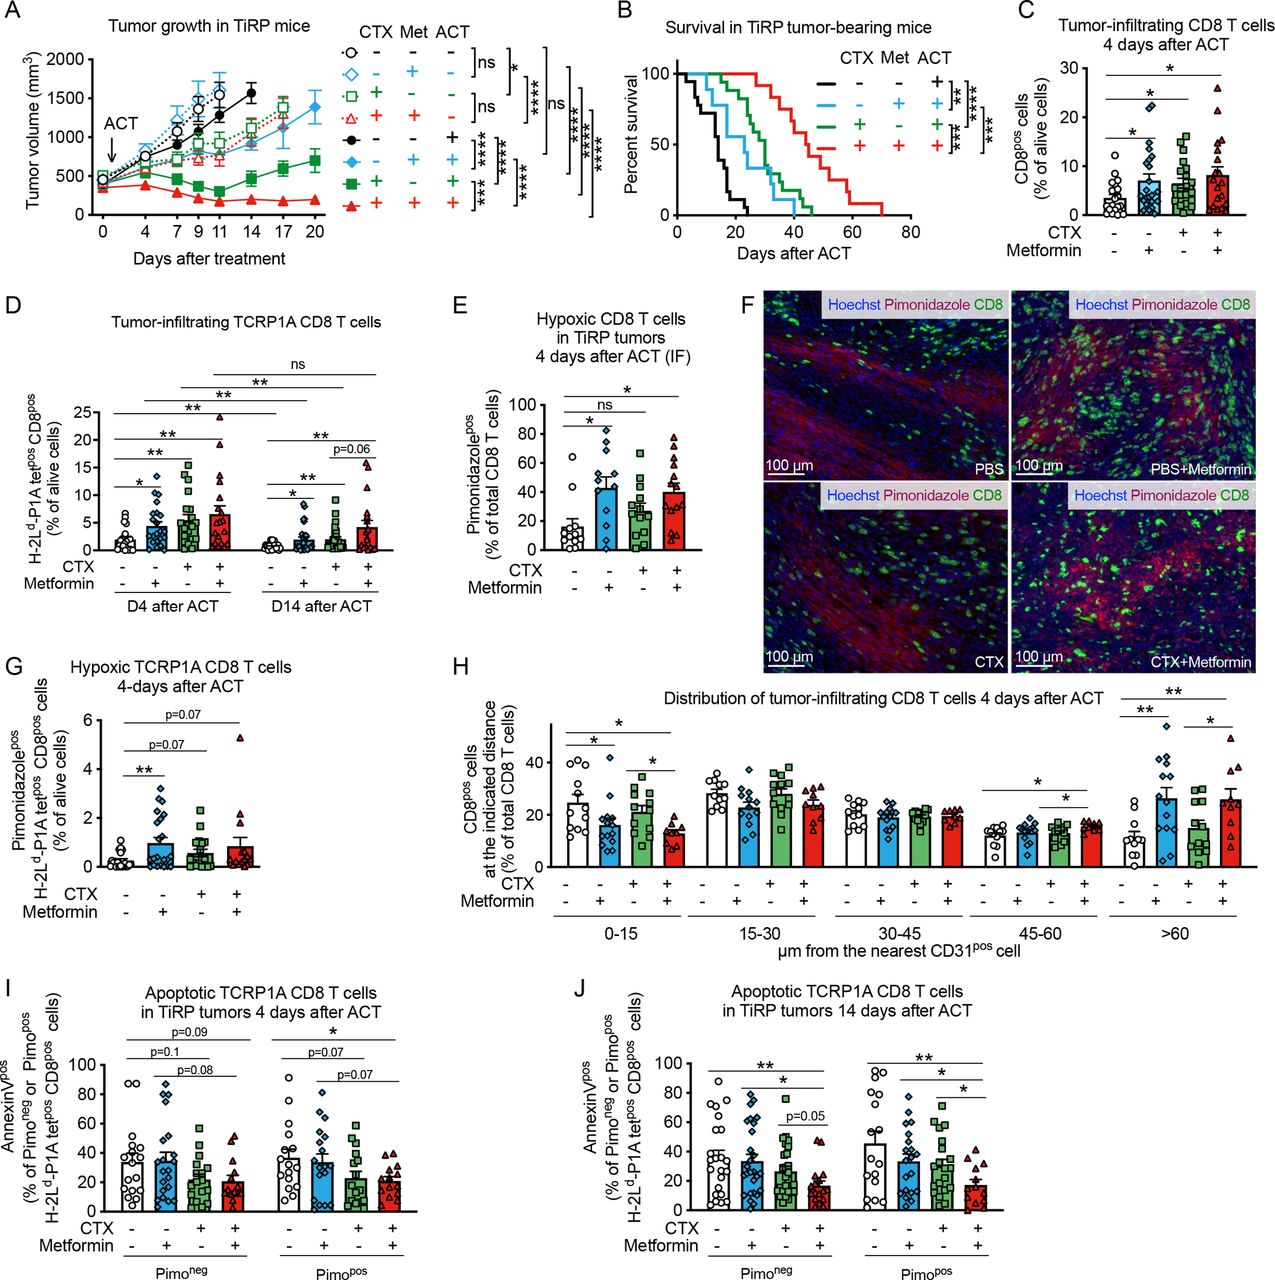 Figure 2
 Metformin improves tumor response to adoptive cell therapy (ACT) and CD8 T-cell infiltration in hypoxic TiRP tumor areas. (A) Tumor growth in TiRP mice that have received a single injection of cyclophosphamide (CTX, 100 mg/kg) or phosphate buffered saline (PBS) when the tumor size was around 400 mm3, followed (continuous lines) or not (dotted lines) by ACT of 10 million activated TCRP1A CD8 T cells 24 hours later and treated or not with metformin (0.5 mg/mL) in drinking water for 20 days after ACT or when any humane end point was reached (A, PBS no ACT: n=12; PBS+metformin no ACT: n=8; CTX no ACT: n=10; CTX+metformin no ACT: n=9; PBS and ACT: n=25; PBS+metformin and ACT: n=23; CTX and ACT: n=17; CTX+metformin and ACT: n=13). (B) Kaplan-Meier survival curve in TiRP mice treated as in (A) on ACT (B, PBS: n=18; PBS+metformin: n=9; CTX: n=17; CTX+metformin: n=12). (C) Fluorescence-activated cell sorting (FACS) analysis of CD8 T-cell tumor infiltration in TiRP mice treated as in (A) 4 days after ACT (C, PBS: n=21; PBS+metformin: n=23; CTX: n=20; CTX+metformin: n=19). (D) FACS analysis of TCRP1A CD8 T-cell tumor infiltration in TiRP mice treated as in (A), 4 days and 14 days after ACT (D, 4 days after ACT, PBS: n=20; PBS+metformin: n=22; CTX n=20; CTX+metformin: n=19; 14 days after ACT, PBS: n=23; PBS+metformin: n=28; CTX: n=25; CTX+metformin: n=18). (E, F) Immunofluorescence (IF) quantification and representative images of hypoxic CD8 T cells in TiRP tumors treated as in (A), 4 days after ACT (F, PBS: n=12; PBS+metformin: n=12; CTX: n=13; CTX+metformin: n=14). (G) FACS analysis of hypoxic TCRP1A CD8 T cells among alive cells in TiRP tumors treated as in A, 4 days after ACT (G, PBS: n=20; PBS+metformin: n=22; CTX: n=18; CTX+metformin: n=15). (H) IF analysis of the percentage of CD8 T cells (among total CD8 T cells) found at the indicated distance from the closest CD31pos cells in TiRP tumors treated as in (A), 4 days after ACT (H, PBS: n=12; PBS+metformin: n=14; CTX: n=13; CTX+metformin: n=10). (I), (J) FACS analysis of apoptosis in pimonidazole-negative or pimonidazole-positive TCRP1A CD8 T cells in TiRP tumors treated as in (A), 4 days after ACT (I) and 14 days after ACT (J) (I, PBS: n=17; PBS+metformin: n=21; CTX: n=17; CTX+metformin: n=14; J, PBS: n=23; PBS+metformin: n=27; CTX: n=26; CTX+metformin: n=17). All data are mean±SEM. ns, not significant; *p<0.05; **p<0.01; ***p<0.001; ****p<0.0001, calculated by two-way analysis of variance with Tukey’s multiple comparison correction in (A), log-rank (Mantel-Cox) test in (B), two-tailed unpaired t-test in (C–E, G–J).
When analyzing the cellular composition of the TME, we found that CTX, but not metformin, reduced tumor infiltration by PMN-MDSCs (CD11bposLy6Cneg/lowLy6Gpos cells) (online supplemental figure 3A), whose immunosuppressive functions in the TiRP model were extensively characterized,30 and also reduced infiltration by regulatory T (Treg) cells (online supplemental figure 3B), in line with previous reports.33 CTX also induced the expression of C-X-C motif chemokine ligand (CXCL)9 and CXCL10 by CD45-negative cells (online supplemental figure 3C–F), and of homeostatic cytokine interleukin (IL)-7 (online supplemental figure 3G). Metformin-treated and/or CTX-treated tumors showed higher levels of IL-2 transcripts compared with the control group (online supplemental figure 3H).
In line with the mitigation of tumor immunosuppression and the induction of cytokine storm, CTX increased tumor infiltration of CD8 T cells, particularly the adoptively transferred TCRP1A CD8 T cells, shortly after ACT and at later time points (figure 2C,D). Metformin treatment alone also improved tumor infiltration of CD8 T cells and TCRP1A CD8 T cells compared control mice (figure 2C,D). In line with our previous results,30 the persistence of TCRP1A CD8 T cells after ACT was very limited (figure 2D). However, it was improved in mice treated with CTX and metformin, particularly when used in combination (figure 2D). Thus, the reduced tumor growth and improved survival observed in mice receiving ACT together with CTX and/or metformin, correlated with increased infiltration of tumor-specific CD8 T cells.
Given our in vitro observations that metformin improved CD8 T-cell fitness in hypoxia, we analyzed CD8 T-cell localization within the tumor. We observed that metformin alone or in combination with CTX increased CD8 T-cell infiltration in hypoxic tumor areas compared with control groups 4 days after ACT (figure 2E,F). Similar results were found when looking at tumor antigen-specific CD8 T cells, although in this case a significant difference was observed with metformin alone but not with the combination (figure 2G). Fourteen days after ACT, in mice treated with both CTX and metformin, CD8 T-cell infiltration in hypoxic tumor areas was increased compared with mice treated with CTX alone (online supplemental figure 4A) and the percentage of TCRP1A CD8 T cells out of pimonidazole-positive (hypoxic) cells was increased 10-fold compared with control group, although this effect was driven by a small subgroup of mice (online supplemental figure 4B). Accordingly, more CD8 TILs were localized at distance from blood vessels in metformin-treated mice (figure 2H and online supplemental figure 4C), while tumor blood vessel areas were similar among the different treatments (online supplemental figure 4D,E). We also wondered whether metformin was able to improve CD8 T-cell survival in hypoxic tumor areas. Metformin or CTX treatment alone did not significantly reduce the high TIL apoptosis observed in this model, among both pimonidazole-negative (normoxic) or pimonidazole-positive (hypoxic) cells (figure 2I,J). However, the combination of CTX and metformin significantly reduced apoptosis of tumor-infiltrating TCRP1A CD8 T cells among hypoxic cells 4 days after ACT compared with control group (figure 2I) and among both normoxic and hypoxic cells 14 days after ACT (figure 2J). When analyzing tumor-draining lymph nodes, we observed that metformin did not have an effect on the infiltration nor the apoptosis of TCRP1A CD8 T cells, further supporting our data that metformin has a direct effect on TILs infiltrating into hypoxic tumor areas (online supplemental figure 4F,G).
Since metformin was reported to influence T cell memory differentiation, we analyzed the expression of CD62L and KLRG1 in tumor infiltrating TCRP1A CD8 T cells. We observed an increase of CD44pos CD62Lneg KLRG1neg effector memory cells in hypoxic tumor areas in TiRP mice receiving metformin alone or CTX alone compared with control group; however, no difference was observed when comparing the combination of metformin and CTX versus CTX alone (online supplemental figure 4H,I). The frequency of CD44pos CD62Lpos KLRG1neg central memory cells or CD44pos CD62Lneg KLR1pos short-living effector cells in normoxic or hypoxic tumor areas were not significantly affected by the treatments (online supplemental figure 4H,I).
These results show that both metformin and CTX treatment increase CD8 T-cell recruitment to the tumor but metformin, in particular, favors their infiltration into hypoxic tumor areas. The combination of both treatments further improves these effects, leading to increased TIL persistence, infiltration and survival in tumor hypoxic areas at later time points after ACT, thus improving tumor response to immunotherapy.
Metformin does not affect tumor hypoxia in TiRP miceIt has been reported that metformin can indirectly improve TIL function by diminishing hypoxia, as a consequence of the reduced oxidative metabolism by tumor cells.16 17 However, when we analyzed TiRP tumor oxygen levels by electron paramagnetic resonance (EPR), we found no increased oxygenation by metformin treatment (figure 3A). Likewise, metformin did not reduce tumor hypoxia as measured with pimonidazole (figure 3B,C and online supplemental figure 5A,B).
 Figure 3
 Metformin does not affect tumor hypoxia in TiRP mice. (A) Measurements of tumor oxygenation by in vivo electron paramagnetic resonance (EPR) oximetry in TiRP mice that have received a single injection of cyclophosphamide (CTX, 100 mg/kg) or phosphate buffered saline (PBS) when the tumor size was around 260 mm3, followed on day 0 by adoptive cell transfer (ACT) of 10 million activated TCRP1A CD8 T cells 24 hours later and treated or not with metformin (0.5 mg/mL) in drinking water (A, PBS: n=5; PBS+metformin: n=6; CTX: n=8; CTX+metformin: n=6). (B, C) Tumor hypoxia quantification through pimonidazole staining in TiRP mice treated as in figure 2, by fluorescence-activated cell sorting (FACS) (B) or immunofluorescence (IF) (C), 14 days after ACT (B, PBS: n=25; PBS+metformin: n=29; CTX: n=27; CTX+metformin: n=19; C, PBS: n=15; PBS+metformin: n=17; CTX: n=14; CTX+metformin: n=19). (D) Tumor growth in TiRP mice that have received a single injection of CTX (100 mg/kg) followed the day after by ACT of TCRP1A CD8 T cells pretreated or not with metformin in vitro for 3 days before ACT (D, CTX: n=12; CTX+metformin pretreatment: n=11). (E, F) FACS analysis of TCRP1A CD8-T cell tumor infiltration (E) and apoptosis among pimonidazole-negative or pimonidazole-positive cells (F) in TiRP tumors treated as in (D), 4 days after ACT (E, CTX: n=10; CTX+metformin pretreatment: n=12; F, CTX: n=11; CTX+metformin: n=13). All data are mean±SEM. ns, not significant; *p<0.05; **p<0.01, calculated by two-way analysis of variance in (D), two-tailed unpaired t-test in (E, F).
These data suggest that metformin could improve TiRP tumor response to ACT by acting directly on CD8 T cells, which would be consistent with our in vitro data. To confirm this hypothesis, we pretreated activated TCRP1A CD8 T cells with metformin in vitro, before ACT in tumor-bearing mice that received no metformin. We found that pretreated T cells better reduced the growth of TiRP tumors (figure 3D). Moreover, pretreated T cells better infiltrated the tumors (figure 3E) and resisted apoptosis in hypoxic areas (figure 3F).
All these data clearly indicate that metformin directly ameliorates CD8 T-cell survival and function in hypoxia.
Metformin improves tumor response to ACT in different modelsWe also assessed whether metformin could improve the response of Lewis lung carcinoma cells (LLC) or lymphoma EL4 cells expressing the OVA peptide (LLC-OVA and EG7, respectively), to ACT of OT-1 CD8 T cells. As we observed in the TiRP mice, systemic administration of metformin alone did not significantly affect tumor growth in these models (figure 4A,B); however, metformin enabled tumor response to ACT in LLC-OVA-bearing mice, which were otherwise insensitive to OT-1 T-cell injection (figure 4A). Metformin also reduced tumor growth in the EG7 model after ACT (figure 4B). Again, metformin did not affect pimonidazole staining (online supplemental figure 6A), while it increased the percentage of hypoxic CD8 T cells in LLC-OVA tumors (online supplemental figure 6B,C). Moreover, pretreatment of OT-1 cells in vitro with metformin before ACT induced a small but significant reduction of tumor growth and increased CD8 T-cell infiltration in hypoxic regions of LLC-OVA tumors (figure 4C–E).
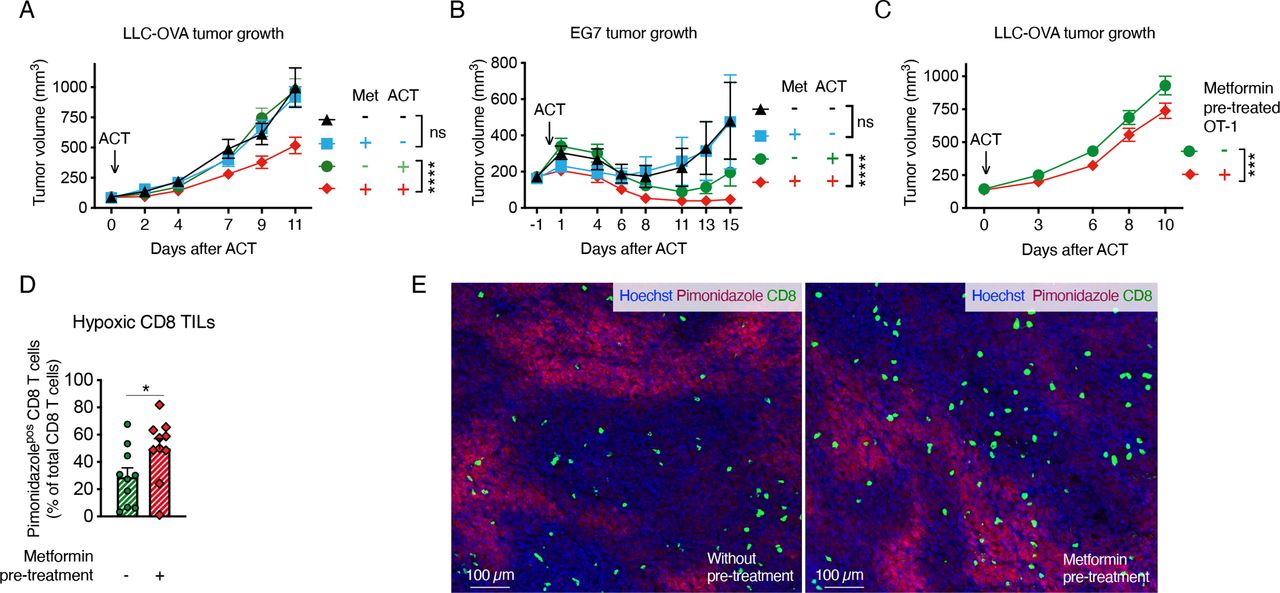 Figure 4
 Metformin improves tumor response to adoptive cell transfer (ACT) in different models. A, B Growth curve of Lewis lung carcinoma cells (LLC)-ovalbumin (OVA) (A) or EG7 (B) tumors treated or not with ACT of 2 million activated OT-1 CD8 T cells and metformin at 0.5 mg/mL in drinking water (A, pool of four independent experiments, no ACT: n=19; metformin no ACT: n=13; ACT: n=25; metformin and ACT: n=25; B, pool of two independent experiments, no ACT: n=12; metformin no ACT: n=11; ACT: n=13; metformin and ACT: n=13). (C) Growth curve of LLC-OVA tumors on ACT of 2 million activated OT-1 CD8-T cells, pretreated or not in vitro for 3 days with metformin (2 mM) (C, pool of four independent experiments, not-pretreated OT-1: n=38; metformin-pretreated OT-1: n=36). (D, E) Quantification (D) and representative images (E) of hypoxic CD8 T cells in end-stage LLC-OVA tumors treated as in (C) by immunofluorescence (IF) (D, n=10). All data are mean±SEM. ns, not significant; *p<0.05; ***p<0.001; ****p<0.0001, calculated by two-way analysis of variance in (A–C), two-tailed unpaired t-test in (D).
Metformin prevents hypoxia-induced apoptosis by reducing ROS productionMetformin is a direct inhibitor of the mitochondrial complex I, which is a possible site of production of reactive oxygen species (ROS) together with complex III.35 Due to a suboptimal functioning of the mitochondrial respiratory chain, electron leakage can occur in hypoxia leading to increased ROS production. High ROS production has been associated with T-cell dysfunction in chronic infections and tumors.36–39
We found that metformin reduced ROS accumulation in hypoxic CD8 T cells (figure 5A,B). Moreover, by treating CD8 T cells with different doses of a ROS precursor, tert-butyl hydroperoxide solution (Luperox), we confirmed that oxidative stress decreased CD8 T-cell survival and proliferation (figure 5C and online supplemental figure 7A). Consistently, the antioxidant reduced glutathione (GSH) protected CD8 T cells from hypoxia-induced apoptosis, to a similar extent as metformin (figure 5D). Likewise, N-acetyl-L-cysteine, a cell permeable antioxidant, diminished ROS and reduced apoptosis in normoxic and hypoxic TCRP1A CD8 T cells (online supplemental figure 7B,C). We also observed that hypoxia induced oxidative DNA damage, which was prevented by metformin (figure 5E).
 Figure 5
 Metformin prevents hypoxia-induced apoptosis by reducing reactive oxygen species (ROS) production. (A, B) Fluorescence-activated cell sorting (FACS) quantification of cellular ROS (A) and mitochondrial ROS (B) in activated TCRP1A CD8 T cells incubated in normoxia (21% O2) or hypoxia (1% O2) in presence or not of metformin (2 mM) at 72 hours; data are expressed as fold change compared with control. (C) FACS quantification of early (Annexin Vpos and 7-aminoactinomycin D (7-AAD)neg) and late apoptosis (Annexin Vpos and 7-AADpos) in activated TCRP1A treated with different doses of tert-butyl hydroperoxide for 48 hours; data are expressed as fold change compared with control. (D) FACS quantification of early (Annexin Vpos and 7-AADneg) and late apoptosis (Annexin Vpos and 7-AADpos) in activated TCRP1A incubated in hypoxia (1% O2) in presence or not of metformin (2 mM) and/or glutathione (GSH) (3.2 mM). (E) Immunofluorescence (IF) quantification of 8-OHdG positive cells among TCRP1A CD8 T cells treated as in A, B for 48 hours by IF; data are expressed as fold change compared with normoxia vehicle. (F) FACS quantification of early (Annexin Vpos and 7-AADneg) and late apoptosis (Annexin Vpos and 7-AADpos) in activated TCRP1A incubated in normoxia (21% O2) or hypoxia (1% O2) in presence or not of IACS-010759 (100 nM); data are expressed as fold change compared with normoxic control. (A, B, E) is a pool of three independent experiments; (C) is a pool of five independent experiments (100 µM dose was assessed in three independent experiments); (D) is a pool of six independent experiments; (F) is a pool of four independent experiments. All the conditions are assessed in triplicate in each individual experiment. MFI, median fluorescence intensity. All data are mean±SEM. ns, not significant; *p<0.05; **p<0.01; ***p<0.001; ****p<0.0001, calculated by two-tailed unpaired t-test.
留言 (0)