Materials
Agarose, Micro BCA protein assay kit, Ni-NTA resin, and PageRuler prestained protein ladder were purchased from ThermoFisher Scientific (Rockford, IL, USA). Ammonium sulfate, chloramphenicol, complete Freund’s adjuvant, Coomassie brilliant blue (CBB) R-250, 3,5-dinitrosalicylic acid (DNS), ethylenediamine tetraacetic acid (EDTA), d-galactose, incomplete Freund’s adjuvant, isopropyl β-d-1-thiogalactopyranoside (IPTG), kanamycin, naphthoresorcinol, sodium dodecyl sulfate (SDS), and tris(2-carboxyethyl)phosphine (TCEP) were obtained from Sigma-Aldrich (St. Louis, MO, USA). Restriction enzymes and T4 ligase were obtained from Roche (Basel, Switzerland). The pET-30a vector for expressing C-terminal 6× His-tagged protein and Immobilon-P membrane were purchased from EMD Millipore Corporation (Temecula, CA, USA). A standard NAOS mixture (NA2–NA18) was provided by Dr. Sang-Hyeon Lee (Lee et al. 2008). An AOS mixture was prepared by mild acid hydrolysis of 1%[w/v] agarose as previously described (Kwon et al. 2020). The standards (NA2, NA4, and NA6) were obtained from Carbosynth Ltd. (Berkshire, UK). E. coli BL21 (DE3) pLysS was obtained from Novagen (Madison, WI, USA).
Expression of recombinant GH16 β-agarases using the E. coli expression system
Four GH16 β-agarase genes (encoding GH16A [GenBank accession no. WP_151030829.1], GH16B [GenBank accession no. WP_151030830.1], GH16C [GenBank accession no. QEY14919.1], and GH16D [GenBank accession no. WP_151030839.1]) in the genomic DNA of Cellvibrio sp. KY-GH-1 strain were amplified using polymerase chain reaction (PCR) with the following primers: NdeI-forward primers (5′-GCGGCATATG-AAAAAAATCACTTCATGTA-3′ for GH16B, 5′-GCGGCATATGCAGTTAATAGATAATAAAGAG-3′ for GH16C, 5′-GCGGCATATGCGTATTCGCTCACCTTG- 3′ for GH16D, and 5′-CGCATATGGCCGATTGGG-ATTCAGTTCC-3′ for GH16B without a signal sequence); BamHI-forward primer (5′-CGGGATCCATG-AAAAAGCATATTTCATGCTG-3′ for GH16A); XhoI-reverse primers (5′-CTAACTCGAGGGGTATCAA-TTCAAACTTG-3′ for GH16B and GH16B without a signal sequence, 5′-CGCGCTCGAGGGGTACTAATT-CAAATTTATCC-3′ for GH16C, and 5′-CGCGCTCGAGATTTACTGGCACAAACTCAATG-3′ for GH16D); and HindIII-reverse primer (5′-CGAAGCTTGAGTGAGCCAACTCGAGTAA-3′ for GH16A). The PCR products were digested with appropriate restriction enzyme sets before being ligated into the pET-30a vector with T4 ligase. The recombinant pET-30a plasmids were transformed into E. coli BL21 (DE3) pLysS. After overnight incubation at 30 °C on Luria broth (LB) plates supplemented with 50 µg/mL chloramphenicol and 25 µg/mL kanamycin, the transformants were selected.
The expression of each recombinant β-agarase in the transformant was induced as previously described (Jang et al. 2021) with minor modifications. Briefly, each transformant was cultured at 25 °C with shaking in LB containing 50 µg/mL chloramphenicol and 25 µg/mL kanamycin. When optical density at 600 nm (OD600) of the culture reached 0.5–0.6, 0.5 mM IPTG was added to induce protein expression. Then, the culture was incubated at 20 °C for 20 h.
Zymogram plate assay for β-agarase activity determination
Escherichia coli BL21 (DE3) pLysS transformants harboring the recombinant pET-30a plasmid containing GH16A, GH16B, GH16C, or GH16D were spotted onto LB agarose plates (1.5%[w/v] agarose, 50 µg/mL chloramphenicol, 25 µg/mL kanamycin, and 0.1 mM IPTG) and then incubated for 3 days at 37 °C. The plates were stained with Lugol’s iodine solution at 25 °C.
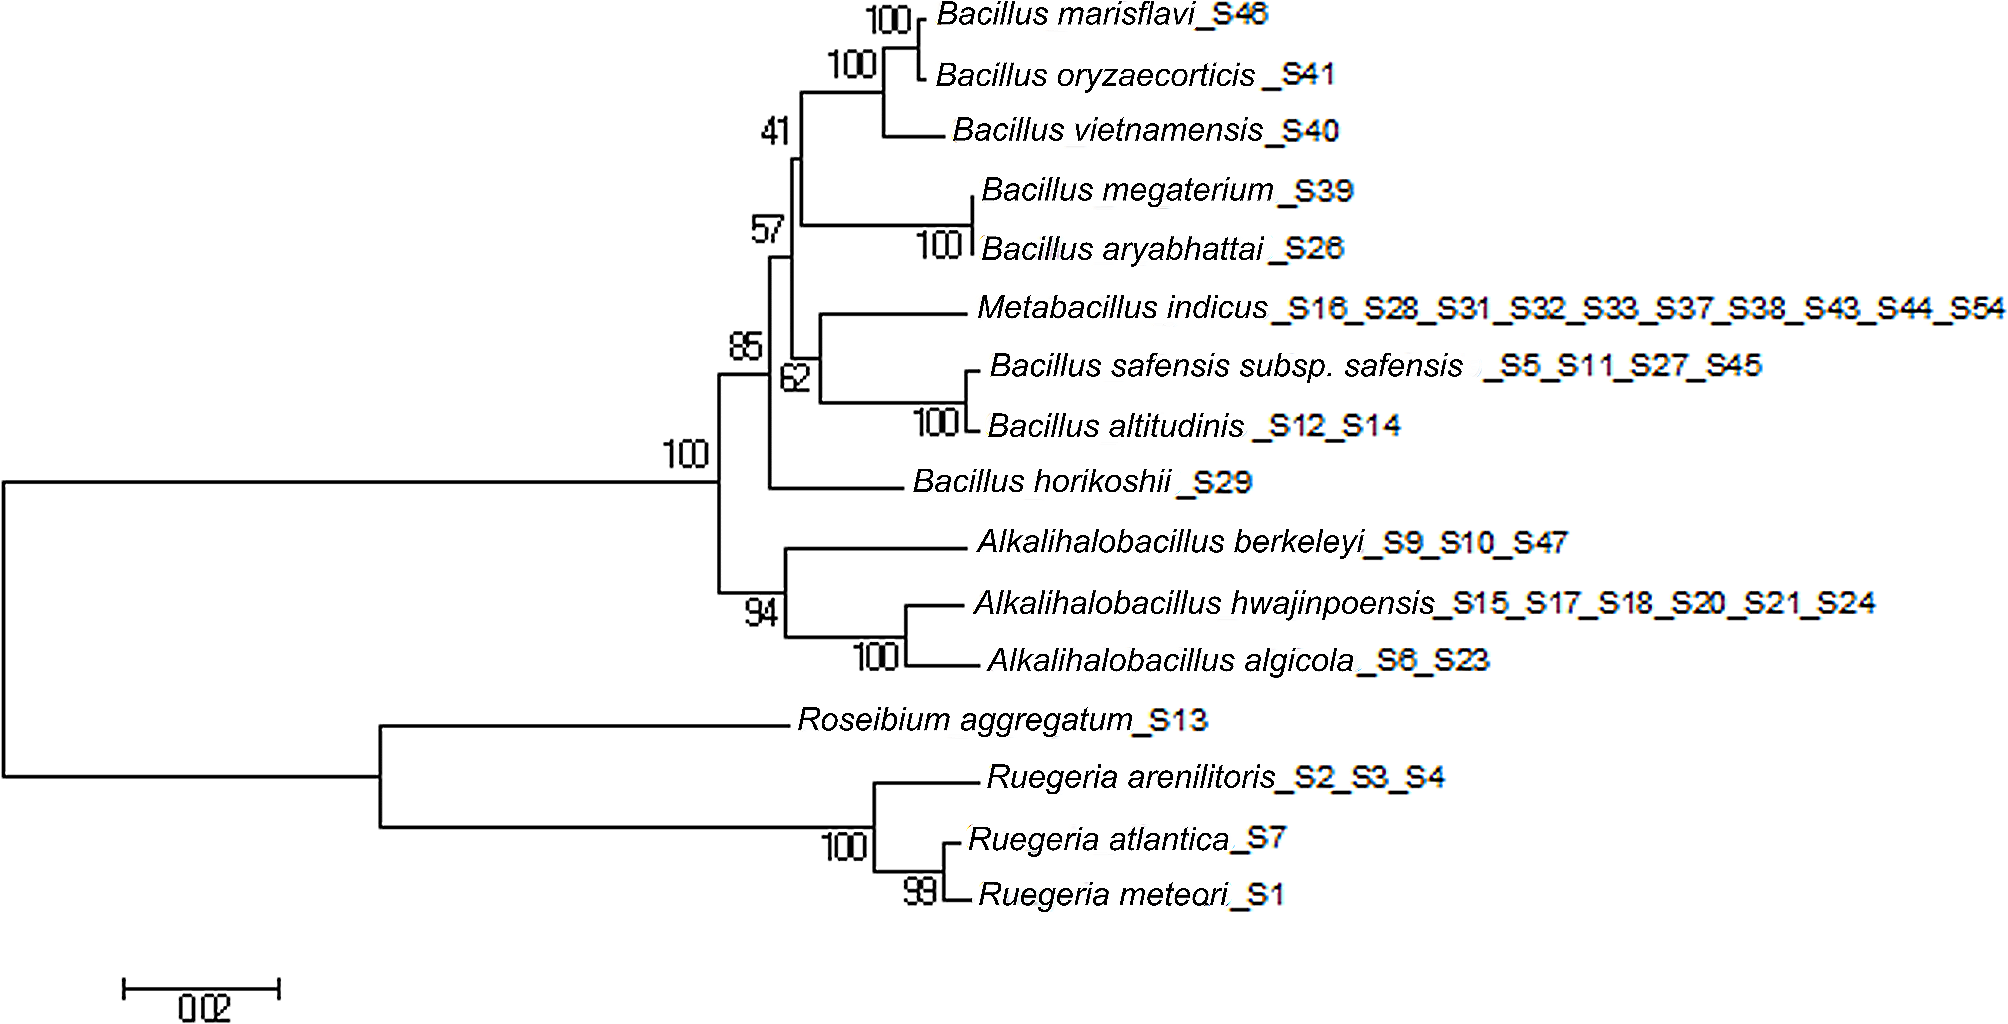
Sequence analysis and construction of phylogenetic tree
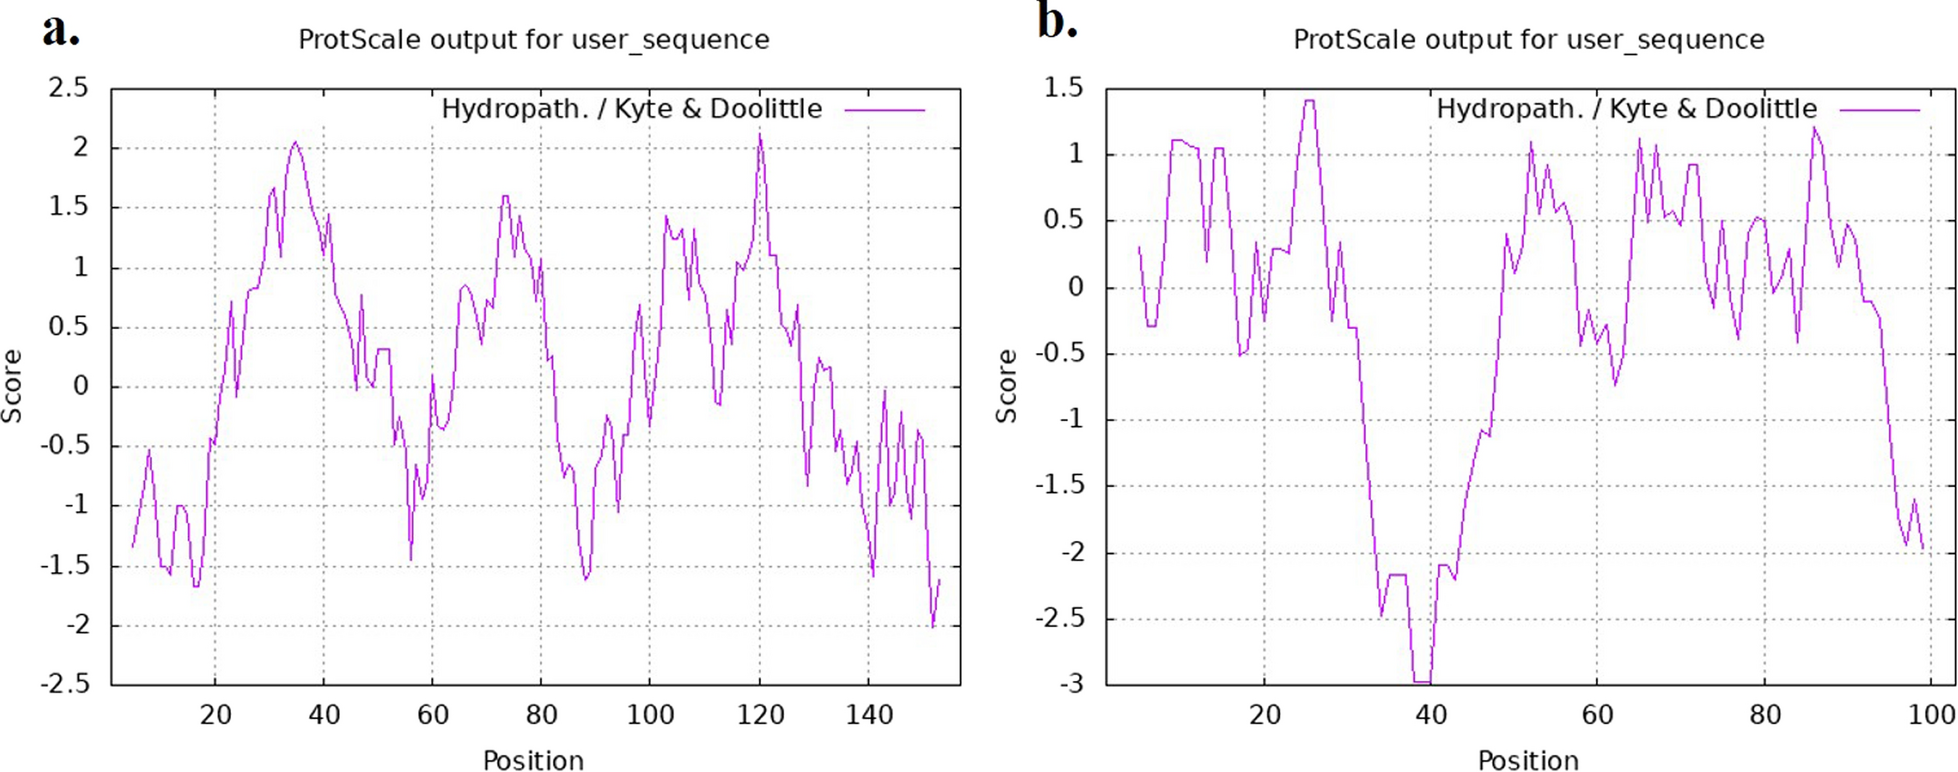
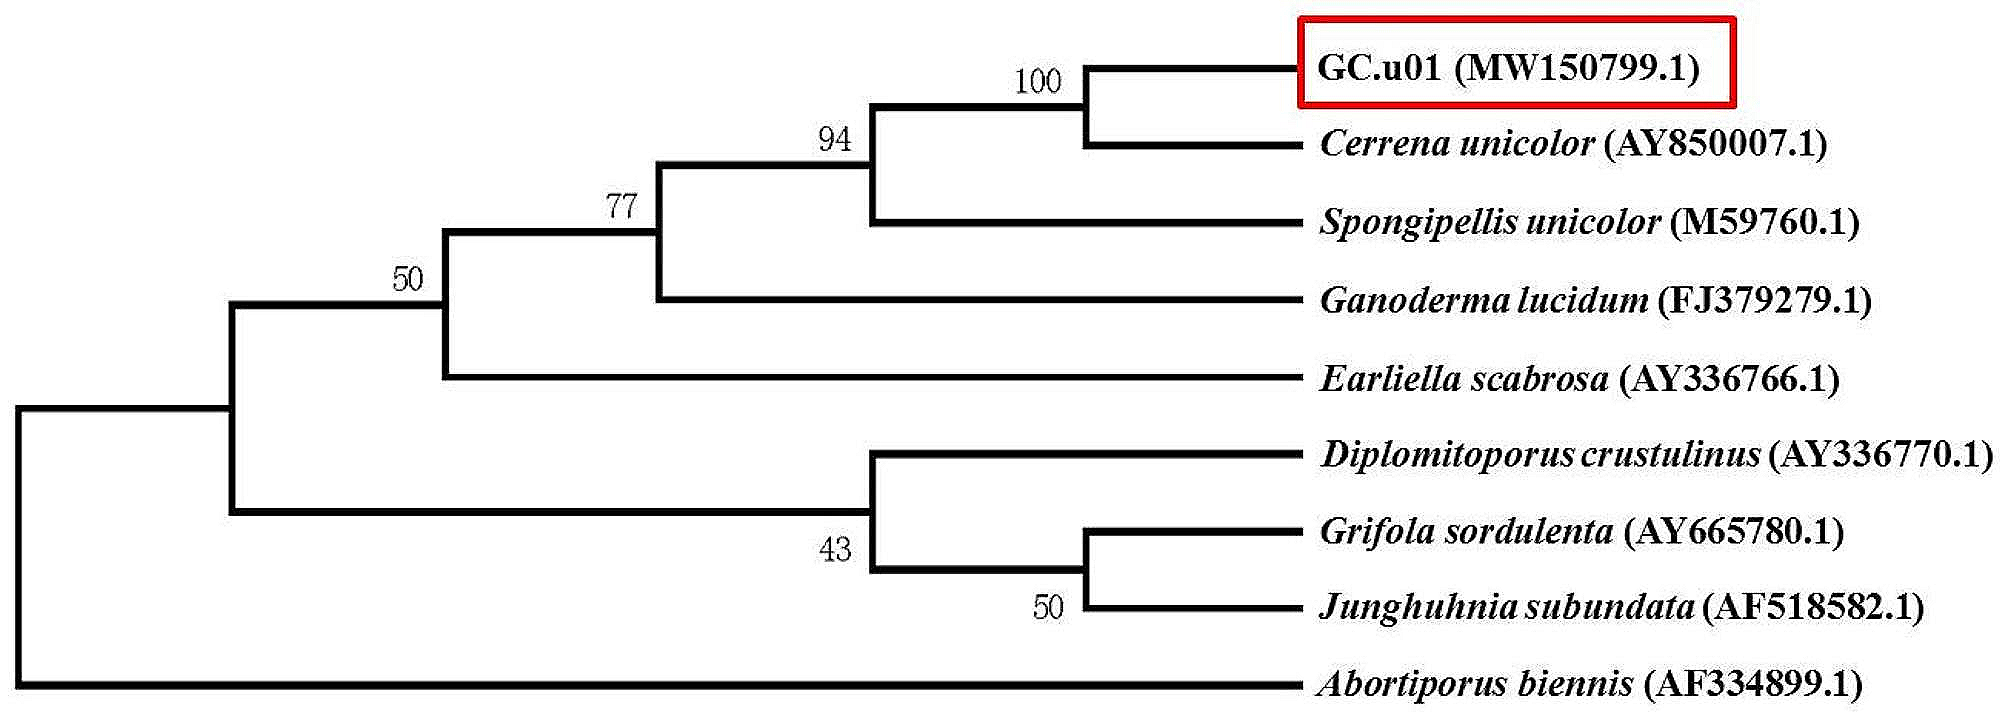
The aa sequences of GH16 family β-agarases were obtained for analyzing their similarity via a BLAST search of the NCBI database (http://www.ncbi.nlm.nih.gov). Multiple alignment of the aa sequences was performed using Clustal X program (Larkin et al. 2007), and conserved residues were highlighted using Clustal X color scheme, as previously described (Kwon et al. 2020). Using UPGMA, an unrooted phylogenetic tree of GH16 family members was constructed based on aa sequence similarities (Sneath and Sokal 1973). SignalP version 5.0 was used to predict the location of the N-terminal signal sequence of GH16B β-agarase (Almagro Armenteros et al. 2019).
Cell lysate preparation, protein quantitation, sodium dodecyl sulfate–polyacrylamide gel electrophoresis (SDS–PAGE), and western blot analysis
To identify and localize the recombinant enzyme proteins produced by the transformants, cell cultures were centrifuged at 8000 rpm for 20 min, and culture supernatants (CS) and cell pellets were separated. Cell pellets were suspended in 40 mM Tris-HCl buffer (pH 8.0), sonicated using 50 short bursts of 2 s each, extracted at 4 °C for 30 min, and fractionated into three intracellular fractions (total, soluble, and pellet [insoluble inclusion]), as previously described (Jun et al. 1996). After quantifying protein concentrations of cell lysate using Micro BCA protein assay kit, the same portion of each fraction was subjected to 8% SDS–PAGE. By staining the gels with CBB R-250, recombinant enzymes were visualized. For western blot analysis, equivalent amounts of E. coli cell lysates and culture supernatants were resolved by SDS–PAGE and then electrotransferred onto Immobilon-P membranes as previously described (Lee et al. 2017a). ECL Prime Western Blotting Kit (Amersham, Arlington Heights, IL, USA) was used to detect the proteins.
Purification of GH16B β-agarase
The supernatant of transformed E. coli cultures (300 mL), obtained following centrifugation (8000 rpm for 20 min, was mixed with ammonium sulfate (30% saturation), and the mixture was stirred overnight at 4 °C to precipitate the His-tagged GH16B β-agarase. The precipitate was collected via centrifugation (20,000 rpm for 20 min), dissolved in 10 mL of 10 mM Tris-HCl buffer (pH 7.5), and dialyzed at 4 °C for 3 h. The dialyzed recombinant protein was purified via immobilized metal affinity chromatography with Ni-NTA resin. The purified enzyme was lyophilized to dryness.
Production of a polyclonal antibody against recombinant GH16B β-agarase
To prepare mouse polyclonal antibody specific for GH16B β-agarase, purified recombinant GH16B β-agarase solution (120 µg/300 µL of phosphate-buffered saline) was mixed with an equal volume of complete Freund’s adjuvant, and the mixture (20 µg/100 µL) was intraperitoneally injected into mice. A purified GH16B β-agarase solution was mixed with an equal volume of incomplete Freund’s adjuvant and injected intraperitoneally into the mice every 10 day for secondary, tertiary, and quaternary immunization. Five days after quaternary immunization, the mice were bled. C57BL/6J male mice (6-weeks-old) were purchased from the JA Bio (Suwon-si, Gyeonggi-do, Korea) and maintained at the Animal Resources Center in Kyungpook National University (Daegu, Korea) under specific pathogen-free conditions.
Agarase activity assay
GH16B β-agarase activity was measured as previously described (Miller 1959). One hundred microliters of the enzyme solution was mixed with an equal volume of 0.8%[w/v] melted agarose in an appropriate buffer. The content of reducing sugars in the reaction mixture was determined colorimetrically using DNS reagent after 30 min of incubation at 50 °C. The amount of enzyme that produced reducing power equivalent to 1 µmol of D-Gal per min was defined as one unit of enzymatic activity.
The effect of temperature on the enzymatic activity was measured using 50 mM Mcllvaine buffer buffer (pH 7.0) for 30 min over a temperature range of 25–70 °C. The effect of pH on the enzymatic activity was measured using 50 mM McIlvaine (pH 4.0–7.0) and 50 mM Tris–HCl (pH 7.0–10.0) buffer. For temperature and pH stability assays, aliquots of enzyme were preincubated over a range of temperatures and pH for indicated time, and the relative enzymatic activity was measured. The kinetic parameters of GH16B β-agarase were determined using a known amount of the enzyme and substrate solution (1–5 mg/mL agarose in 50 mM Mcllvaine buffer, pH 7.0). The Lineweaver–Burk equation, generated via GraphPad Prism 8 statistical package (GraphPad Software Inc, Boston, MA, USA), was used to calculate Km and Vmax values. Effects of metal ions (CaCl2, CuSO4, KCl, MgCl2, MnCl2, MnSO4, and NaCl), reducing agent (TCEP), and a chelator (EDTA) on the enzymatic activity were examined by adding these reagents at indicated concentrations to the standard assay mixture.
Thin-layer chromatography (TLC)
TLC was performed for GH16B β-agarase-catalyzed hydrolysates of agarose, NAOS, or AOS on Silica Gel 60 aluminum plates coated with fluorescent indicator F254 (Merck, Darmstadt, Germany), which were developed with n-butanol-ethanol-H2O (3:2:2[v/v]). To detect oligosaccharides, a visualization solution (0.2%[w/v] naphthoresorcinol, 10%[v/v] H2SO4, ethanol) was sprayed on the plates, followed by heating at 80 °C. L-AHG (Jang et al. 2021), the NAOS mixture (NA2–NA18) (Lee et al. 2008), and commercial NA2, NA4, and NA6 were used as standards.
Analyses of the enzymatic hydrolysates using matrix-assisted laser desorption/ionization time-of-flight/time-of-flight mass spectrometry (MALDI–TOF/TOF MS)
To analyze the hydrolytic products of agarose or AOS produced via enzymatic reaction, MALDI–TOF/TOF MS analysis was performed in the positive ion reflectron mode using Autoflex max (Bruker Daltonics, Billerica, Massachusetts, USA), as described elsewhere (Lee et al. 2014). The enzymatic reaction mixture was spotted onto a stainless steel target plate, followed by the addition of 0.5 µL of 50% acetonitrile in which excessive 2,5-dihydroxybenzoic acid was dissolved, and air-dried. Each acquired spectrum represents the combined signal from 500 laser shots at four random locations on the spot for a total of 2000 laser shots using a 2 kHz laser. The laser attenuator offset and range were set at 18% and 40%, respectively, with the laser focus set at 36%. Mass spectra were recorded over an m/z range of 500–1500. To obtain high-resolution data, the detector sampling rate was set at a maximum of 2.50 giga samples/s, and the detector gain was set at 6.2×. flexAnalysis software (version 3.4; Bruker Daltonics) was used to process the raw MS data.
Purification of NA4 and NA6 via size-exclusion column chromatography
To purify NA4 and NA6 from the hydrolytic products of agarose, 9%[w/v] melted agarose (20 mL) was treated with GH16B β-agarase under optimal conditions (1 mM MnCl2 and 10 mM TCEP, 50 mM Mcllvaine buffer, pH 7.0, 50 °C) with continuous magnetic stirring, followed by freeze–drying. The dried samples were dissolved in deionized (DI) water and fractionated via size-exclusion chromatography using Sephadex G-15 column (I.D. 1.3 × 120 cm). Two milliliters of fractions eluting in DI water were collected. TLC was used to identify fractions containing NA4 and NA6, which were then collected and lyophilized to dryness.
Statistical analyses
Unless otherwise specified, the data represent at least three independent experiments and are expressed as the mean ± standard deviation (n ≤ 3). Statistical analyses were performed using Student’s t-test to compare the data between two groups, whereas one-way analysis of variance followed by Dunnett’s multiple comparison test was used to compare three or more groups. P values of < 0.05 were considered to indicate statistical significance. Statistical analysis was conducted using SPSS Statistics version 23 (IBM, Armonk, NY, USA).


留言 (0)