
記住我


Each year, approximately, 15 million infants are born prematurely (<37 week gestation), and nearly, 1 million infants die due to complications of preterm birth.[1] The use of antenatal corticosteroids (ACS) has been proven to be one of the most effective interventions to reduce mortality and major morbidities of premature infants, especially for those at gestational age (GA) < 32 weeks.[2] So far, ACSs have been recommended by several guidelines to be used for pregnant women at risk of preterm delivery.[3,4]
Use rates have been reported to be 82% to 93% for infants born at <32 weeks in developed countries.[5–8] In China, much lower use rates of ACS have been reported, with 56% in 2013 to 2014 and 64% in 2015 to 2016 for infants born at <32 weeks.[9,10] With rapid development of perinatal-neonatal medicine in China in recent years, there is a lack of concurrent data from large multicenter cohorts to show the current practice of ACS.
This study used data from the Chinese Neonatal Network (CHNN) to describe ACS use among infants with GA at 24 to 31 weeks in 57 Chinese neonatal intensive care units (NICUs) and to explore the perinatal factors associated with ACS use.
Methods Ethical approvalThis study was approved by the ethics review board of Children's Hospital of Fudan University (No. 2018–296), which was recognized by all participating hospitals. The Institutional Review Board waived the need for informed consent to use anonymized and retrospectively analyzed data.
SettingsThis was a cross-sectional study based on prospectively collected data from the CHNN. The CHNN established a standardized national clinical database of preterm infants from January 1st 2019, to monitor outcomes and care practices in NICUs throughout China. A total of 57 hospitals from 25 provinces throughout China collected whole-year data using the CHNN database in 2019. These hospitals were tertiary referral hospitals with recognized expertise in caring for high-risk neonates [Supplementary Table 1, https://links.lww.com/CM9/B158]. Forty-three hospitals were perinatal centers with birthing facilities, and 14 hospitals were free-standing children's hospitals that only admitted outborn infants.
Study populationInfants at GA of 24+0 to 31+6 weeks and admitted to 57 CHNN NICUs within 7 days after birth from January 1st, 2019 to December 30th, 2019 were included in this study. Infants with major congenital malformation and with unknown ACS status were excluded. Infants who were still birth, who died in the delivery room, and who were transferred to non-participating hospitals within 24 h after birth were not captured by the database. Readmissions and transfers between participating hospitals were tracked as data from the same infants. Infants were followed until NICU discharge/transfer or death.
Data collection and data quality controlTrained abstractors collected the data from patient charts in all CHNN hospitals using standard definition of variables. An electronic and customized data entry program with systematic data check was used. Periodic data audits and data correction in each year were conducted to ensure data quality.[11,12]
DefinitionsThe ACS administrations was defined as at least one dose of dexamethasone and betamethasone given before delivery. A single complete course of ACS was defined as two doses of betamethasone or four doses of dexamethasone given prior to delivery. A single partial course was defined as administration of a single dose of betamethasone or <4 doses of dexamethasone prior to delivery. Repeat course was defined as administration of more than one complete course of ACS. Time of ACS use was defined as the time interval between the first dose of ACS and delivery. GA was determined using the hierarchy of best obstetric estimate based on prenatal ultrasound, menstrual history, obstetric examination, or all three. If the obstetric estimate was not available or was different from the postnatal estimate of gestation by >2 weeks, the GA was estimated using the Ballard Score.[14] Small for gestational age was defined as birth weight and length below the 10th percentile for GA.[15] Prenatal visit refers to at least one obstetric care during pregnancy.
Statistical analysisDescriptive analysis was applied to describe the usage of ACS including timing and course of usage in each GA. Maternal and infant information was compared between ACS and no-ACS groups using Chi-squared tests and Whitney U tests. Two multiple logistic regression models were applied to examine perinatal factors associated with ACS use. In model 1, perinatal factors with P < 0.2 in univariate analysis were included in the multivariate model. In model 2, two levels of adjustments were applied with hospital-level cluster effect included using a generalized estimating equation.
To compare different practices among hospitals, rates of ACS use in inborn infants were compared among 43 perinatal centers. In order to investigate site variation of ACS usage in CHNN participating sites, the expected usage rate of ACS for each patient was estimated using the multiple logistic regression model 1 mentioned above. The expected usage rates of ACS were then summed within each site to obtain the aggregated expected number of ACS usage for each site. Then, the indirectly standardized ratio for each site was calculated as the observed amount of ACS usage divided by the expected number of ACS usage. The indirectly standardized ratios for different sites were described in the funnel plot with 95% and 99.8% Poisson limits.[16,17] All the analysis was performed in SAS, version 9.4 (SAS Institute, Cary, North Carolina, USA) and R 3.6.1. A two-sided P value of 0.05 was used to determine the statistical significance.
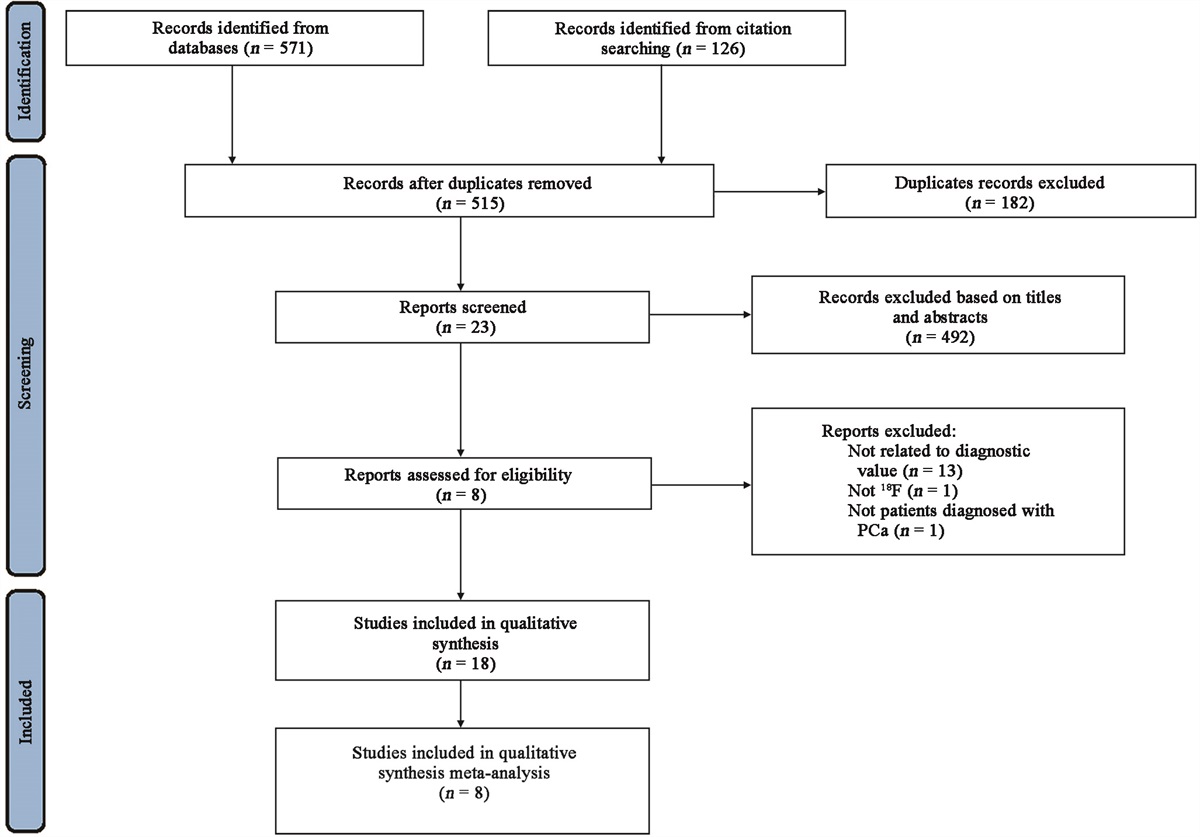
ResultsA total of 8459 infants at GA of 24 to 31 weeks were admitted to CHNN hospitals within 7 days after birth. Overall, 68 infants were excluded because of major congenital anomalies, and 563 infants were excluded for unknown ACS data. The remaining 7828 infants comprised the study population [Figure 1].
 Figure 1:
 Flow diagram of study population of this cross-sectional study which enrolled all infants born at 24+0–31+6 weeks.
Overall rate and timing of ACS useThe rates of ACS use are shown in Table 1. Among the 6103 (78.0%) infants receiving ACS, the rate of ACS use significantly increased with increasing GA, from 68.3% (177/259) at 24 to 25 weeks, 74.9% (746/995) at 26 to 27 weeks to 78.8% (5180/6574) at 28 to 31 weeks (P value for trend < 0.01). Of all infants exposed to ACS, 49.1% (2999/6103) received one single complete course of ACS, 33.4% (2039/6103) of infants received a partial course of ACS, and 12.6% (772/6103) received repeated courses of ACS.
Table 1 - Use of ACS in infants at 24 to 31 weeks’ gestation in CHNN. GA (weeks) Use of ACS 24 25 26 27 28 29 30 31 Total Total number of infants 82 177 339 656 1155 1459 1822 2138 7828 Any ACS 53 (64.6) 124 (70.1) 245 (72.3) 501 (76.4) 912 (79.0) 1148 (78.7) 1429 (78.4) 1691 (79.1) 6103 (78.0) Course of ACS Single complete course 28 (52.8) 65 (52.4) 138 (56.3) 272 (54.3) 414 (45.4) 570 (49.7) 695 (48.6) 817 (48.3) 2999 (49.1) Single partial course 20 (37.7) 51 (41.1) 76 (31.0) 144 (28.7) 342 (37.5) 384 (33.4) 462 (32.3) 560 (33.1) 2039 (33.4) Repeat courses 4 (7.5) 6 (4.8) 21 (8.6) 47 (9.4) 123 (13.5) 142 (12.4) 193 (13.5) 236 (14.0) 772 (12.6) Unknown courses 1 (1.9) 2 (1.6) 10 (4.1) 38 (7.6) 33 (3.6) 52 (4.5) 79 (5.5) 78 (4.6) 293 (4.8)Data are shown as n, n (%). ACS: Antenatal corticosteroids; CHNN: Chinese Neonatal Network; GA: Gestational age.
The timing of ACS administration is shown in Table 2. Among infants with ACS use and known timing of administration, 2117 of 4889 (43.3%) infants were born <48 h after the first dose of ACS, 1639 of 4889 (33.5%) infants were born between 48 h and 7 days after the first dose of ACS, and 1133 of 4889 (23.2%) infants were born after 7 days of the first dose.
Table 2 - Timing of ACS use in infants at 24 to 31 weeks’ gestation in CHNN. GA (weeks) Use of ACS 24 25 26 27 28 29 30 31 Total Any ACS 53 124 245 501 912 1148 1429 1691 6103 ACS administration-to-birth interval <48 h 19 (35.8) 53 (42.7) 90 (36.7) 153 (30.5) 329 (36.1) 380 (33.1) 505 (35.3) 588 (34.8) 2117 (34.7) 48 h–7 days 20 (37.7) 34 (27.4) 74 (30.2) 159 (31.7) 272 (29.8) 318 (27.7) 363 (25.4) 399 (23.6) 1639 (26.9) >7 days 8 (15.1) 26 (21.0) 37 (15.1) 86 (17.2) 134 (14.7) 220 (19.2) 269 (18.8) 353 (20.9) 1133 (18.6) Unknown 6 (11.3) 11 (8.9) 44 (18.0) 103 (20.6) 177 (19.4) 230 (20.0) 292 (20.4) 351 (20.8) 1214 (19.9)Data are shown as N or n (%). ACS: Antenatal corticosteroids; CHNN: Chinese Neonatal Network; GA: Gestational age.
Infant and maternal characteristics grouped by ACS exposure are described in Table 3. Compared with infants of the ACS group, the no ACS group had a smaller GA(Q1, Q3) (29.86 [28.14, 31.00] vs. 30.00 [28.57, 31.00] weeks, Z = −0.40, P < 0.01), fewer multiple births (27.8% [480/1725] vs. 30.8% [1879/6103], χ2 = 5.60, P = 0.02), lower rate of born in hospital (inborn) (63.5% [1095/1725] vs. 79.1% [4829/6103], χ2 = 178.87, P < 0.01), and higher rates of Apgar score ≤3 at 1 min (10.0% [167/1674] vs. 4.6% [277/6068], χ2 = 71.10, P < 0.01) and 5 min (2.8% [45/1586] vs. 0.6% [36/5973], χ2 = 58.49, P < 0.01). For maternal characteristics, maternal age (31.0 [28.0, 34.0] vs. 30.4 [27.2, 34.0] years, Z = −4.27, P < 0.01), rates of maternal hypertension (20.4% [1240/6081] vs. 15.9% [271/1708], χ2 = 17.46, P < 0.01), maternal diabetes (18.6% [1130/6078] vs. 15.1% [257/1705], χ2 = 11.25, P < 0.01), premature rupture of membranes (PROM) (65.0% [3873/5962] vs. 51.2% [831/1622], χ2 = 102.03, P < 0.01), and cesarean delivery (58.3% [3551/6092] vs. 50.4% [866/1717], χ2 = 59.31, P < 0.01) were statistically significantly different between the ACS group and no ACS group.
Table 3 - Infant and maternal characteristics by ACS use among infants at 24 to 31 weeks’ gestation in CHNN. Characteristics Total (N = 7828) No ACS (N = 1725) Any ACS (N = 6103) Z/χ 2 values P values Infant characteristics GA, weeks 30.0 (28.5, 31.0) 29.8 (28.1, 31.0) 30 (28.5, 31.0) −0.40∗ <0.01 24–25 259/7828 (3.3) 82/1725 (4.8) 177/6103 (2.9) 21.78† <0.01 26–27 995/7828 (12.7) 249/1725 (14.4) 746/6103 (12.2) 28–29 2614/7828 (33.4) 554/1725 (32.1) 2060/6103 (33.8) 30, 31 3960/7828 (50.6) 840/1725 (48.7) 3120/6103 (51.1) Birth weight, g 1320.0 (1100.0, 1550.0) 1310.0 (1095.0, 1560.0) 1320.0 (1100.0, 1550.0) −0.24 0.81 Male 4374/7819 (55.9) 974/1722 (56.6) 3400/6097 (55.8) 0.35 0.56 SGA 545/7828 (7.0) 105/1725 (6.1) 440/6103 (7.2) 2.62 0.11 Multiple birth 2359/7828 (30.1) 480/1725 (27.8) 1879/6103 (30.8) 5.60 0.02 Inborn 5924/7828 (75.7) 1095/1725 (63.5) 4829/6103 (79.1) 178.87 <0.01 Apgar score ≤3 at 1 min 444/7742 (5.7) 167/1674 (10.0) 277/6068 (4.6) 71.10 <0.01 Apgar score ≤3 at 5 min 81/7573 (1.1) 45/1586 (2.8) 36/5973 (0.6) 58.49 <0.01 Maternal characteristics Maternal age, years 31.0 (28.0, 34.0) 30.4 (27.2, 34.0) 31.0 (28.0, 34.0) −4.27∗ <0.01 <20 78/7787 (1.0) 43/1717 (2.5) 35/6070 (0.6) 53.24† <0.01 20–29 3022/7787 (38.8) 682/1717 (39.7) 2340/6070 (38.6) 30–40 4410/7787 (56.6) 940/1717 (54.7) 3470/6070 (57.2) >40 277/7787 (3.6) 52/1717 (3.0) 225/6070 (3.7) Primigravida 4017/7781 (51.6) 852/1713 (49.7) 3165/6068 (52.2) 3.14 0.08 ≥1 prenatal visit 7636/7719 (98.9) 1650/1673 (98.6) 5986/6046 (99.0) 1.80 0.17 Maternal hypertension 1511/7789 (19.4) 271/1708 (15.9) 1240/6081 (20.4) 17.46 <0.01 Maternal diabetes 1387/7783 (17.8) 257/1705 (15.1) 1130/6078 (18.6) 11.25 <0.01 PROM 4704/7584 (62.0) 831/1622 (51.2) 3873/5962 (65.0) 102.03 <0.01 Antenatal antibiotics 3462/7134 (48.5) 384/1546 (24.8) 3078/5588 (55.1) 443.45 <0.01 Cesarean delivery 4417/7809 (56.6) 866/1717 (50.4) 3551/6092 (58.3) 59.31 <0.01Data are presented as median (P25, P75) or n/N (%).
∗Continuous variable.
†Category variable.ACS: Antenatal corticosteroids; CHNN: Chinese Neonatal Network; GA: Gestational age; PROM: Premature rupture of membranes; SGA: Small for gestational age.
Infant and maternal characteristics grouped by different courses of ACS use are described in Supplementary Table 2, https://links.lww.com/CM9/B158. Compared with infants of the partial course of ACS group, the complete course of ACS group had a higher rate of inborn (82.3% [3105/3771] vs. 80.1% [1633/2039], χ2 = 252.23, P < 0.01), and a higher rate of Apgar score ≤3 at 5 min (0.7% [27/3771] vs. 0.4% [7/2039], χ2 = 59.36, P < 0.01). For maternal characteristics, maternal age (31.00 [28.54, 34.79] vs. 30.08 [27.56, 33.96] years, χ2 = 58.00, P < 0.01), rates of maternal hypertension (22.3% [838/3762] vs. 16.7% [340/2034], χ2 = 43.01, P < 0.01), maternal diabetes (18.5% [695/3762] vs. 19.5% [395/2030], χ2 = 13.41, P < 0.01), PROM (66.1% [2450/3707] vs. 64.3% [1287/2003], χ2 = 110.52, P < 0.01), antenatal antibiotics (59.0% [2078/3525] vs. 50.0% [931/1861], χ2 = 501.62, P < 0.01), and cesarean delivery (61.2% [2302/3761] vs. 53.4% [1089/2038], χ2 = 67.37, P < 0.01) were significantly different between the complete course of ACS group and partial course of ACS group.
Multivariate regression showed that infants at 24 to 25 weeks (adjusted odds ratio [aOR]: 0.58, 95% CI: 0.44–0.78) and 26 to 27 weeks (aOR: 0.80, 95% CI: 0.67–0.96) were less likely to receive ACS, compared with infants at 30 to 31 weeks. Inborn (aOR: 1.76, 95% CI: 1.55–2.01), maternal hypertension (aOR: 1.41, 95% CI: 1.18–1.68), primigravida (aOR: 1.15, 95% CI: 1.02–1.29), PROM (aOR: 1.69, 95% CI: 1.49–1.90), and cesarean section (aOR: 1.16, 95% CI: 1.02–1.31) were associated with higher likelihood to receive ACS. The association remained similar after considering the cluster effect in centers [Table 4]. Perinatal factors associated with different courses of ACS use among infants at 24 to 31 weeks’ gestation in CHNN are shown in Supplementary Table 3, https://links.lww.com/CM9/B158.
Table 4 - Perinatal factors associated with ACS use among infants at 24 to 31 weeks’ gestation in CHNN. Odds ratio (95% confidence interval) Perinatal factors Unadjusted Adjusted by model 1∗ Adjusted by model 2† GA, weeks 24–25 0.58 (0.44, 0.76) 0.58 (0.44, 0.78) 0.51 (0.36, 0.73) 26–27 0.81 (0.69, 0.95) 0.80 (0.67, 0.96) 0.78 (0.63, 0.96) 28–29 1.00 (0.89, 1.13) 1.02 (0.90, 1.16) 1.08 (0.94, 1.23) 30–31 Ref Ref Ref SGA 1.20 (0.96, 1.49) 1.02 (0.79, 1.30) 0.97 (0.76, 1.23) Multiple birth 1.15 (1.02, 1.30) 1.12 (0.99, 1.28) 1.06 (0.94, 1.20) Inborn 2.18 (1.94, 2.45) 1.76 (1.55, 2.01) 2.51 (1.83, 3.44) Maternal age 1.03 (1.02, 1.04) 1.02 (1.01, 1.04) 1.02 (1.01, 1.03) Primigravida 1.10 (0.99, 1.23) 1.15 (1.02, 1.29) 1.13 (0.96, 1.33) ≥1 prenatal visit 1.39 (0.86, 2.26) 1.40 (0.82, 2.41) 1.46 (0.96, 2.23) Maternal hypertension 1.36 (1.18, 1.57) 1.41 (1.18, 1.68) 1.51 (1.26, 1.82) Maternal diabetes 1.29 (1.11, 1.49) 1.14 (0.97, 1.34) 1.02 (0.87, 1.20) PROM 1.76 (1.58, 1.97) 1.69 (1.49, 1.90) 1.70 (1.38, 2.09) Cesarean delivery 1.37 (1.23, 1.53) 1.16 (1.02, 1.31) 1.17 (0.97, 1.42)∗Model 1: Uni-level model includes factors with P < 0.2 in unadjusted analysis and does not consider the cluster effect.
†Model 2: Multilevel model using generalized estimation equations model considering cluster effect.ACS: Antenatal corticosteroids; CHNN: Chinese Neonatal Network; GA: Gestational age; PROM: Premature rupture of membranes; Ref: Reference; SGA: Small for gestational age.
Variations of ACS use were assessed among 5924 inborn infants in 43 perinatal centers. ACS use rates varied from 30.2% (6/19) to 100.0% (13/13) among different sites [Figure 2A]. Six centers had ACS use rates < 70% and six centers had ACS use rates >90%. Site variations remained significant after stratification by GA and were particularly evident among infants with lower GA (24–25 weeks) [Figure 2B]. Some centers showed significant discrepancy of ACS use for infants with larger GA and those with smaller GA, such as center R and center AD. In addition, the funnel plot indicated that five participating hospitals had the Poisson limit below −95%, which suggests that the observed number of ACS usage was significantly lower than the expected one [Figure 3A]. Stratified by GA, four sites in 24 to 25 weeks, two sites in 26 to 27 weeks, two sites in 28 to 29 weeks, and one site in 30 to 31 weeks were found outside −95% control limit [Figure 3B]. One site showed low observed ACS use rates for all infants across GA groups [Figure 3B]. Variation of any ACS use in different areas of China is shown in Supplementary Figure 1, https://links.lww.com/CM9/B158. As shown in Supplementary Figure 2, https://links.lww.com/CM9/B158, there were large variations of any ACS usage in different areas of China from 64.6% in the northeast of China to 80.5% in the east of China. Supplementary Figure 2, https://links.lww.com/CM9/B158 showed that large site variations of ACS usage (particularly complete course of ACS) were observed within each area of China.
 Figure 2:
 Variation of ACS use in different hospitals for inborn infants at 24 to 31 weeks’ gestation. (A) Observed ACS use rates among 43 perinatal hospitals for infants at 24 to 31 weeks’ gestation. (B) Observed ACS use rates by GA. ACS: Antenatal corticosteroids; GA: Gestational age. Abbreviations on the horizontal axis represent member hospitals in CHNN.
 Figure 3:
 Site variation of ACS use among all inborn infants in CHNN. (A) Funnel plot for ACS use in overall inborn infants. (B) Funnel plot for ACS use paneled by GA (24–25 weeks, 26–27 weeks, 28–29 weeks, 30–31 weeks) in inborn infants. ACS: Antenatal corticosteroids; CHNN: Chinese Neonatal Network; GA: Gestational age. Each plot indicates a member hospital in CHNN.
DiscussionOur study used the currently largest cohort of very preterm infants and found that only 78.0% infants received ACS among infants with GA at 24 to 31 weeks in China. Among infants who received ACS treatment, only 49.1% of them received a complete course and 26.9% ACS were administered within 48 h to 7 days before birth. There was a huge variation of ACS use among the different hospitals. Infants born at lower GA were less likely to receive ACS, while inborn infants were more likely to receive ACS.
Previous studies had demonstrated that ACS use could improve survival and reduce the incidences of respiratory distress syndrome, intraventricular hemorrhage, and necrotizing enterocolitis in preterm infants.[18,19] As ACS treatment has become the standard care for women at risk of preterm delivery prior to 34 gestational weeks, ACS use rate has been very high in most developed countries. A retrospective cohort study of infants with GA 24 to 31 weeks and weight <1500 g from 11 high-income countries showed that the total rate of ACS use was 79.6% during 2007 to 2011 and 84.6% in 2012 to 2015.[5] In China, the ACS use rate during 2013 to 2014 was 56% among infants with GA <34 weeks and gradually increased to 64% during 2015 to 2016.[9,10] Our study confirmed a further improvement of ACS use in China with the current use rate at 78.0% for infants aged 24 to 31 weeks. However, our rate was still much lower than that of the developed countries (merely close to the level of the developed countries a decade ago). Infants aged <28 weeks showed even lower rates of ACS use. Though the survival of infants aged <28 weeks has been significantly improved over the past two decades, the most recent Chinese guideline of diagnosis and management of preterm infants still defines preterm birth from 28 weeks.[13] In 2014, the Chinese Society of Obstetrics and Gynecology composed the Diagnosis and Therapy Guideline of Preterm Birth. Two doses of 12 mg of betamethasone given intramuscularly 24 h apart or four doses
留言 (0)