
記住我


Hdac2lox/lox (The Jackson laboratory (JAX), B6.Cg-Hdac2tm1.1Rdp/J, 022625) mice, in which exons 5 and 6 of Hdac2 gene, encoding the HDAC-catalytic core of the protein, are flanked by loxP sites, were crossed to the PV-Cre (JAX, B6.129P2-Pvalbtm1(cre)Arbr/J, 017320) line to generate PV-Cre+/−;Hdac2lox/lox (Hdac2 cKO) mice. These lines were maintained through crosses of PV-Cre+/−;Hdac2lox/+ females and Hdac2lox/lox males to generate PV-Cre+/−;Hdac2lox/lox and PV-Cre−/−;Hdac2lox/lox or PV-Cre−/−;Hdac2lox/+ control littermates, or PV-Cre+/+;Hdac2lox/+ females and Hdac2lox/+ males to generate PV-Cre+/−;Hdac2lox/lox and PV-Cre+/−;Hdac2+/+ control littermates, on a mixed 129sv/C57BL/6J background. Cell specificity of Cre-mediated recombination was analyzed by breeding PV-Cre with RCEEGFP mice (JAX, Gt(ROSA)26Sortm1.1(CAG-EGFP)Fsh/Mjax, 32037). All animals were maintained under a light-dark cycle (12 h light–12 h dark) in a temperature and humidity-controlled room. Food and water were available ad libitum. All procedures described here had been approved by the Comité Institutionnel de Bonnes Pratiques Animales en Recherche (CIBPAR) of the Research Center of Sainte-Justine Hospital in accordance with the principles published in the Canadian Council on Animal’s Care’s (Guide to the Care and Use of Experimental Animals).
Mice genotypingDNA was extracted from mouse tails and genotyped to detect the presence of Cre alleles and Hdac2 conditional and wild-type alleles. Polymerase chain reaction (PCR) was performed using either a set of 2 separated primers (F1 5’-TGGTATGTGCATTTGGGAGA-3’ and R1 5’-ATTTCACAGCCCCAGCTAAGA-3’) to identify the Hdac2 floxed versus the wildtype allele or a set of 3 separate primers (5’-ATTTGGGAGAAGGCCGTTT-3’, 5’-AATTTCACAGCCCCAGCTAAG-3’ and 5′-CGAAATACCTGGGTAGATAAAGC-3′) to assure the absence of the Hdac2 null allele. Band sizes were of 720 bp for the wild-type, 560 bp for the floxed and 380 bp for the null allele. The 3 separate primers used to detect Cre in PV_Cre mice were: F1 (5’-CAGCCTCTGTTCCACATACACTCC-3’), F2 (5’- GCTCAGAGCCTCCATTCCCT-3’) and R1 (5’-TCACTCGAGAGTACCAAGCAGGCAGGA GATATC-3’) which generated 400 bp and 526 bp (mutant and wild-type) bands. To detect the presence of the RCE allele, 3 separate primers namely, RCE-Rosa1 (5’-CCCAAAGTCGCTCTGAGTTGTTATC-3’), RCE-Rosa2 (5’GAAGGAGCGGGAGAAATGGATATG-3,) and RCE-Cag3 (5’-CCAGGCGGGC CATTTACCGTAAG-3’) were used, which generated 350 bp and 550 bp bands.
ImmunohistochemistryMice of both sexes were anesthetized, then perfused intracardially with PBS followed by 4% (w/v) paraformaldehyde (PFA) in PBS. Intact brains were extracted and post-fixed in 4% PFA/PBS overnight at 4 °C. The tissue was then cryoprotected in 30% (w/v) sucrose (Sigma) in PBS, sectioned coronally at 40 μm on a cryostat (Leica VT100) and stored as floating sections in PBS. For immunohistological analysis, brain sections were blocked in 10% normal goat serum (NGS, Invitrogen, 10000C) in PBS containing 1% (v/v) Triton X-100 for 2 h at room temperature. Primary antibodies were diluted in 5% goat serum in PBS containing 0.1% (v/v) Triton X-100 and incubated 24–48 h at 4 °C. Slices were then washed in PBS (3 ×10’), incubated in the appropriate Alexa-conjugated antibodies in 5% NGS, 0,1% Triton in PBS for 2 h at room temperature, washed again in PBS (3 ×10’), and mounted in Vectashield (Vector Lab, H-1000) before imaging.
The primary antibodies used in this study and their working concentrations are as follows: rabbit monoclonal anti-Hdac2 (1:500; Abcam, 32117, RRID:AB_732777); mouse monoclonal anti-PV (1:2000; Swant, 235, RRID:AB_10000343); rabbit polyclonal anti-PV (1:4000; Swant, PV27, RRID:AB_2631173); guinea pig polyclonal anti-PV (1:1000; Synaptic Systems, 195004, RRID:AB_2156476); mouse monoclonal anti-gephyrin (1:500; Synaptic Systems, 147021, RRID:AB_22325461); rabbit polyclonal anti-aggrecan (1:500; Millipore, AB1031, RRID:AB_90460); chicken polyclonal anti-GFP (1:1000; Abcam, 13970, RRID:AB_300798). To label PNNs, a solution of biotin-conjugated lectin Wisteria floribunda (WFA) (10 µg/ml; Sigma-Aldrich, L1516) was added in the primary antibody solution.
The secondary antibodies used in this study and their working concentrations are as follows: goat anti-chicken Alexa488 conjugated (1:1000; Abcam, ab150169), goat anti-rabbit Alexa633 conjugated (1:400; Life technologies, A21072), goat anti-mouse Alexa555 conjugated (1:1000; Cell Signaling, 4409S), goat anti-mouse Alexa647 conjugated (1:1000; Cell signaling, 4410S), goat anti-rabbit Alexa555 conjugated (1:400; Life technologies, A21430), goat anti-guinea pig Alexa647 conjugated (1:400; Life technologies, AB21450) and Alexa 568-conjugated streptavidin (1:500; Invitrogen, S-11226).
All immunohistological experiments were performed on at least three different sections per brain region per animal. No mice were excluded from the following analysis.
Confocal imagingAll images were acquired using Leica confocal microscopes (SP8 or SP8-STED). We imaged somatosensory (SSCX) and prefrontal cortex (PFC) layer 5 and basolateral amygdala (BLA) using 20X multi-immersion (NA 0.75) and 63X oil (NA1.4) objectives. We focussed on layer 5 of SSCX and PFC because PV+ cells are more abundant in this layer. The 20X objective was used to acquire images to analyze the percentage of: GFP+PV+/PV+ cells (recombination rate), GFP+PV+/GFP+ cells (Cre-recombination specificity), PNN+PV+/PV+ cells and Agg+PV+/PV+ cells. The 63X objective was used to acquire images to analyze the perisomatic innervation (number of perisomatic PV+ boutons and gephyrin+ punctas). At least three confocal images from three different brain sections were acquired per brain region with z-step size of 2 µm (20X) and 0.5 µm (63X). All the confocal parameters were maintained constant throughout the acquisition of an experiment.
Image analysisThe number of positive cells (GFP+, PV+, PNN+ and/or Agg+) were manually identified and counted using ImageJ-Fiji software. To quantify the number of PV+, gephyrin+ and PV+/gephyrin+ punctas, images were exported as TIFF files and analyzed using Neurolucida software. PV+ boutons and gephyrin+ punctas were independently identified around the perimeter of a targeted cell after selecting the focal plane with the highest soma circumference. At least 4 perisomatic innervated somata were selected in each confocal image. Investigators were blind to the genotypes or conditions during the analysis. Each experiment included both controls and mutant or treated mice.
Behavioral testingFor all experiments, a camera was mounted above the arena; images were captured and transmitted to a computer running the Smart software (Panlab, Harvard Apparatus) or FreezeFrame software IMAQ 3 (Version 3.0.1.0). The sequence of animals tested was randomized by the genotype. Care was taken to test litters containing both the genotypes specific to the breeding. Room lights were kept low during all procedures.
Open fieldEach subject (P60) was gently placed at the center of the open-field arena and recorded by a video camera for 10 min. The recorded video file was analyzed with the SMART video tracking system (v3.0, Harvard Apparatus). The open field arena was cleaned with 70% ethanol and wiped with paper towels between each trial. The time spent in the center (45% of the surface) versus the periphery was calculated. Locomotor activity was indexed as the total distance traveled (m).
Elevated plus mazeThe apparatus consisted of two open arms without walls across from each other and perpendicular to two closed arms with walls joining at a central platform. Each subject (P60) was placed at the junction of the two open and closed arms and allowed to explore the maze during 5 min while video recorded. The recorded video file was analyzed with the SMART video tracking system (v3.0, Harvard Apparatus) to evaluate the percentage of time spent in the open arms (open/(open + closed) × 100) and the number of entries in the open arms as a measure of anxiety-related behavior.
Fear conditioning and fear extinctionFear conditioning and extinction were conducted in an isolated behavior room using standard operant boxes in two different contexts (contexts A and B, respectively). The context A consisted of white walls, a grid floor, and was washed with 70% ethanol before and after each session. The context B consisted of black and white stripped walls, a white plexiglass floor, and was washed with 1% acetic acid before and after each session. Two different fear conditioning protocols [28] were used in this study, as described in details below.
PV-Cre+/−; Hdac2lox/lox males and their PV-Cre−/−; Hdac2lox/lox or PV-Cre−/−; Hdac2lox/+ control male littermates, or Hdac2lox wildtype males, were conditioned using the following protocol. One day prior to fear conditioning (Day 0), mice were allowed to freely explore the context A for habituation. On day 1, mice were conditioned using 5 pairings of the conditioned stimulus (CS duration 5 s, white noise, 80 dB) with a co-terminating unconditioned stimulus (US, 1 s foot-shock, 0.6 mA, inter-trial interval: 30–60 s). On days 2 and 3, conditioned mice were submitted to extinction training in context B. During this training, 12 CS were presented at 30 s intervals on each day. Retrieval of extinction memory and context-dependent fear renewal were tested 7 days later in context B and A, respectively, using 4 presentations of the CS. The retrieval test allowed to quantify the spontaneous recovery of fear memory associated with the cue (CS, conditional stimulus), since it is performed in the same context as extinction learning. The renewal test was performed using the same sound and context of fear acquisition (day 1). The goal of this test was to verify weather extinction of cue-based fear memory was generalized to the context as well, a behavior that is common in very young animals [8, 28, 31].
PV-Cre+/−; Hdac2lox/lox males and their PV-Cre+/−; Hdac2+/+ control male littermates were conditioned using the following protocol. On day 0, mice were allowed to freely explore the context A for habituation. On day 1, mice were conditioned using 5 pairings of the conditioned stimulus (CS duration 30 s, 50 ms pips repeated at 0.9 Hz, 2 ms rise and fall, pip frequency: 7.5 kHz, 80 dB) with an unconditioned stimulus (US, 1 s foot-shock, 0.6 mA, inter-trial interval: 30–150 s). The onset of the US coincided with the offset of the CS. On days 2 and 3, conditioned mice were exposed to extinction training in context B. During this training, mice were exposed to 12 CS at 30 s intervals on each day. Retrieval of extinction and context-dependent fear renewal were tested 7 days later in context B and A, respectively, using 4 presentations of the CS.
Mice behavior was video-recorded with FreezeFrame software. An experimenter blind to the genotype or experimental conditions scored freezing behavior (defined by complete immobility with the exception of respiratory movements) by measuring the time spent freezing during 30 s following CS presentation. Results presented are the mean of time spent freezing after the presentation of the first 2 CS on the first day of extinction (day 2, CS1-2 = early extinction), the last 2 CS on the second day of extinction (day 3, CS 11-12 = late extinction), the first 2 CS during the retrieval test in the extinction context B (day 10, CS 1-2 = retrieval) and the first 2 CS during the renewal test in the fear acquisition context A (day 10, CS 1-2 = renewal).
Mice were excluded from analysis if they did not show effective fear extinction (freezing more than 80% of time at the end of extinction training, Late extinction = day 3, CS 11-12): Fig. 1b: n = 3 control mice excluded, n = 0 PV-Cre+/−; Hdac2lox/lox mouse excluded, Fig. 1g: n = 0 vehicle-injected Hdac2lox mouse excluded, n = 1 BRD6688-injected Hdac2lox mouse excluded, Supplementary Fig. 2: n = 0 PV-Cre+/−; Hdac2+/+ mouse excluded, n = 1 PV-Cre+/−; Hdac2lox/lox mouse excluded. Mice were also excluded from analysis if they did not show effective fear acquisition (freezing less than 15% of time at the onset of extinction training, early extinction = day 2, CS 1-2): Supplementary Fig. 2: n = 0 PV-Cre+/−; Hdac2+/+ mouse excluded, n = 1 PV-Cre+/; Hdac2lox/lox mouse excluded.
Viral vector and stereotaxic injectionspAAV.EF1α-DIO-Flag-Hdac2_T2A_GFP (titre – 1E13 GC/mL) was cloned from pCIG-HDAC2-IRES-eGFP [62] and produced as AAV2/9 serotype by the Canadian Neurophotonics Platform. pAAV_EF1α_DIO_eYFP control virus was produced by the same platform (titre – 5E13 GC/mL [injected at 1:6 dilution]). PV-Cre; Hdac2+/+ or PV-Cre; Hdac2lox/lox mice were used at postnatal day (P) 42-50 for all surgeries. Unilateral viral injections were performed at the following stereotaxic coordinates: +1.9 mm Anterior-Posterior (from Bregma), +0.4 mm Medio-Lateral and 1.6 mm Depth from the cortical surface. Surgical procedures were standardized to minimize the variability of AAV injections. Glass pipette with the virus was lowered at the right depth and kept for 2 min before starting the injections. Each injection volume was kept to 46 nl, and a total of 8 injections per mouse were done for each virus. To ensure minimal leakage into surrounding brain areas and to optimize viral spread in the desired area, injection pipettes were kept in the same position following the injection for 5 min. They were withdrawn at the rate of 0.25 mm/min following the injection. Mice were kept for 3 weeks following viral injections to allow for optimal gene expression. The efficiency of AAV injection was evaluated in each mouse by GFP+ cell density. No mouse was excluded in this analysis.
PFC dissection and dissociationMice of both sexes aged P40-P43, were anesthetized with ketamine/xylazine (4:1), transcardically perfused with ice-cold aCSF solution of the following composition (in mM): 62.5 NaCl, 70 sucrose, 2.5 KCl, 25 NaHCO3, 1.25 NaH2PO4, 7 MgCl2, 1 CaCl2, 20 HEPES and 20 glucose. Brains were then quickly removed, transferred to ice-cold aCSF solution and fixed to a stage allowing to cut 300 μm slices with a VT1200 S, Leica vibratome. Slices were individually transferred to a cutting surface in ice-cold aCSF, where frontal cortex was micro dissected from the slices. Dissected tissue was then dissociated into cell suspension [63] using the Papain dissociation system (Worthington) as per manufacturer’s instructions, with the addition of trehalose as described in [64]. Post trituration, cells were then counted using iNCYTO C-Chip hemocytometers, and resuspended at 150–200 cells/μl in DropSeq Buffer (in mM): x1 HBSS, 7 MgCl2, 1 CaCl2, 20 glucose, 5% Trehalose and 10% BSA.
Single cell capture and sequencingResuspended cells were run through a custom Drop-Seq setup allowing the capture of single cells and barcoded beads (ChemGenes) within nanoliter droplets as described in the original Drop-seq protocol (http://mccarrolllab.com/dropseq/) [65]. The setup closely resembled the original one [65], with minor modifications. In particular, Medfusion 3500 syringe pumps (Smiths Medical) instead of KD Scientific Legato 100 pumps were used, as well as a different RNase inhibitor (SUPERase• In; catalog no. AM2694; Thermo Fisher Scientific).
Single-cell suspensions (150–200 cells/µl) were run alongside barcoded beads (140 beads µl/1) in 1.7 ml of cell lysis buffer (Tris 200 mM, EDTA 20 mM, 20% Sarkosyl, 20% Ficoll, DTT 50 mM; also containing 50 µl of RNase inhibitor), to produce beads attached to single-cell transcriptomes. Beads attached to single-cell transcriptomes were subsequently washed, reverse-transcribed, treated with exonuclease and counted using a Fuchs-Rosenthal hemocytometer (INCYTO C-Chip Cat-Nr:82030–474), as described in the original Drop-seq protocol [65]. Bead counting was performed using water and bead counting solution (10% polyethylene glycol, 2.5 M NaCl) in a 1:1 ratio as described in Gierahn et al. 2017 [66]. For PCR amplification 4000 beads (approximately 200 single-cell transcriptomes attached to microparticles) were used as input for each PCR. Individual PCR reactions were then pooled to achieve the desired number of single-cell transcriptomes attached to microparticles (STAMPS). In this experiment we used 2000 STAMPS which were cleaned up with AMPure XP (Beckmann Coulter Life Sciences) beads at a ratio of 0.6X prior to sequencing.
Correct size distribution and concentration of complementary DNA was determined using a Bioanalyzer High Sensitivity DNA assay (catalog no. 5067–4626; Agilent Technologies). Library preparation was performed using the Nextera XT DNA Library Preparation Kit (Illumina) with 600 pg input according to the Drop-seq protocol using Illumina i7 primers (N701—N706) together with a custom P5 primer (GCCTGTCCGCGGAAGCAGTGGTATCAACGCAGAGTAC) in the library PCR amplification (see the Drop-seq protocol [65]). Libraries were quality-controlled for size and concentration using the Bioanalyzer High Sensitivity DNA assay. Libraries were quantified using the Universal Library Quantification Kit (KAPA) before sequencing on a NextSeq 550 system (Illumina) at the Institute for Research in Immunology and Cancer (IRIC) in Montreal. Sequencing was performed on a NextSeq 500 system with the read settings R1 = 20 bp, R2 = 63 bp and index = 8 bp.
Computational analysis of single-cell transcriptomic dataDemultiplexing of raw Illumina sequencing data was performed with bcl2fastq v.2.17 by the Institute for Research in Immunology and Cancer (IRIC) in Montreal. Fastq files were quality controlled (Supplementary Fig. 4) and processed using the Drop-seq computational pipeline, similar to earlier report [67] (Drop-seq alignment cookbook v.1.2, January 2016) using Drop-seq tools v.1.12, to produce digital gene expression (DGE) matrices for each sample [65]. DGE matrices were processed in R (3.5.2) using Seurat (v.2.2.0) [68, 69]. Cells with less than 250 genes expressed and genes detected in less than 3 cells were filtered out from further analysis. Cell cycle scores for filtered cells were calculated using the function CellCycleScoring from Seurat with cell cycle gene lists from Nestorowa et al. [70] (https://satijalab.org/seurat/articles/cell_cycle_vignette.html). Expression values were normalized and scaled to 10,000 transcripts with Seurat’s Normalize function. Normalized expression values were scaled using the ScaleData function from Seurat, regressing out the number of UMIs, Mouse ID, percent mitochondrial genes as well as S and G2M scores from cell cycle prediction.
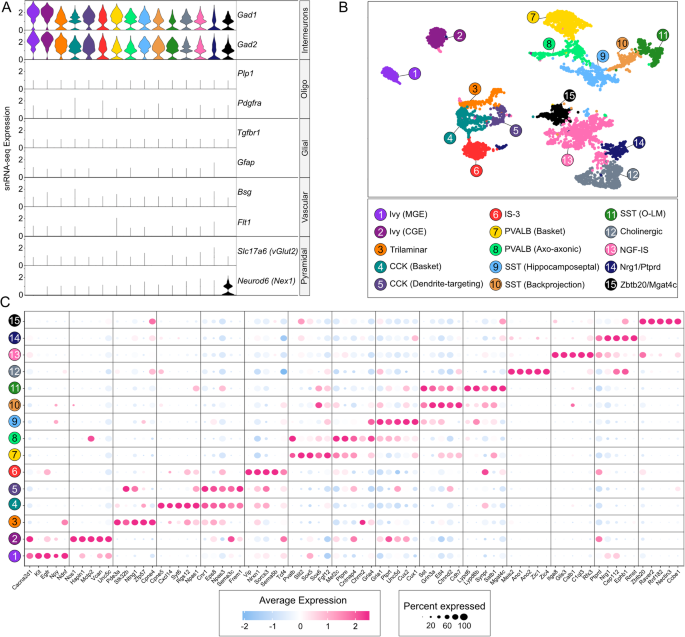
Cells from eight different mice were then aligned with canonical correlation analysis (CCA) [69]. To do so, we used the RunMultiCCA function on the top 1000 highly variable genes overlapping between the samples. We subsequently ran the AlignSubspace function in Seurat, using the experiment as a grouping variable with an appropriate number of CCA dimensions. These dimensions were derived from the inflection point of the elbow plot generated by Seurat ElbowPlot function, resulting in 15 dimensions. The output from this analysis was then analyzed with RunTSNE. followed by FindClusters function, with a resolution parameter of 1.2. The process resulted in identification of 18 total clusters that were subsequently plotted in 2 tSNE dimensions. Biological cell types in the 18 resulting clusters were annotated manually based on known markers for brain cell types. Violin Plots were plotted using the VlnPlot function from Seurat with normalized gene expression values.
Cell type identificationFinal cell types were attributed based on the identified top markers in each cluster. Clusters containing VGLUT1 were considered to be pyramidal Neurons, while clusters containing GAD1 and GAD2 were considered to be GABAergic interneurons (Fig. 3a, Supplementary Fig. 5). For more in depth analysis of neuron types as well as identification of non-neuronal cell subtypes, we took the top 30 and 50 markers from each cluster and compared them to the DropVis database [71]. The number of markers shared for each cluster was then calculated, and a percentage identity with DropViz clusters calculated.
Fluorescent multiplex RNAscopeTo evaluate Acan mRNA expression in naive condition, mice of both sexes were cervically dislocated, brains were dissected, fast-frozen in cold isopentane (~−70 °C) and conserved at −80 °C. To evaluate Acan mRNA expression after extinction training, adult males were cervically dislocated 3 h after the end of extinction training on day 4 (late extinction).
Coronal brain sections (20 µm) were cut using a cryostat (Leica Microsystems) and mounted on Superfrost Plus Gold Glass Slides (Fisher Scientific, 22-035-813). Slides were subsequently stored at −80 °C. Probes against Acan mRNA (439101), which codes for aggrecan, and Pvalb mRNA (421931-C2), which codes for PV, as well as other reagents for ISH and DAPI labeling, were purchased from Advanced Cell Diagnostics (ACD). Tissue pre-treatment, hybridization, amplification and detection were performed according to the RNAscope Sample Preparation and Pretreatment Guide for Fresh Frozen Tissue using RNAscope Fluorescent Multiplex Assay manual (ACD). During RNAscope hybridization, positive probes (320881), negative probes (320871), and acan/Pvalb probes were processed simultaneously. Briefly, the slides were removed from −80 °C and immediately post-fixed in 4% PFA/PB for 15 min before dehydration in 5 min consecutive baths (70% EtOH, 50% EtOH, 2 ×100% EtOH). The slides were air dried and hydrophobic barrier was created around each section with ImmEdge Pen (310018). Protease IV (322336) was added to each section and incubated at room temperature for 30 min followed by two washes in distilled water. For detection, probes were added to each section and incubated for 2 h at 40 °C. Unbound probes were subsequently washed away by rinsing slides in 1X wash buffer (310091) 2 × 2 min. AMP reagents (AMP1 (320852), AMP2 (320853), AMP3 (320854), AMP4A (C1 probes-Alexa-488 and C2 probes-Atto-550) (320855)) were added to each section and incubates for as per the manufacturer’s instructions (RNAscope Fluorescent Multiplex Reagent Kit PART 2 Manual), and washed in wash buffer for 2 × 2 min. Sections were stained with DAPI (320858) for 30 s, and then mounted with Prolong Diamond Antifade Mountant (Invitrogen P36961). Images were acquired with a SP8-STED confocal microscope (Leica Microsystems), using a 63X (NA 1.4) objective, voxel size: 0.06 µm × 0.06 µm × 0.299 µm, and deconvolved using Huygen’s express deconvolution option. These experiments were performed using tissue from three different mice for each genotype and/or treatment. To determine the number of Acan dots per PV+ cell, images were analyzed using a custom-made ImageJ-Fiji macro. Briefly, a dark region was selected on each focal plane to measure the mean gray value (MGV) as background (BCKG). Then, for each channel and each focal plane, the BCKG value was subtracted, and intensity value of each pixel was readjusted by multiplying it with 65535/(65535-BCKG). Then, each PV+ cell was manually selected based on the presence of Pvalb puncta, filtered with the Gaussian Blur 3D option and analyzed using the 3D objects counter (threshold = 4500, minimal voxel size = 6). Results are presented as mean of the number of objects per PV+ cell ±s.e.m. No mice were excluded from these analysis.
Drug treatmentBRD6688 (Glixx Lab, #GLXC-05908) was dissolved in DMSO (1% of the total resultant solution) and then diluted in 30% Cremophor/69% in physiological saline (H2O containing 0.9% NaCl (Hospira, 04888)), for a final dosage solution of 1 mg/kg. Vehicle solutions consisted of the aforementioned solution without the compound. Solutions were prepared immediately before injection and administered by an investigator blind to the genotype to either Hdac2lox wildtype or PV-Cre+/−; Hdac2lox/lox via intraperitoneal injection 6 h prior to extinction training performed by a second investigator blind for both the genotype and treatment. Mice were randomly allocated to vehicle or BRD6688 injection.
siRNA-delivering peptidesTARBP-BTP RNA-binding protein was produced by the National Research Council Canada (NRC), Montreal, Quebec, Canada, as described previously [44]. The original pET28a-His-pTARBP-BTP coding plasmid was provided by CSIR-CCMB. TARBP-BTP:siRNA complex were prepared as previously described [44, 45]. Silencer Select Acan mouse targeting siRNA (Life technologies, #s61116) and Silencer Select Negative Control siRNA (Life technologies, #4390843) were resuspended at 200 µm with nuclease-free water. For in vivo delivery, TARBP-BTP and siRNA were drop wise mixed together at 5:1 mole ratio. The complex was incubated 20 min at room temperature and administered intravenously (i.v.) via the lateral tail vein at a dose of 20 nmol:4 nmol TARBP-BTP:siRNA in a total volume of 150 µL per mouse. 48 h after injection, 3 P60 Hdac2lox mice injected with siCtrlNeg and 4 P60 Hdac2lox mice injected with siAcan were cervically dislocated, brains were dissected and fast-frozen in cold isopentane (~−70 °C) and conserved at −80 °C before proceeding with Fluorescent multiplex RNAscope. To investigate Acan knockdown effect on spontaneous recovery of fear memory after extinction training, 21 Hdac2lox were fear-trained by a second investigator blind for the treatment using the following protocol. On day 0, mice were allowed to freely explore the context A for habituation. On day 1, mice were conditioned using 5 pairings of the conditioned stimulus (CS, duration 5 s, white noise, 80 dB) with a co-terminating unconditioned stimulus (US, 1 s foot-shock, 0.6 mA, inter-trial interval: 30–60 s). On day 2, 11 mice were i.v. injected with TARBP-BTP:siCtrlNeg and 10 mice were i.v. injected with TARBP-BTP:siAcan at a dose of 20 nmol:4 nmol per mouse. On days 3 and 4, conditioned mice were subjected to extinction training in context B. During this training, mice were presented with 12 CS at 30 s intervals on each day. Spontaneous recovery of fear memory (retrieval of extinction memory test) and context-dependent fear renewal (renewal test) were tested 7 days later in context B and A, respectively, using 4 presentations of the CS. Data analysis was performed by an investigator blind to the treatment and as described above. Mice were randomly allocated to TARBP-BTP:siCtrlNeg or TARBP-BTP:siAcan injection.
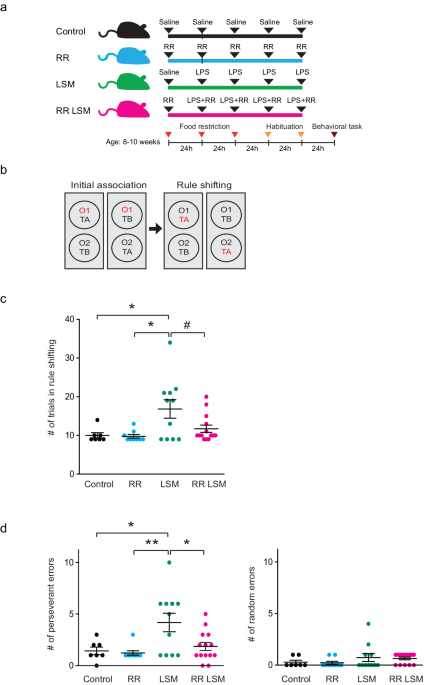
Statistical analysisNo statistical methods were used to predetermine sample size. Each experiment included wild type and mutant littermate mice, or mice injected with vehicle/ TARBP-BTP:siCtrlNeg and BRD6688/ or TARBP-BTP:siAcan. Experiments were performed using multiple litters. Statistical analysis was performed with Prism 6.01 (GraphPad software). Data were systematically tested for normal distribution, with the D’Agostino & Pearson omnibus normality test. Differences between two groups of normally distributed data with homogenous variances were analyzed using parametric student’s t-test, while not normally distributed data were analyzed with the Mann–Whitney test. To evaluate genotype effects on PV+Gephyrin+ perisomatic puncta in naive mice and in mice following extinction training, two-ways ANOVA test was performed followed by Sidak posthoc test (variables: genotype, treatment). To evaluate the effect of virally-mediated re-expression of Hdac2 on Aggrecan and PNN, Kruskall–Wallis test was performed followed by Dunn’s multiple comparison test. For fear conditioning analysis, we evaluated the extinction rate by Repeated measures two-ways ANOVA, while freezing time at extinction retrieval and fear renewal tests were analyzed with unpaired two-tailed t-test, if normally distributed and Mann–Whitney if not. Results were considered significant for values of P < 0.05. Data are presented as mean ± standard error of mean.
留言 (0)