
記住我

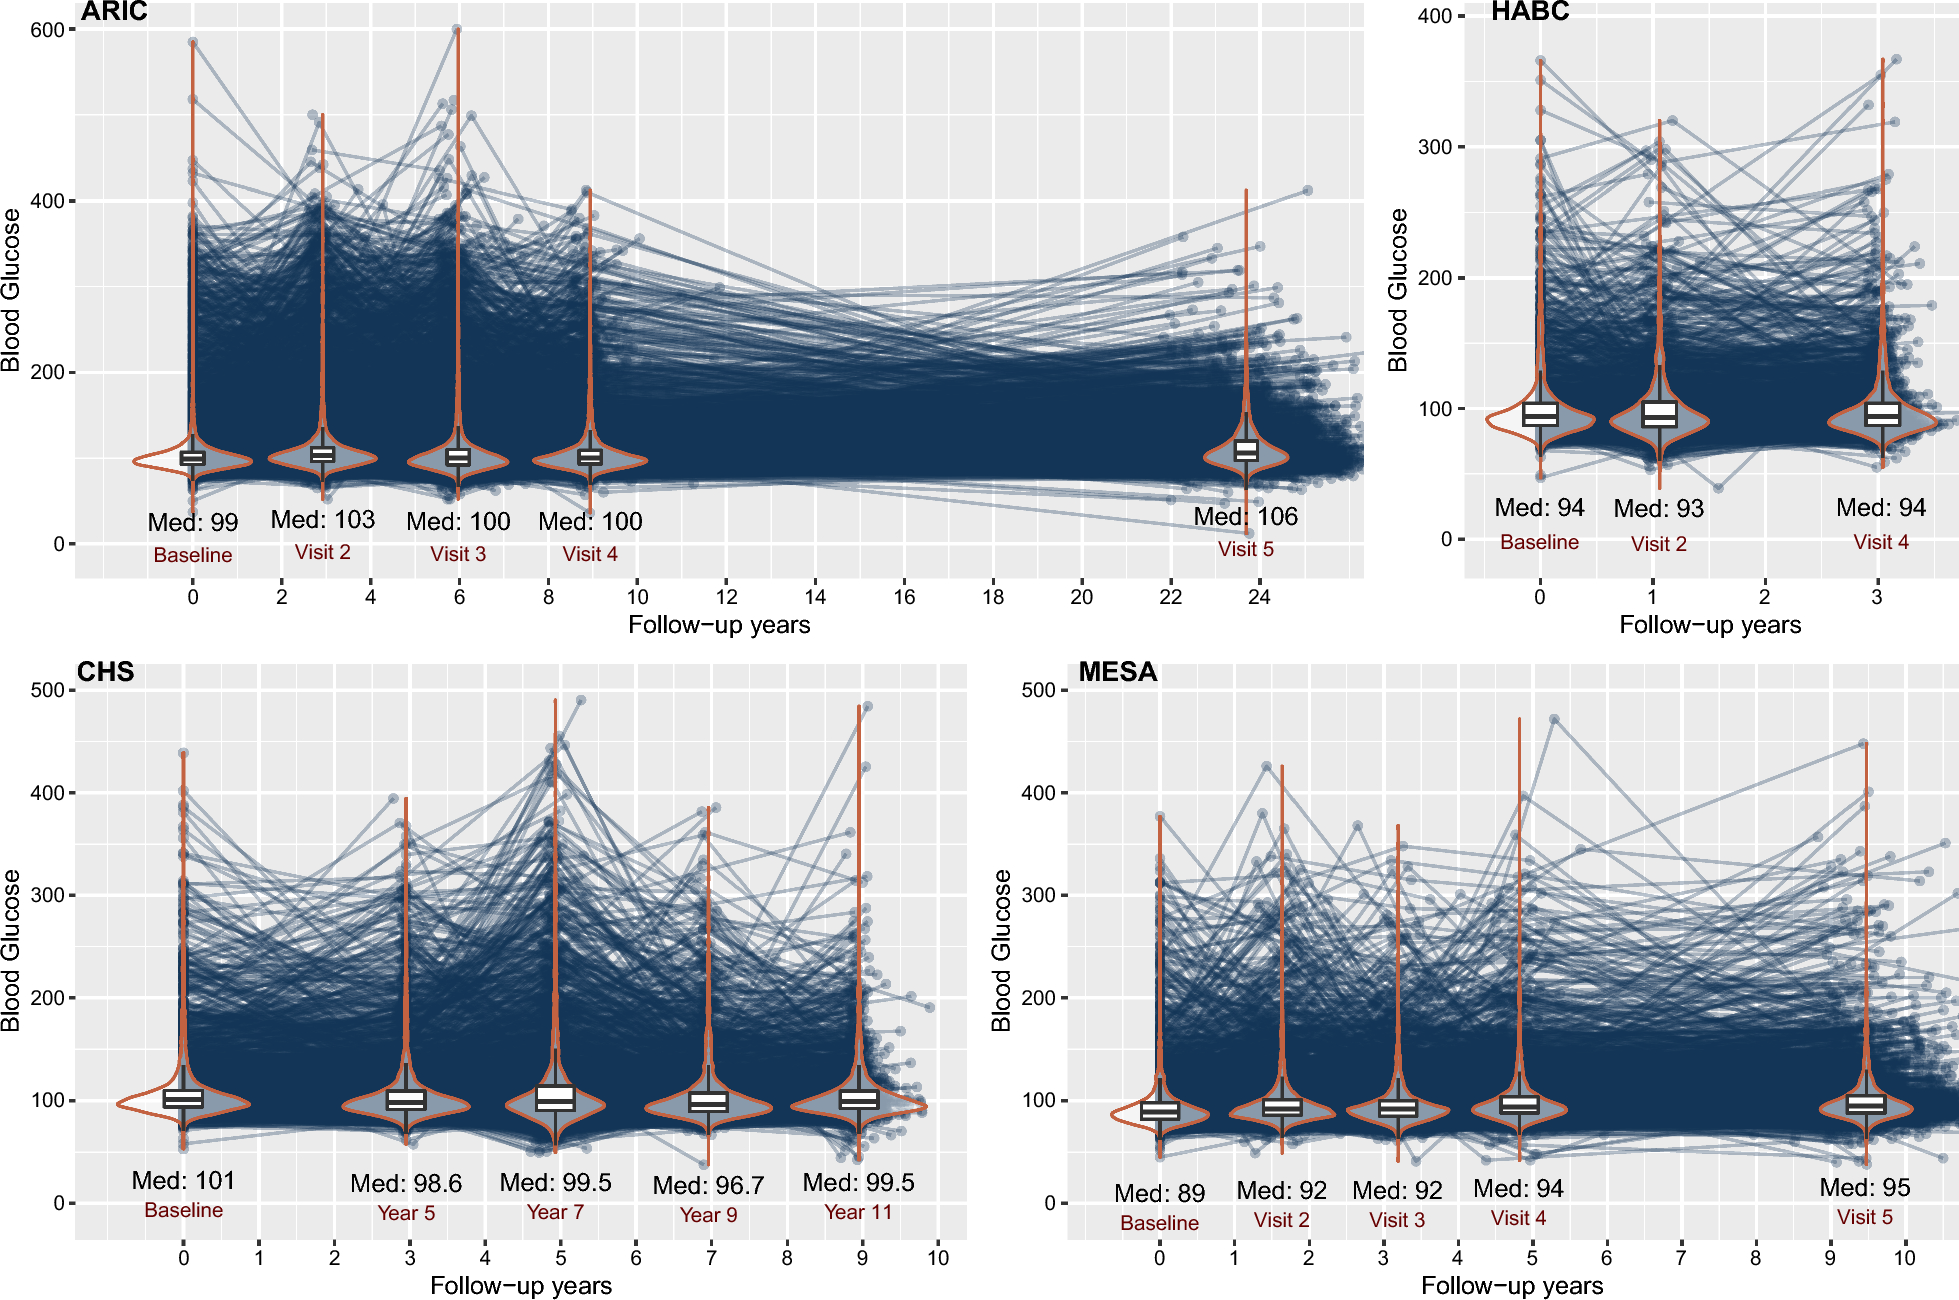

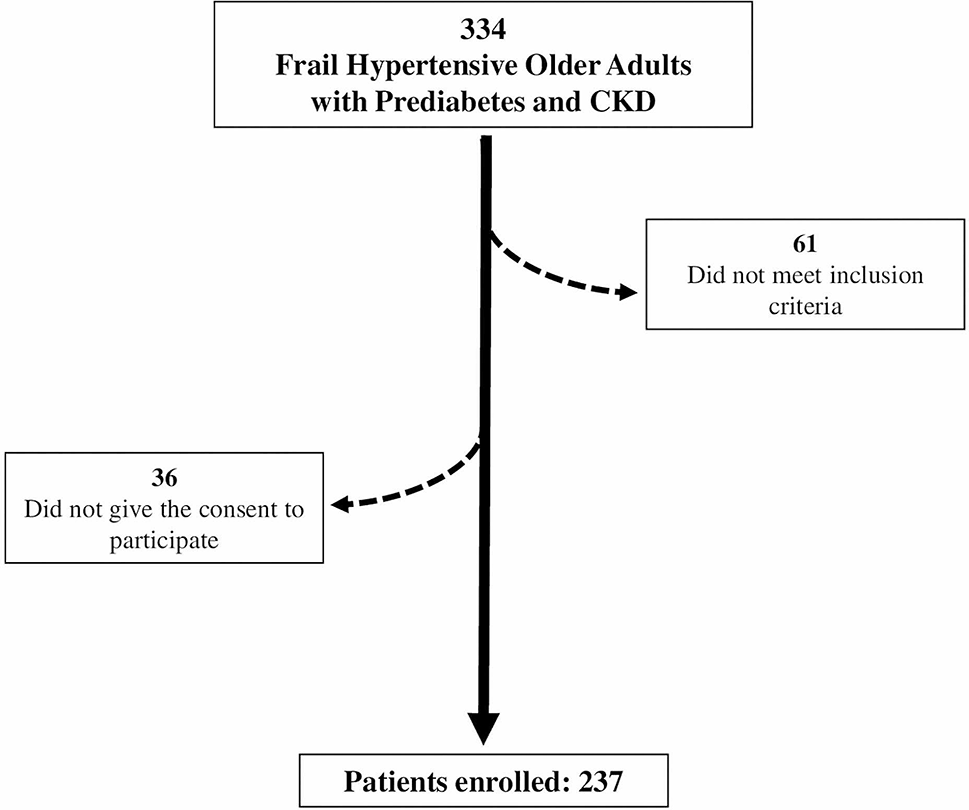
Of 107 participants assessed for eligibility, 88 adults were recruited for this study (Fig. 1). Of the 88 subjects (age 30.1 ± 7.5 years, 43.2% females, median BMI 27.7 kg/m2), 46 subjects (age 32.0 ± 7.5 years, 43.5% females, BMI 30.4 ± 1.9 kg/m2) were with obesity, and 42 subjects (age 29.7 ± 7.4 years, 42.9% females, BMI 20.4 ± 1.4 kg/m2) were healthy controls. Subjects with obesity and healthy controls did not differ in age (p = 0.09) or sex (p = 0.95) (Table 2). Twenty-seven subjects with obesity (27/46 = 58.7%) were diagnosed with hypertension, and 20 subjects with obesity (20/46 = 43.5%) had prediabetes. Nineteen subjects with obesity (19/46 = 41.3%) were diagnosed with MetS. The LVEF values of all subjects were within the normal range. Demographics, anthropometry, laboratory, and MR measures are summarized in Table 2.
Fig. 1
Flow chart of participant inclusion and exclusion
Table 2 Demographics, Anthropometry, Laboratory and MR measures of Study CohortComparisons of anthropometry, laboratory, and MR measures between subjects with obesity and healthy controlsBMI, waist and hip circumferences, systolic and diastolic BP, ALT, TC, TG, LDL-C, fasting and 2-h serum glucose in subjects with obesity were all significantly higher than those in healthy controls (all p ≤ 0.001), HDL-C in subjects with obesity was significantly lower than that in healthy controls (p < 0.001) (Table 2).
Compared to healthy controls, subjects with obesity had higher EAT, LVM, LVEDV, LVESV, SV, H-PDFF, P-PDFF, SAT, and VAT (all p ≤ 0.01), and lower R-PS, |C-PS|, |L-PS|, |L-PSSR|, C-PDSR, and L-PDSR (all p < 0.05) (Figs. 2, 3; Table 2). LVMT, LVEF, R-PSSR, |C-PSSR|, |R-PDSR|, and hepatic shear stiffness did not show significant differences between subjects with obesity and healthy controls (all p ≥ 0.10) (Table 2).
Fig. 2
Boxplots of MR-based measures showing significant differences between obesity and healthy controls. Subjects with obesity had significantly higher H-PDFF, P-PDFF, SAT, VAT, EAT, LVM, LVEDV, LVESV, SV, and had significantly lower R-PS, |C-PS|, |L-PS|, |L-PSSR|, C-PDSR and L-PDSR than healthy controls
Fig. 3
Examples of (a) MR images and (b) LV myocardial strain parameters in a 39-year-old man with obesity and in a healthy 34-year-old man
Associations of H-PDFF with LV measuresIn the over-all cohort, H-PDFF was positively correlated with EAT, LVM, LVEDV, and SV (r = 0.24 to 0.54, all p ≤ 0.02), and was inversely correlated with R-PS, |C-PS|, |L-PS|, |L-PSSR|, |R-PDSR|, C-PDSR, and L-PDSR (rho = − 0.21 to − 0.41, all p < 0.05) in univariate analyses. The associations of H-PDFF with EAT, R-PS, |L-PS| persisted in both models (all p ≤ 0.04) (Fig. 4).
Fig. 4
Scatterplots of significant associations in multivariable analyses (Model 1 and Model 2) in the over-all cohort. Pearson correlation coefficients (r) and p values are provided for the correlation between (a) H-PDFF, (c) P-PDFF, (d) SAT, (b) VAT and MR-based cardiac measures. The solid line indicates the line of best fit by using the least squares method, and the dotted line shows the 95% confidence interval
In subjects with obesity, there were negative correlations between H-PDFF and |R-PDSR|, C-PDSR in univariate analyses (r = − 0.30 and − 0.33, p = 0.045 and 0.03, respectively). Age, sex and MetS did not affect these associations (p = 0.046 and 0.04, respectively). However, the associations were not significant in Model 2 (p = 0.27 and 0.36, respectively). In healthy controls, |C-PS|, |R-PDSR|, and L-PDSR decreased significantly with increasing H-PDFF in univariate analyses (r = − 0.36 to − 0.39, all p ≤ 0.02). The associations between H-PDFF and |R-PDSR|, L-PDSR remained significant in both models (all p ≤ 0.04) (Fig. 5).
Fig. 5
Scatterplots of significant associations in multivariable analyses (Model 1 and Model 2) in (a) subjects with obesity and (b) healthy controls. Pearson correlation coefficients (r) and p values are provided for the correlation between H-PDFF, P-PDFF, VAT and LV global myocardial strain parameters. The solid line indicates the line of best fit by using the least squares method, and the dotted line shows the 95% confidence interval
Associations of P-PDFF with LV measuresIn the over-all cohort, EAT, LVM, LVEDV, LVESV, and SV increased significantly with increasing P-PDFF (r = 0.24 to 0.57, all p ≤ 0.02); R-PS, |C-PS|, |L-PS|, C-PDSR, and L-PDSR decreased significantly with increasing P-PDFF (r = − 0.22 to − 0.41, all p ≤ 0.04) in univariate analyses. The associations between P-PDFF and EAT, LVEDV, SV, |C-PS|, and |L-PS| remained significant in both models (all p ≤ 0.02) (Fig. 4).
In subjects with obesity, P-PDFF was inversely correlated with C-PS in univariate analysis (r = − 0.30, p = 0.04), which was not affected by age, sex, hypertension, TG, HDL-C, prediabetes, or MetS (p = 0.01) (Fig. 5). In healthy controls, there was no significant association between P-PDFF and any LV measure in univariate analyses (all p > 0.05).
Associations of SAT with LV measuresIn the over-all cohort, there were positive correlations between SAT and EAT, LVM, LVEF, LVEDV and SV (r = 0.22 to 0.71, all p ≤ 0.04), and negative correlations between SAT and R-PS, |L-PS|, |L-PSSR| and L-PDSR (r = − 0.23 to − 0.41, all p ≤ 0.04) in univariate analyses. The associations between SAT and EAT, LVEDV, SV, |L-PS|, |L-PSSR| and L-PDSR persisted in both models (all p ≤ 0.04) (Fig. 4).
In subjects with obesity, there was no significant association between SAT and any LV measure in univariate analyses (all p ≥ 0.08). In healthy controls, there was a negative correlation between SAT and LVMT in univariate analysis (r = − 0.35, p = 0.02), while it did not remain significant in either model (p = 0.86 and 0.89, respectively).
Associations of VAT with LV measuresIn the over-all cohort, VAT was positively correlated with EAT, LVM, LVMT, LVEDV, LVESV, and SV (r = 0.23 to 0.62, all p ≤ 0.03), and was negatively correlated with |C-PS|, |L-PS|, C-PDSR, and L-PDSR (r = − 0.23 to − 0.55, all p ≤ 0.03) in univariate analyses. VAT was associated with EAT, SV, |L-PS| in both models (all p ≤ 0.02) (Fig. 4).
In subjects with obesity, there was a positive correlation between VAT and LVMT (r = 0.36, p = 0.02), and there were negative correlations between VAT and |L-PS|, C-PDSR, and L-PDSR (r = − 0.38 to − 0.44, all p ≤ 0.01) in univariate analyses. Only |L-PS| decreased with increasing VAT in both models (p = 0.002 and < 0.001, respectively) (Fig. 5). In healthy controls, VAT was inversely correlated with C-PS in univariate analysis (r = − 0.31, p = 0.049), which was of no significance in either model (p = 0.18 and 0.17, respectively).
Associations of hepatic shear stiffness with LV measuresIn univariate analyses, there was a negative correlation between hepatic shear stiffness and |L-PS| in the over-all cohort (rho = − 0.25, p = 0.02). There were positive correlations between hepatic shear stiffness and LVM, LVMT, and SV in subjects with obesity in univariate analyses (rho = 0.31 to 0.34, all p ≤ 0.04); however, they did not remain significant in multivariable analyses (p ≥ 0.05). In healthy controls, there was no significant association between hepatic shear stiffness and any cardiac measure in univariate analyses (all p ≥ 0.08).
Results of univariate analyses and multivariable regression tests for the associations between MR-based abdominal and cardiac measures are shown in Tables 3, 4, 5 and 6. Results of reproducibility analyses are shown in the Additional file 1.
Table 3 Results of Associations between MR-based Abdominal and Cardiac Measures using Pearson Correlation TestsTable 4 Associations between MR-based Abdominal and Cardiac Measures by Multivariable Regression in Over-all CohortTable 5 Associations between MR-based Abdominal and Cardiac Measures by Multivariable Regression in Obesity SubgroupTable 6 Associations between MR-based Abdominal and Cardiac Measures by Multivariable Regression in Healthy Controls
留言 (0)