
記住我


This randomized controlled trial was conducted from February 2018 to April 2021 in the HIV clinic of the National Pediatric Hospital (NPH) in Phnom Penh, Cambodia. The original research plan included a 2-year intervention. However, owing to the coronavirus disease 2019 (COVID-19) pandemic, the endline study was postponed by 10 months. The study protocol has been published elsewhere [16].
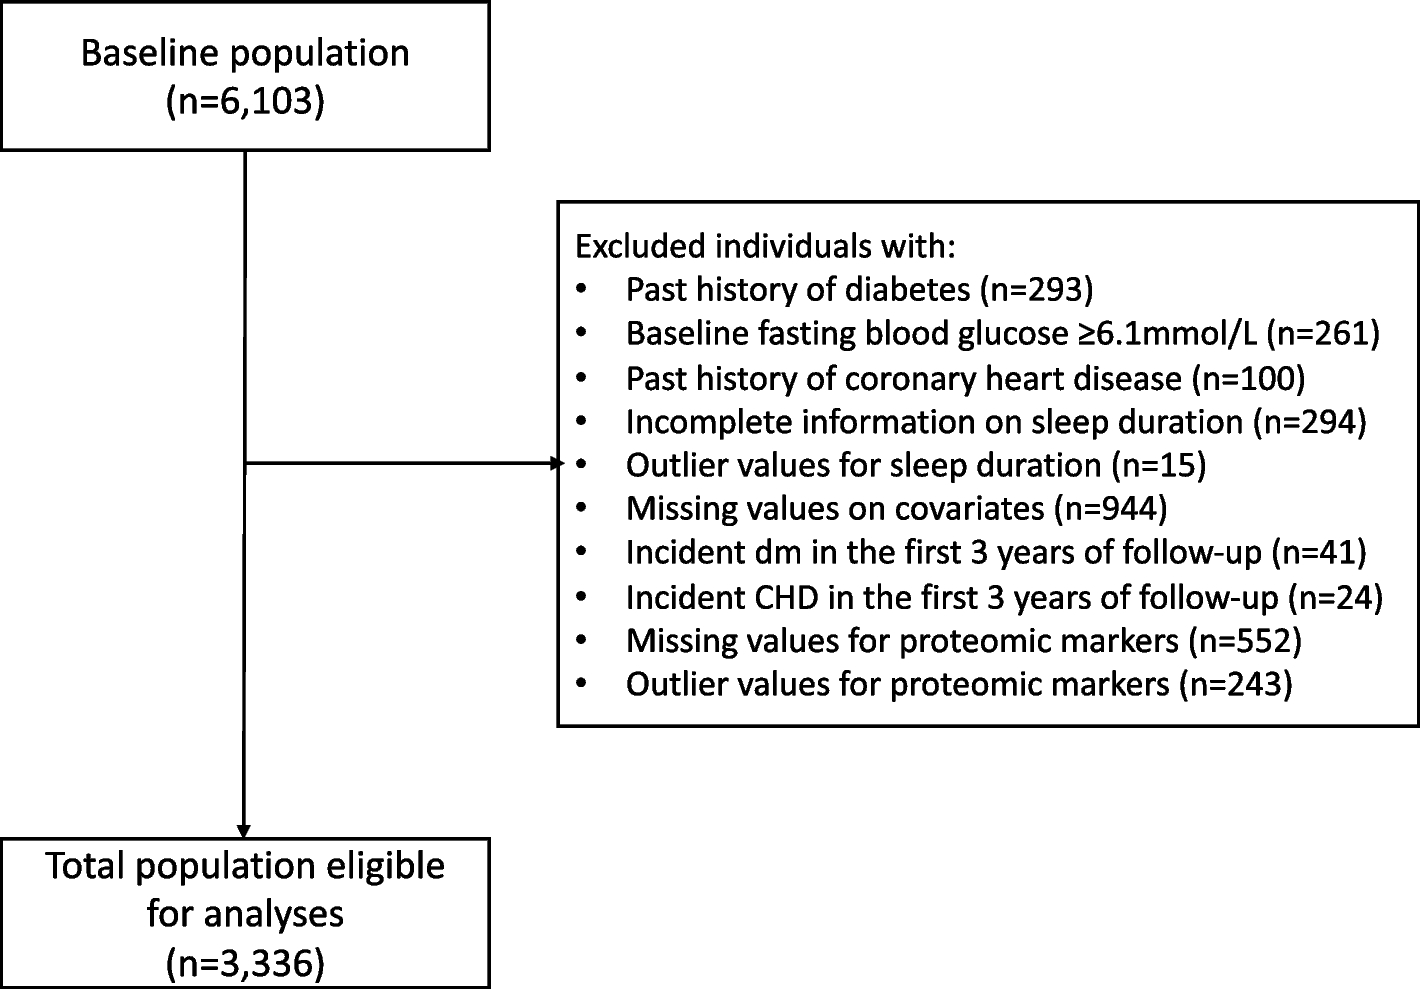
ParticipantsThe study population comprised children living with and without HIV. Of the 1113 eligible children in NPH, 482 were randomly included in the baseline survey (Fig. 1). Of the total, 160 and 168 children living with HIV were randomly assigned to the intervention (group A) and primary control (group B) arms, respectively. A second control arm was established, comprising 154 children without HIV (group C), to compare the oral health status of children living with HIV to that of children without HIV after the intervention. Moreover, primary caregivers of the children participated in the study as respondents in the baseline and endline surveys. The primary caregivers of group A attended regular oral health seminars alongside their children. The inclusion criteria for groups A and B were children aged 3–15 years at baseline and receiving HIV services at NPH at the baseline survey. Children in group C were in the same age group as those in groups A and B. In addition, they had not been diagnosed with HIV infection by the time of recruitment. The caregivers of all the children were eligible if they were the primary caregivers of the children and ≥ 18 years.
Fig. 1
Flow diagram of the participants
Sample sizeBefore the intervention, the minimum required sample size was 260 per group based on the decayed, missing, and filled permanent teeth (DMFT) score obtained from other studies [16, 17]. However, the number of children living with HIV aged < 8 years was less owing to recent improvements in preventing mother-to-child transmission in Cambodia. As a result, the sample size was re-estimated based on the DMFT scores collected at baseline. Thereafter, the minimum required sample size was 160 per group. A post hoc power analysis was conducted according to the DMFT/dmft scores obtained from the baseline (8.0, SD: 4.8) and endline (5.0, SD: 3.8) surveys. This estimation provided a power of ≥ 80% with an alpha of 5% and a two-tailed test. Thus, the sample size used had sufficient power.
Recruitment and randomizationChildren living with HIV were identified from the patient list of the NPH HIV clinic. The participants were randomly assigned to either the intervention or control group, allowing equal allocation of same-aged children. A computerized algorithm was used to perform randomization by a data analyst who was not a primary member of the study team. Three districts in Phnom Penh had the highest number of children living with HIV who participated in this study. We randomly selected one village from each of the three districts and randomly recruited eligible children without HIV using the resident lists obtained from the village heads. Participants’ enrollment and intervention assignment were not concealed due to the nature of the intervention design.
InterventionsThe children in group A and their caregivers received oral health education sessions every four months, with a total of six sessions during the intervention period. During the sessions presentation materials and videos (e.g., how to prevent dental caries and what food is good or bad for the teeth) were used (Additional file 1: Appendix 1) to enable the participants to practice daily home-based oral health care (e.g., effective tooth brushing and flossing). We added explanations and practices that take into account the child’s development stage (involvement of caregivers in tooth brushing according to the child’s age, changes in caries risk according to age, etc.). At each session, we provided participants with a toothbrush, fluoride-containing toothpaste (sodium fluoride: 1450 ppm), and dental floss. We did not provide any intervention or materials to participants in groups B and C. No dental treatment or check-ups were provided to any children. However, they were allowed to go to the dentist of their free will.
Outcome measuresThe primary outcome associated with oral health was the change in DMFT or the decayed, missing, and filled deciduous teeth (dmft) scores, and the secondary outcome was the viral load. Initially, the CD4 count was considered the secondary outcome. However, after initiating the study, only viral load was used to measure disease progression in children living with HIV in Cambodia. Therefore, viral load was used as the study outcome, as shown in the revised online protocol (ISRCTN15177479). For oral health outcomes, we collected data regarding oral hygiene indicators (salivary pH, salivary flow quantity, debris index score, and oral health-related QOL [OHQOL]) and oral healthcare behavioral indicators (dental visits, brushing frequency and duration, and oral care support from caregivers). To measure the overall health outcomes, we collected information regarding height for age, body mass index (BMI) for age, and overall QOL in addition to viral load.
Data collectionWe conducted the baseline surveys from February to April 2018 and the endline survey from February to April 2021. The children and their caregivers were interviewed using a structured questionnaire. We also collected data on children’s oral health status, weight, and height. For children in groups A and B, data regarding viral load were also collected from the medical records of NPH. Additional file 1: Appendix 2 presents the details of the collected data.
QuestionnaireTrained research assistants interviewed children and caregivers. The questionnaires collected information regarding the sociodemographic, oral care behavior, overall health-related QOL, and OHQOL.
Regarding oral healthcare behaviors, the participants were asked whether they had visited a dentist over the last 12 months owing to pain or other problems related to teeth, their frequency of brushing per day, duration of teeth brushing per occasion, and whether their caregiver had ever helped them with teeth brushing.
The overall health-related QOL was evaluated using the Pediatric Quality of Life Inventory (PedsQL™ 4.0) [18], which included 23 questions. The total score ranges from 0 to 100, with a higher score indicating higher overall health-related QOL. The OHQOL was assessed using the Child Perceptions Questionnaire 11–14 [19], which includes 16 questions with scores ranging from 0 to 64. We used it for children ≥ 6 years old because it was validated in the previous studies in Cambodia and New Zealand [19, 20]. A higher score indicates a lower OHQOL.
Registered medical recordsData regarding viral load were collected from the registered medical records of the NPH by research assistants. The latest information regarding viral load was obtained before the baseline survey and after the endline survey.
Oral status examinationTo evaluate children’s oral health status, we collected data regarding the number of DMFT/dmft, debris index, salivary pH, and salivary flow rate. A lower DMFT/dmft score and debris index, and a higher salivary flow rate and salivary pH indicated better oral health status. The dentists of NPH collected the complete oral health data with the help of dental assistants based on the WHO guideline [21]. The reproducibility of the intra- and inter-examiner ratings was evaluated. The dentists performed DMFT/dmft examinations on 10 children and made intergroup comparisons. The agreement rate of the results was ≥ 0.85. The debris index was calculated based on the amount of dental plaque on the dental surface. Data regarding salivary pH were collected using the salivary test kit (CAT21 Buf; Morita, Japan), which records pH values from 4.0 to 6.5. The total saliva quantity was calculated using the salivary flow data obtained after three minutes of tasteless chewing gum stimulation.
Body weight and heightData regarding children’s body weight and height were collected and converted to the Z-scores of height and BMI for age. The conversions were performed using WHO AnthroPlus (available at https://www.who.int/tools/growth-reference-data-for-5to19-years/application-tools).
Statistical analysesFirst, we conducted descriptive analyses of the basic characteristics of the participants. The outcomes were examined for data with normal distribution, and skewed data were log-transformed. Second, bivariate analyses were performed to identify differences in variables in the baseline survey between groups A and B and between groups A and C to evaluate the efficacy of the intervention in improving oral and overall health outcomes. Third, we conducted mixed-model analyses between groups A and B and between groups A and C. The model was adjusted for age, sex, intervention type (intervention or control), time (baseline or endline), and interaction between intervention type and time. Fourth, mixed-model analyses of group A were performed to assess the longitudinal association between changes in oral and overall health outcomes. In addition to oral health outcomes, the model was adjusted for age, sex, and time (baseline or endline). Each oral health outcome was assessed separately with the overall health outcomes to prevent multicollinearity. Oral health outcomes were examined for association with overall health outcomes with continuous variables, while the association with viral load was examined with a binary variable with the mean as the cutoff. We also stratified children’s dentition types at the baseline (mixed dentition and permanent teeth dentition) and performed above mentioned mixed model analyses. We did not conduct stratified analyses on the deciduous teeth dentition as the sample size was not large enough. The threshold for statistical significance was p-value < 0.05. All data analyses were performed using the SPSS software version 28.0 (SPSS Inc., Chicago, IL, the USA). Sensitivity analyses were conducted in the third and fourth steps with the generalized estimating equation model adjusted using the same variables as in the mixed-model analyses.
留言 (0)