
記住我


Early-onset scoliosis (EOS) is defined as a coronal spinal deformity that occurs before the age of 10 years1. Without early intervention, EOS can rapidly progress, leading to a risk of pulmonary dysfunction. Patients with severe EOS (sEOS) have a major Cobb angle of >80° in the coronal plane, which puts them at high risk for impaired pulmonary function because of the severe spinal deformity and thoracic constraints. Thus, surgical intervention is inevitable for patients with sEOS2.
The main objectives of the EOS treatment are to correct the deformity, allow continued growth of the spine, and improve and maintain the development of pulmonary function1,2. Growing rods (GRs) are the most commonly used technique employed for deformity correction. Dual growing rods (DGRs) have obvious advantages in controlling the progress of scoliosis and maintaining the development of pulmonary function compared with a single growing rod, especially for sEOS3–7. However, the long-term correction effects of DGRs in patients with sEOS and the changes in pulmonary function have yet to be clarified. This study aimed to evaluate the long-term outcomes (radiographic parameters and pulmonary function) after DGR treatment for sEOS.
Materials and Methods PatientsA retrospective review of consecutive cases was performed to identify patients with sEOS who underwent DGR treatment between October 2006 and May 2015 at our center. The main inclusion criteria were a diagnosis of sEOS and patient age of <10 years. The initial surgical procedure was DGRs, and patients who underwent at least 3 lengthening surgical procedures were included. The fixation instrumentation, 6.0-mm-diameter rods with tandem connectors, was composed of titanium. Radiographs and pulmonary function test results were available for all patients. This study was approved by the institutional review board of our center.
Clinical Data and Pulmonary Function ParametersClinical and demographic data, including age at the time of the initial surgical procedure, sex, diagnosis (congenital, idiopathic, neuromuscular, or syndromic), number of operations, final fusion status (fused or not fused), follow-up duration, lengthenings, and pulmonary dysfunction (none, mild, moderate, or severe), were evaluated. According to previous studies, total lung capacity (TLC), forced vital capacity (FVC), forced expiratory volume in 1 second (FEV1), FEV1 relative to FVC expressed as a percentage (FEV1/FVC%), residual volume (RV), and RV relative to TLC expressed as a percentage (RV/TLC%) were analyzed to quantify pulmonary function8. The results of pulmonary function tests were normalized according to age. We also analyzed the complications during the treatment and follow-up.
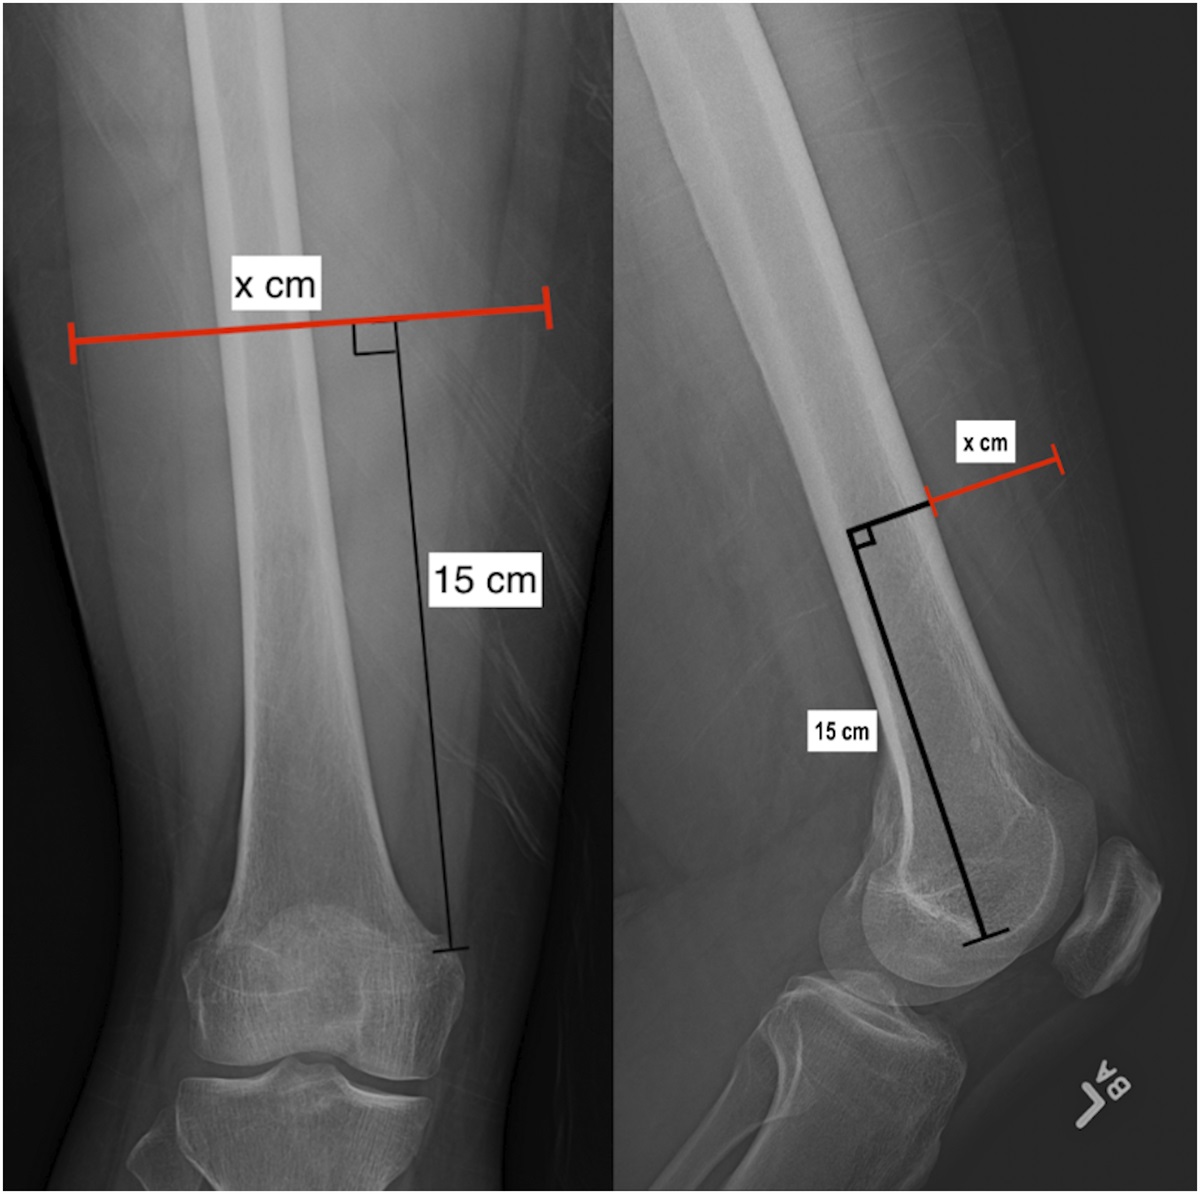
Radiographic ParametersAnteroposterior (AP) and lateral whole-spine radiographs were assessed, and the PACS (picture archiving and communication system) was used to measure the radiographic parameters. The AP radiographic measurements included the Cobb angle of the main curve in the coronal plane, T1-S1 height, and T1-T12 height. The lateral radiographic measurements included the angle of maximum kyphosis. T1-S1 height was measured as the perpendicular distance between the midpoint of the T1 upper end plate and the midpoint of the S1 upper end plate. The T1-T12 height was measured as the perpendicular distance between the midpoint of the T1 upper end plate and the midpoint of the T12 lower end plate.
Statistical AnalysisSPSS version 25.0 (IBM) was used for all statistical analyses. Descriptive statistics are reported as the mean and standard deviation. Categorical data are reported as the percentage and 95% confidence interval (CI). The changes in radiographic parameters and pulmonary function parameters between the time points (preoperative, postoperative, and last follow-up) were evaluated using the paired t test. Analysis of variance (ANOVA) was used for between-group comparisons of variables of interest. Pairwise comparisons, using the least significant difference (LSD) method, were performed when the results of ANOVA showed significance among the groups. Significance was set at p < 0.05.
Source of FundingThere was no external source of funding for this study.
ResultsAmong a total of 112 patients who were diagnosed with EOS and were treated with DGRs in our center between October 2006 and May 2015, 52 patients had sEOS. After screening for inclusion criteria, a total of 39 patients (17 [44%] female) were included and analyzed. The mean age of the cohort at the time of the initial surgical procedure was 7.7 ± 1.2 years (range, 5 to 9 years). There were 14 patients (36%) with congenital scoliosis, 22 (56%) with idiopathic scoliosis, 1 (3%) with neuromuscular scoliosis, and 2 (5%) with syndromic scoliosis. The patients were followed for a mean of 75.0 ± 14.1 months (range, 60 to 138 months). Twenty-five (64%) of the 39 patients underwent final fusion, at a mean age of 13.2 years. The remaining 14 patients did not undergo fusion surgery and will undergo the final fusion at an appropriate time. None of the patients underwent halo-gravity traction before the operation. The mean number of lengthenings was 4.5 ± 1.3 (range, 3 to 9). The mean interval between lengthenings was 11.2 months (range, 9 to 14 months). Of the 39 patients, 37 (95%) had pulmonary dysfunction; the restrictive ventilation dysfunction was mild in 24 (65%), moderate in 10 (27%), and severe in 3 (8%). A total of 17 complications, including 7 implant-related (6 rod breakages and 1 hook dislodgement), 8 cases of proximal junctional kyphosis (PJK), and 2 superficial wound infections, occurred in 12 (31%) of the 39 patients during the treatment period. The baseline information is summarized in Table I.
TABLE I - Baseline Information for the 39 Patients Age*(yr) 7.7 ± 1.2 Sex Male No. of patients 22 Percentage† 56.4 (40.0 to 70.7) Female No. of patients 17 Percentage† 43.6 (29.3 to 59.0) Scoliosis diagnosis Congenital No. of patients 14 Percentage† 56.4 (40.0 to 70.7) Idiopathic No. of patients 22 Percentage† 35.9 (22.7 to 51.6) Neuromuscular and syndromic 1 and 2 Percentage† 7.7 (2.7 to 20.3) Follow-up*(mo) 75.0 ± 14.1 Final fusion status Fusion No. of patients 25 Percentage† 64.1 (48.4 to 77.3) Not fused 14 No. of patients Percentage† 35.9 (22.7 to 51.6) No. of lengthenings* 4.5 ± 1.3 Interval between lengthenings*(mo) 11.2 ± 2.1 Pulmonary dysfunction None No. of patients 2 Percentage† 5.1 (1.4 to 16.9) Mild No. of patients 24 Percentage† 61.5 (45.9 to 75.1) Moderate No. of patients 10 Percentage† 25.6 (14.6 to 41.1) Severe No. of patients 3 Percentage† 7.7 (2.7 to 20.3) Complications Yes No. of patients 12 Percentage† 30.8 (18.6 to 46.4) No No. of patients 27 Percentage† 69.2 (53.6 to 81.4)*The values are given as the mean and the standard deviation. †The values are given as the percentage, with the 95% CI in parentheses.
The Cobb angle of the main curve in the coronal plane improved from 104.5° ± 18.2° preoperatively to 38.1° ± 10.1° after the initial surgical procedure (postoperatively) and 21.9° ± 8.6° at the final follow-up. At the final follow-up, the Cobb angle of patients who had not yet undergone fusion (21.0° ± 8.3°) was slightly smaller than that of patients who had undergone fusion (23.5° ± 9.2°); however, the difference was not significant. The percentage of improvement in the Cobb angle of the main curve in the coronal plane preoperatively to postoperatively and at the final follow-up was 63.3% ± 8.7% and 78.7% ± 8.3%. Similarly, the maximum kyphosis in the sagittal plane improved from 88.3° ± 23.7° preoperatively to 34.3° ± 11.3° postoperatively and 30.3° ± 7.7° at the final follow-up. The preoperative height was 25.1 ± 4.0 cm for T1-S1 and 15.0 ± 3.0 cm for T1-T12. The T1-S1 height improved to 32.4 ± 3.5 cm postoperatively and 39.5 ± 4.0 cm at the final follow-up, and the T1-T12 height improved to 20.3 ± 2.6 cm postoperatively and 25.5 ± 2.6 cm at the final follow-up. The radiographic parameters of all patients are summarized in Table II, and a typical case is shown in Figure 1.
TABLE II - Radiographic Parameters for the 39 Patients* Parameter Preop.† Postop.† Follow-up† Overall Pairwise P Values§ F P Value‡ Preop. vs. Postop. Preop. vs. Follow-up Postop. vs. Follow-up Cobb angle of the main curve (deg) Total 104.5 ± 18.2 38.1 ± 10.1 21.9 ± 8.6 441.491 <0.001 <0.001 <0.001 <0.001 Fused 21.0 ± 8.3 Not fused 23.5 ± 9.2 Correction of Cobb angle (%) — 63.3 ± 8.7 78.7 ± 8.3 — 0.024 — — — Maximum kyphosis (deg) 88.3 ± 23.7 34.3 ± 11.3 30.3 ± 7.7 164.334 <0.001 0.002 <0.001 0.262 TI-S1 height (cm) 25.1 ± 4.0 32.4 ± 3.5 39.5 ± 4.0 137.697 <0.001 <0.001 <0.001 0.043 ΔT1-S1 (cm) — 7.3 ± 2.5 14.4 ± 3.7 — <0.001 — — — TI-T12 height (cm) 15.0 ± 3.0 20.3 ± 2.6 25.5 ± 2.6 143.134 <0.001 <0.001 <0.001 0.039 ΔT1-T12 height (cm) — 5.3 ± 1.7 10.5 ± 2.6 — 0.004 — — —*Postop. = after initial surgery, follow-up = last follow-up, and Δ = change. †The values are given as the mean and the standard deviation. ‡Comparison across all 3 groups by ANOVA or between the postoperative group and the follow-up group by the paired t test; p < 0.05 indicates a significant difference. §Comparisons between groups by the LSD method; p < 0.05 indicates a significant difference.
 Fig. 1:
 Radiographs of an 8-year-old boy with severe EOS (idiopathic scoliosis). Preoperative total spine radiographs of the anteroposterior view (Fig. A) and the lateral view (Fig. B) showing that the Cobb angle of the main curve in the coronal plane was 122° and the maximum kyphosis in the sagittal plane was 113°. The preoperative bending view showing the poor flexibility of the main curve: left bending view (Fig. C) and right bending view (Fig. D). The postoperative total spine radiographs of the anteroposterior view (Fig. E) and the lateral view (Fig. F) showing that the Cobb angle improved to 48° and the kyphosis improved to 28° after DGR. The T1-T12 height improved from 17.1 cm to 22.5 cm and the T1-S1 height improved from 25.7 cm to 32.8 cm postoperatively. Total spine radiographs at the final follow-up of the anteroposterior view (Fig. G) and the lateral view (Fig. H) showing that the Cobb angle was 31° and the kyphosis was 25°. The T1-T12 height was 27.9 cm and the T1-S1 height was 37.5 cm.
The patients were divided into 3 groups according to the diagnosis, and the changes in correction and complications were analyzed. The results showed that the T1-S1 height preoperatively of patients in the congenital scoliosis (CS) group (25.1 ± 3.1 cm) was higher than that in the idiopathic scoliosis (IS) group (24.8 ± 4.3 cm), and the increase in the T1-S1 height postoperatively in the CS group (5.9 ± 1.9 cm) was lower than that in the IS group (8.4 ± 2.4 cm). The increase in the T1-S1 height at the last follow-up showed a similar difference between the 2 groups. The correction of the main curve after the initial operation in the CS group (59.4% ± 9.6%) was lower than that in the IS group (66.8% ± 6.9%). Other changes in correction and the incidence of complications did not show any difference among the 3 groups. The detailed data are summarized in Table III.
TABLE III - Comparison of Radiographic Parameters and Complications Among sEOS Diagnoses* Parameter CS (N = 14) IS (N = 22) NMS or SS (N = 3) ANOVA Pairwise P Values† F P Value‡ CS vs. IS IS vs. NMS or SS CS vs. NMS or SS Cobb angle§ (deg) Preoperative 98.7 ± 14.4 108.7 ± 20.1 100.9 ± 16.0 1.380 0.265 — — — Postoperative 40.1 ± 11.0 36.0 ± 9.4 44.5 ± 9.7 1.371 0.267 — — — Follow-up 23.2 ± 2.3 21.0 ± 8.5 22.1 ± 11.9 0.274 0.762 — — — Correction§ (%) Postoperative 59.4 ± 9.6 66.8 ± 6.9 56.2 ± 4.0 5.186 0.010 0.026 0.103 1.000 Follow-up 76.4 ± 8.4 80.3 ± 7.8 77.6 ± 11.9 0.972 0.288 — — — TI-S1 height§ (cm) Preoperative 25.1 ± 3.1 24.8 ± 4.3 26.9 ± 6.7 0.347 0.709 — — — Postoperative 30.9 ± 3.3 33.2 ± 3.2 33.6 ± 5.4 2.058 0.142 — — — Follow-up 37.4 ± 3.1 40.7 ± 4.0 40.7 ± 4.6 3.367 0.046 0.047 1.000 0.554 ΔT1-S1§ (cm) Postoperative 5.9 ± 1.9 8.4 ± 2.4 6.7 ± 2.5 5.603 0.008 0.006 0.686 1.000 Follow-up 12.4 ± 2.2 15.9 ± 3.2 13.7 ± 8.1 4.772 0.015 0.012 0.926 1.000 TI-T12 height§ (cm) Preoperative 14.8 ± 2.5 15.0 ± 3.2 16.5 ± 4.9 0.379 0.687 — — — Postoperative 19.5 ± 3.0 20.7 ± 2.1 21.7 ± 4.3 1.249 0.299 — — — Follow-up 24.5 ± 2.1 25.9 ± 2.5 27.8 ± 3.9 2.510 0.095 — — — ΔT1-T12 height§ (cm) Postoperative 4.7 ± 1.8 5.7 ± 1.7 5.2 ± 1.1 1.361 0.269 — — — Follow-up 9.7 ± 2.7 10.9 ± 2.2 11.3 ± 5.1 0.963 0.391 0.645 1.000 1.000 Complications — — — — — None No. of patients 7 13 2 Percentage# 50.0 (26.8 to 73.2) 59.1 (38.7 to 76.7) 66.7 (20.8-93.9) — — — — — Implant-related No. of patients 3 3 1 Percentage# 21.4 (7.6 to 47.6) 13.6 (4.8 to 33.3) 33.3 (6.1 to 79.2) — — — — — PJK No. of patients 3 5 0 Percentage# 21.4 (7.6 to 47.6) 22.7 (10.1 to 43.4) 0 (0 to 0.6) — — — — — Infection No. of patients 1 1 0 Percentage# 7.2 (1.3 to 31.4) 4.6 (0.8 to 21.8) 0 (0 to 0.6) — — — — —*Postoperative = after initial surgery, follow-up = last follow-up, Δ = change, NMS = neuromuscular scoliosis, and SS = syndromic scoliosis. †Comparisons between groups by the LSD method; p < 0.05 indicates a significant difference. ‡Comparison across all 3 groups by ANOVA; p < 0.05 indicates a significant difference. §The values are given as the mean and the standard deviation. #The values are given as the percentage, with the 95% CI in parentheses.
The study also evaluated changes in the results of pulmonary function testing (TLC, FVC, FEV1, FEV1/FVC%, RV, and RV/TLC%). Interestingly, we found that pulmonary function had improved at 12 months after the initial operation compared with the preoperative condition; however, the observed changes were not significant (p > 0.05) except for RV (p = 0.004). Of the 39 patients, 31 (80%) still had pulmonary dysfunction at 12 months after the initial surgical procedure, including 26 with mild, 4 with moderate, and 1 with severe dysfunction. However, pulmonary function had significantly increased at the last follow-up (p < 0.05) compared with preoperatively. At the last follow-up, 13 (33%) of 39 patients still had pulmonary dysfunction; however, it was mild in most of them (11 [85%] of 13). The pulmonary function results are summarized in Table IV, and the changes in the parameters are shown in Figure 2. We also divided the patients into 3 groups according to the diagnosis and found no difference in pulmonary function over time among the groups. The detailed data are summarized in Table V.
TABLE IV - Pulmonary Function Parameters of the 39 Patients* Parameter Preoperative Postoperative Follow-up ANOVA Pairwise P Values† F P Value‡ Preop. vs. Postop. Preop. vs. Follow-up Postop. vs. Follow-up TLC§ (L) 1.7 ± 0.5 1.9 ± 0.5 3.1 ± 0.7 61.680 <0.001 0.074 <0.001 <0.001 FVC§ (L) 1.2 ± 0.4 1.3 ± 0.4 2.2 ± 0.6 42.483 <0.001 0.121 <0.001 <0.001 FEV1§ (L) 1.0 ± 0.4 1.1 ± 0.4 1.9 ± 0.5 48.558 <0.001 0.170 <0.001 <0.001 FEV1/FVC§ (%) 84.6 ± 6.0 83.1 ± 7.3 86.3 ± 4.2 6.902 0.048 0.322 0.134 0.018 RV§ (L) 0.7 ± 0.2 0.8 ± 0.3 1.0 ± 0.3 14.461 <0.001 0.004 <0.001 0.012 RV/TLC§ (%) 38.7 ± 7.9 42.3 ± 7.9 32.8 ± 8.7 13.432 <0.001 0.057 0.002 <0.001 Pulmonary dysfunction — — — — — None No. of patients 2 8 26 Percentage# 5.1 (1.4 to 16.9) 20.5 (10.8 to 35.6) 66.7 (51.0 to 79.4) — — — — — Mild No. of patients 24 26 11 Percentage# 61.5 (45.9 to 75.1) 66.7 (51.0 to 79.4) 28.2 (16.6 to 43.8) — — — —
留言 (0)