
記住我


KEY POINT
Question: Is traumatic rhabdomyolysis associated with hepatic biomarkers and liver failure?
Findings: Severe rhabdomyolysis is specifically correlated with elevated hepatic biomarkers and failure, increased morbidity, and a longer intensive care unit (ICU) stay.
Meaning: Traumatic rhabdomyolysis appears to be associated with organ damage beyond renal failure, as it is associated with liver damage and increased morbidity.
Trauma is the leading cause of death in young adults (15–49 years old).1 Nearly 25% of trauma mortality is considered preventable or potentially preventable. This mortality is mainly due to hemorrhage and traumatic brain injury.2,3 It is also burdened by comorbidities that occur during hospitalization, particularly in intensive care. Beyond these comorbidities, rhabdomyolysis (RM) is a common condition in trauma patients. It is usually defined by a serum creatine kinase (CK) level >1000 U/L.4
RM in trauma can be multifactorial: direct lesion (crush syndrome, extended limb trauma, and entrapment) and/or indirect muscle injury secondary to massive hemorrhage. Up to 85% of trauma patients are reported to have elevated CK levels; however, the exact frequency of RM is unknown. Compared with other causes (eg, drugs, medications, and infection), traumatic RM represents <20% of all causes of RM.4
Acute kidney injury is the first RM complication and appears in 10% to 55% of RM patients.5 RM has been mostly studied through the lens of kidney injury.
RationaleThe pathophysiology of RM is not fully understood; numerous pathways are implicated and can all be heightened in case of severe trauma, underlying the importance of studying this specific population.4,6 Recent developments have highlighted the implications of neutrophil extracellular traps and the complement pathway.7,8 However, most of the known pathophysiology is based on the axis of myoglobin release and the heme/iron axis. Heme and iron are implicated in diverse organ aggression in multiple diseases. More importantly, the discover of ferroptosis, a type of cell death due to lipid peroxidation, supports the hypothesis that RM could induce multiple organ injury far beyond the classic kidney injury.9 Kodadek et al,4 in the most recent American Association for the Surgery of Trauma guidelines regarding RM published in 2022, mentioned an association with liver failure, estimating its frequency to be 25% in cases of RM, even if evidence is lacking. Few works have described an association between liver enzymes and RM, suggesting a potential role in the development of liver failure that could influence the management of patients with RM.10–13
Study PurposeThe aim of this study was to evaluate the relationship between liver function and RM in hemorrhagic trauma patients. Additional aims were to describe RM characteristics in hemorrhagic trauma patients, to describe the association between RM and renal function, and to describe the impact of RM on specific outcomes: mortality on day 1 and day 28, intensive care unit (ICU) length of stay (LOS), ventilator-free days until day 28, requirement of renal replacement therapy (RRT) during ICU stay, and 24-hour transfusion requirement.
METHODSThis study received approval from the Research Ethics Committee of the French Society of Anesthesia and Intensive Care, institutional review board (IRB) 00010254-2022-082. This study follows STrengthening the Reporting of OBservational studies in Epidemiology (STROBE) recommendations. Written informed consent was waived by the IRB according to the French law, as this study only used retrospective data recorded during routine care. However, patients have been informed of the use of their anonymized medical information and of their ability to freely object to it.
Study LocationThis retrospective study was conducted at the Percy Military Training Hospital, 1 of 6 level I trauma centers in the Paris area.
PatientsAll trauma patients who required labile blood product (LBP) transfusion within the first 24 hours after arrival at the trauma center and who were admitted to the ICU were included in the study. Criteria for noninclusion were patients under 18 years of age, prisoners, and pregnant women. Patients with liver trauma responsible for an abdominal Abbreviated Injury Score [AIS] ≥3 were excluded. Patients admitted between January 2015 and June 2021 were included in the study.
Data CollectionEpidemiological, clinical, and transfusion data were collected anonymously from the local hospital information system (AMADEUS 2, McKesson). Information on demographic characteristics, initial hospital clinical data, and initial standard blood tests were recorded. Patient outcomes were recorded: ICU LOS and observed mortality on days 1 and 28. Transfusion data included numbers and types of LBP administered. Biologic data (aspartate aminotransferase [AST], alanine aminotransferase [ALT], alkaline phosphatase [ALP], gamma-glutamyl transferase [GGT], bilirubin, creatinine level, urea, CK, myoglobin, prothrombin time [PT] ratio, and factor V) were recorded during the first 5 days or until death or discharge from the ICU if they occurred before day 5. The PT-ratio was used rather than the international normalized ratio because it is not part of the coagulation tests commonly performed on trauma patients in France and in our hospital.
The following data were calculated: Injury Severity Score (ISS), Sepsis-related Organ Failure Assessment (SOFA) score, and Simplified Acute Physiology Score II (SAPS II) on day 1.14,15
Regarding transfusion management, whenever possible, LBPs were ordered in advance using the Red Flags score.16,17 In accordance with French recommendations, transfusion was initiated on arrival of the patient in case of hemorrhagic trauma with hemodynamic instability. Otherwise, the threshold observed for red blood cell (RBC) transfusion was a hemoglobinemia >7 g/dL for most patients and >10 g/dL for those with traumatic brain injury.18
DefinitionsShock on admission was defined as a shock index >0.9, admission blood lactate dosage >5 mmol/L, and/or the need for vasopressors.
Massive transfusion (MT) was defined as ≥10 RBC units transfused within 24 hours.
Traumatic brain injury was defined as head AIS >3.
Liver failure during ICU stay was defined as simultaneous PT-ratio ≤50% concurrent with liver cytolysis (peak ALT ≥500 U/L) during the first 5 days.
RM was defined as serum CK >1000 U/L and was qualified as “intense” for serum CK >5000 U/L.
Trauma-induced coagulopathy (TIC) was defined as PT-ratio <50% without anticoagulant therapy at admission.
The vasopressor dose regimen was calculated by dividing the total dose of epinephrine and norepinephrine administered during the stay by patients’ weight and the LOS in the ICU (µg/kg/ICU days).
As proposed by several authors, we have used normalized potential liver damage to the level of RM by measuring the CK/ALT ratio. This ratio is suggestive of liver damage when it is decreased.13,19
Statistical AnalysisData were collected using Excel version 16.9 (Microsoft Corporation). Statistical analysis was performed using R software version 4.1.2 for Macintosh (R Foundation for Statistical Computing). Data are summarized as median (interquartile range [IQR]) for quantitative variables and percentage for qualitative variables. Depending on the type of variable, their distribution, and the number of patients, the tests used were the Fisher exact test, χ2 test, Student t test, or Mann-Whitney U test for bivariate analysis. Statistical significance was defined as P < .05.
For the comparison of biological variables over time, because of an unbalanced design due to the retrospective scheme of the study, we conducted linear mixed-effect models. We designated the subjects as a random effect (random intercept), while the time and group (including their interaction term) were treated as fixed effect. For variables significantly influenced by RM level, we conducted pairwise between-group (ie, presence or absence of intense RM) comparisons at the different time points with Bonferroni adjustment.20
Correlation analysis was performed using Pearson’s or Spearman’s coefficient depending on the distribution after log transformation to evaluate the association between serum CK and biological markers of renal and hepatic function.
To evaluate the independent predictors of liver failure, a stepwise selection method (backward/forward) for logistic regression model based on Akaike information criterion (AIC) was used. Clinically relevant explanatory risk factors that had a P <.05 in the bivariate analysis were included in the model. To investigate the potential confounding factor of TIC, whose definition overlaps with that of liver failure in our work, we decided to add it to the logistic regression model after the stepwise regression procedure. The degree of multicollinearity between the predictor variables included in the logistic regression was assessed using the variance inflation factor (VIF). A VIF <5 was assumed to exclude significant collinearity.
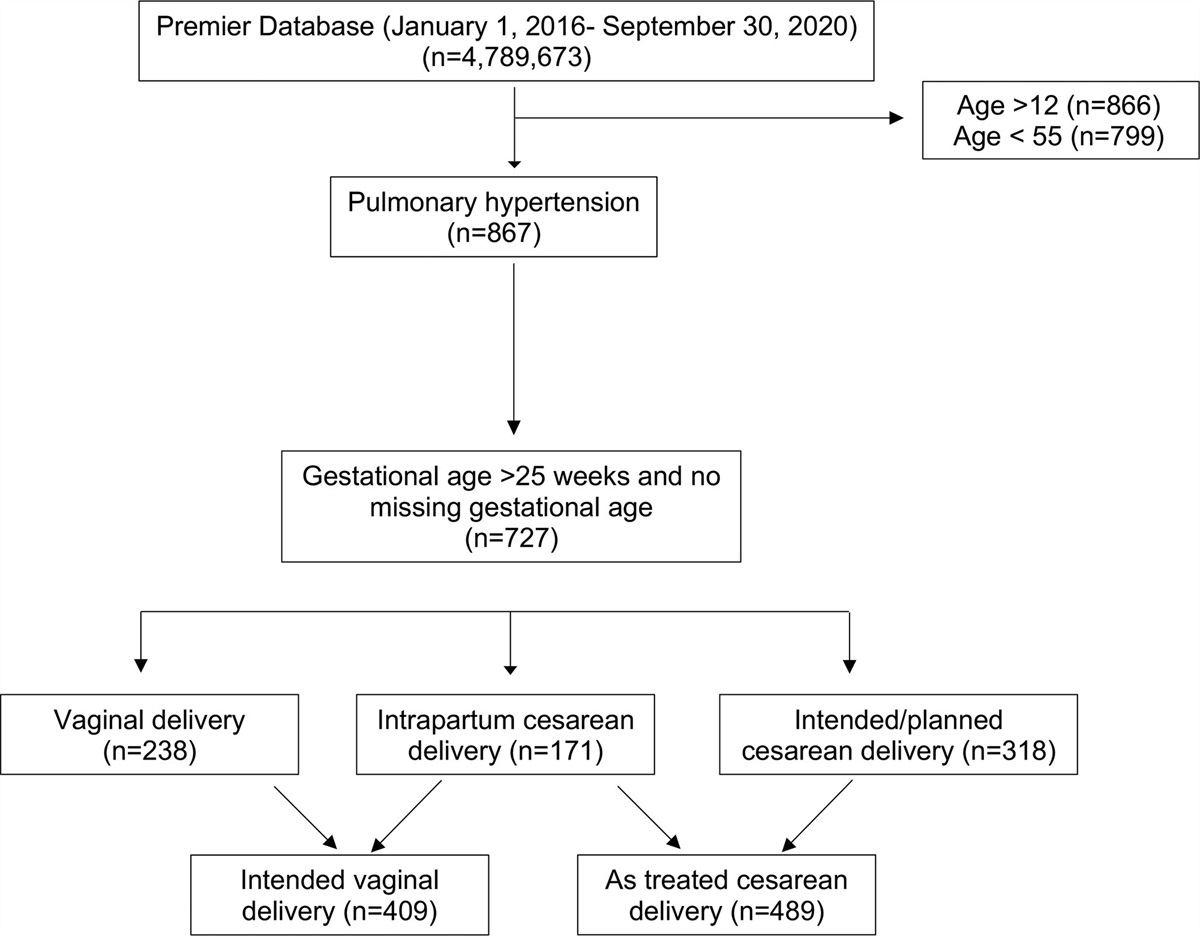
RESULTSBetween January 2015 and June 2021, 1805 trauma patients were admitted to our level 1 trauma center, of whom 709 were admitted to the ICU. After application of exclusion criteria, 237 patients were included in the analysis (Supplemental Digital Content 1, Figure 1, https://links.lww.com/AA/E218).
Patient characteristics on hospital admission are presented in Table 1. The median age was 41 (26–57) years old, and almost 75% of the patients were male. Patients were severely injured, with a median ISS of 26 (17–35). RM was highly prevalent in the global cohort (58.1%), and 55 (23.2%) patients presented with intense RM. In the intense RM group, patients were more frequently men, younger, and presented higher ISS and SOFA score on day 1 (Table 1).
Table 1. - Patient Characteristics on Admission According to the Presence of an Intense RM (CK > 5000 U/L) CK >5000 U/L Characteristic Overall, N = 272a No, n = 217a Yes, n = 55a P valueb Missing values Sex .005 0 F 70 (25.7) 64 (29.5) 6 (10.9) M 202 (74.3) 153 (70.5) 49 (89.1) Age 41.0 (26.0–57.2) 44.0 (28.0–62.0) 30.0 (21.5–43.0) <.001 0 Shock index 0.8 (0.7–1.1) 0.8 (0.6–1.0) 0.9 (0.7–1.3) .003 9 Mechanical ventilation 152 (55.9) 119 (54.8) 33 (60.0) .5 0 Vasopressor support 105 (38.6) 82 (37.8) 23 (41.8) .6 0 Shock on admission 118 (43.4) 91 (41.9) 27 (49.1) .3 0 Penetrating trauma 62 (22.8) 50 (23.0) 12 (21.8) .8 0 TBI 108 (39.7) 88 (40.6) 20 (36.4) .6 0 CK >1000U/L 158 (58.1) 103 (47.5) 55 (100.0) <.001 0 SAPS II 42.5 (31.0–56.8) 43.0 (32.0–56.5) 41.0 (29.5–55.0) .5 2 SOFA on day 1 7.0 (4.0–10.0) 6.0 (4.0–10.0) 8.0 (5.5–11.0) .012 1 ISS 26.0 (17.0–35.0) 26.0 (16.2–34.0) 30.0 (21.0–37.0) .027 3 Head AIS 2.0 (0.0–4.0) 2.0 (0.0–4.8) 0.0 (0.0–3.0) .14 19 Face AIS 0.0 (0.0–1.0) 0.0 (0.0–1.0) 0.0 (0.0–1.0) .9 19 Thorax AIS 2.0 (0.0–3.0) 0.5 (0.0–3.0) 3.0 (1.5–4.0) .002 19 Abdo AIS 0.0 (0.0–3.0) 0.0 (0.0–2.0) 0.0 (0.0–3.0) .3 19 Extremity AIS 2.0 (0.0–3.0) 2.0 (0.0–3.0) 3.0 (2.0–4.0) <.001 19 Skin AIS 1.0 (0.0–2.0) 1.0 (0.0–1.8) 1.0 (0.0–2.0) .5 19 Anticoagulant therapy 8 (2.9) 7 (3.2) 1 (1.8) >.9 0 TIC 44 (16.2) 30 (13.8) 14 (25.5) .036 0Abbreviations: AIS, Abbreviated Injury Score; CK, creatine kinase; IQR, interquartile range; ISS, Injury Severity Score; RM, rhabdomyolysis; SAPS II, Simplified Acute Physiology Score II; SOFA, Sepsis-related Organ Failure Assessment score; TBI, traumatic brain injury; TIC, traumatic-induced coagulopathy.
an (%); median (IQR).
bPearson’s χ2 test; Wilcoxon rank sum test; Fisher exact test.
Median CK and myoglobin levels on admission in the overall cohort were 1289.0 U/L (542.0–2917.5) and 1343.0 U/L (611.0–3179.3), respectively. AST, ALT, and bilirubin levels on admission were 41.5 U/L (22.5–81.8), 67.0 U/L (37.0–131.2), and 14.0 µmol/L (9.0–22.5), respectively. Except for bilirubin, all the biological admission levels were significantly higher in the intense RM group than that in the no intense RM group (Supplemental Digital Content 2, Table 1, https://links.lww.com/AA/E219).
Consistently with groups’ definitions, CK and myoglobin peaks were significantly higher in the intense RM group than that in the group without intense RM with, respectively, 1271 UI/L [498–2565] vs 8258 UI/L [6300–24185] (P < .001) for CK and 793 UI/L [442–1414] vs 4560 UI/L [2631–10490] (P < .001) for myoglobin. Patients who developed intense RM had significantly higher peaks for AST (117 UI/L [57–449] vs 37 UI/L [23–79, P < .001]), ALT (68 UI/L [42–124] vs 233 UI/L [154–1282], P < .001), urea (5.9 mmol/L [4.5–8.1] vs 6.5 mmol/L [5.8–9.1], P = .02), and creatinine (83 µmol/L [68–107] vs 103 µmol/L [83–147], P < .001; Table 2). ALP and bilirubin peaks were higher in the intense RM group compared with the no intense RM group but did not reach statistical significance. Intense RM patients had a significantly lower PT-ratio of 55.0% (43.2–62.8) compared with 65.0% (54.0–76.0) among patients without intense RM (P < .001). There was no significant difference in factor V level in both groups, but it was only measured in 17 patients, of whom 9 had intense RM. Peak laboratory values during the first 5 hospital days are presented in Table 2.
Table 2. - Extremes Laboratory Values From Admission to Day 5 According to the Presence of an Intense RM (CK >5000 U/L) CK >5000 U/L Characteristic No, n = 217a Yes, n = 55a P valueb Peak CK (U/L) 1271.0 (498.0–2564.5) 8258.0 (6299.5–24,185.0) <.001 Peak myoglobin (µg/L) 793.0 (422.0–1414.0) 4559.5 (2630.8–10,489.8) <.001 Peak ALT (U/L) 68.0 (42.0–124.0) 233.0 (154.0–1282.0) <.001 Peak AST (U/L) 37.0 (23.0–79.0) 117.0 (57.0–449.0) <.001 Peak GGT (U/L) 35.5 (19.8–80.8) 36.5 (22.8–84.8) >.9 Peak ALP (U/L) 60.0 (47.0–87.0) 84.0 (46.0–116.0) .056 Peak bilirubin (µmol/L) 15.0 (11.0–25.0) 21.0 (12.0–35.0) .074 Minimal PT-ratio (%) 65.0 (54.0–76.0) 55.0 (43.2–62.8) <.001 Minimal factor V (%) 41.0 (25.0–56.0) 43.0 (32.0–74.0) .6 Peak urea (mmol/L) 5.9 (4.5–8.1) 6.5 (5.8–9.1) .020 Peak creatinine (µmol/L) 83.0 (68.0–106.5) 103.0 (82.5–146.5) <.001Abbreviations: CK, creatine kinase; ALP, alkaline phosphatase; ALT, alanine aminotransferase; AST, aspartate aminotransferase; CK, creatine kinase; GGT, gamma-glutamyl transferase; IQR, interquartile range; PT, prothrombin time; RM, rhabdomyolysis.
aMedian (IQR).
bWilcoxon rank sum test.
We observed a statistical difference in the kinetics of AST, ALT, PT-ratio, CK, and myoglobin throughout the first 5 days of ICU stay according to the group to which the patients belonged (Figure; Supplemental Digital Content 3, Figure 2, https://links.lww.com/AA/E220). In the intense RM group, the highest median was measured for transaminases (ALT: 306.0 U/L [93.5–902.5]; and AST: 932.0 U/L [182.0–1641.5]) on day 3 and for CK on day 4 (12,535.0 U/L [4765.5–38,355]) The median PT-ratio was lowest on day 2 (58.0% [47.5–64.5]).
 Figure.:
 Evolution over time of blood levels of different biomarkers between admission (T0) and the fifth ICU-day, according to the RM group. A, AST, U/L. B, ALT, U/L, C, CK, U/L. D, PT ratio (%). Comparison between RM groups was performed with a linear mixed effect model and post hoc pairwise comparison with Bonferroni adjustment. *P <.05; **P <.01; ***P <.001. ALT indicates alanine aminotransferase; AST, aspartate aminotransferase; CK, creatine kinase; PT, prothrombin time; RM, rhabdomyolysis.
We found a significant positive correlation between RM biomarkers (CK and myoglobin) and liver biomarkers (AST, ALT, and bilirubin). Log-CK was positively correlated with log-AST (r = 0.625, P < .001), log-ALT (r = 0.507, P < .001) and moderately correlated with log-bilirubin (r = 0.262, P < .001). This correlation was also observed with renal biomarkers. Log-CK was correlated with log-urea (r = 0.18, P < .001) and log-creatinine (r = 0.383, P < .001). The strength of liver biomarker correlation with CK was not very intense but was greater than the correlation between CK and renal biomarkers. Significant correlations were also observed between myoglobin and renal biomarkers and between myoglobin and hepatic biomarkers (Supplemental Digital Content 4, Figure 3, https://links.lww.com/AA/E221). The CK/ALT ratio was smaller among patients with liver failure (4 [1–24] vs 34 [14–86], P < .0001).
ICU stays were longer for intense RM patients compared with the no intense RM group (7 [4–18] days vs 4 [2–11] days, P < .001). Intense RM patients required more RRT (4.1% vs 20.0%, P < .001) and had a higher incidence of liver failure (4.6% vs 18.2%, P < .001) compared with the no intense RM group. Mortality was not significantly different between both groups. There was no significant difference in ventilatory and hemodynamic support (Table 3). MT was more frequently required in the intense RM group (18.2% vs 7.8%, P = .022), while global transfusion requirements were also greater in the intense RM group (24 hours total LBP transfusion 10 [2–15] vs 4 [1–10], P = .002) (Table 4). This significant difference was also observed for RBC units, plasma units, and platelet units at 24 hours (Table 4).
Table 3. - Liver Failure: Bivariate Analysis According to the Presence of Liver Failure Liver failure Characteristic No, n = 252a Yes, n = 20a P valueb CK >1000 U/L 138 (54.8) 20 (100.0) <.001 CK >5000 U/L 45 (17.9) 10 (50.0) .002 ISS 26 (17–34) 32 (21–39) .084 SOFA on day 1 6 (4–9) 13 (10–17) <.001 SAPS II 40 (31–55) 62 (53–69) <.001 Shock on admission 103 (40.9) 15 (75.0) .003 TIC 32 (12.7) 12 (60.0) <.001 Anticoagulant therapy 6 (2.4) 2 (10.0) .110 Vasopressor total dose (µg/kg/ICU days) 14 (0–65) 470 (69–3733) <.001 Massive transfusion 20 (7.9) 7 (35.0) .001 Total LBPs transfused at 24 h 4 (1–11) 13 (10–25) <.001 RRT 10 (4.0) 10 (50.0) <.001 VFD 26 (13–27) 0 (0–14) <.001 Death on day 1 11 (4.4) 4 (20.0) .017 Death on day 28 38 (15.1) 12 (60.0) <.001 CK/ALT 34 (14–86) 4 (1–24) <.001Abbreviations: CK, creatine kinase; ICU, intensive care unit; IQR, interquartile range; ISS, injury severity score; LBP, labile blood product; LOS, length of stay; RRT, renal replacement therapy; SAPS II, Simplified Acute Physiology Score II; SOFA, Sepsis-related Organ Failure Assessment score; TIC, traumatic induced coagulopathy; VFD, ventilator-free day.
an (%); median (IQR).
bPearson’s χ2 test; Fisher exact test; Wilcoxon rank sum test.
Abbreviations: CK, creatine kinase; ICU, intensive care unit; IQR, interquartile range; LBP, labile blood product; LOS, length of stay; RBC, red blood cell; RRT, renal replacement therapy; VFD, ventilator-free day.
aMedian (IQR); n (%).
bWilcoxon rank sum test; Fisher exact test; Pearson’s χ2 test.
In bivariate analysis, all patients with liver failure presented with RM and half of them with intense RM (Table 3). Liver failure patients had more TIC, vasopressor requirements, mechanical ventilation support, and RRT. In contrast to the ISS, the ICU severity scores (SOFA and SAPS II) were higher in patients with liver failure. Early and late mortality were higher for these patients (Table 3).
After the stepwise regression step, 5 factors were selected to minimize the AIC (intense RM, SOFA on day 1, vasopressor use, RRT use, and ventilator-free day [VFD]). As described in the statistical analysis plan, TIC was added to these factors.
Table 5. - Liver Failure—Logistic Regression Univariable analysis Multivariable analysis Characteristic OR 95% CI P value OR 95% CI P value VIF CK >5000 U/L 4.60 1.79–11.9 .001 4.51 1.11–19.2 .034 1.3 ISS 1.03 1.00–1.06 .048 SOFA on day 1 1.37 1.23–1.56 <.001 1.18 1.01–1.38 .035 1.3 SAPS II on day 1 1.05 1.03–1.08 <.001 Shock on admission 4.34 1.63–13.7 .006 TIC 10.3 3.97–28.2 <.001 2.01 0.51–7.47 .3 1.3 Norepinephrine dose (µg/kg/ICU days) 1.00 1.00–1.00 <.001 1.00 1.00–1.00 .2 1.3 Massive transfusion need 6.25 2.14–17.2 <.001 Total LBP transfusion within 24 h 1.07 1.04–1.11 <.001 RRT 24.2 8.29–73.6 <.001 4.32 1.02–17.6 .048 1.1 VFD 0.90 0.86–0.94 <.001 0.95 0.89–1.01 .10
留言 (0)