
記住我


The present study was approved by the local institutional review board. Informed consent was obtained from all enrolled participants following the Declaration of Helsinki.
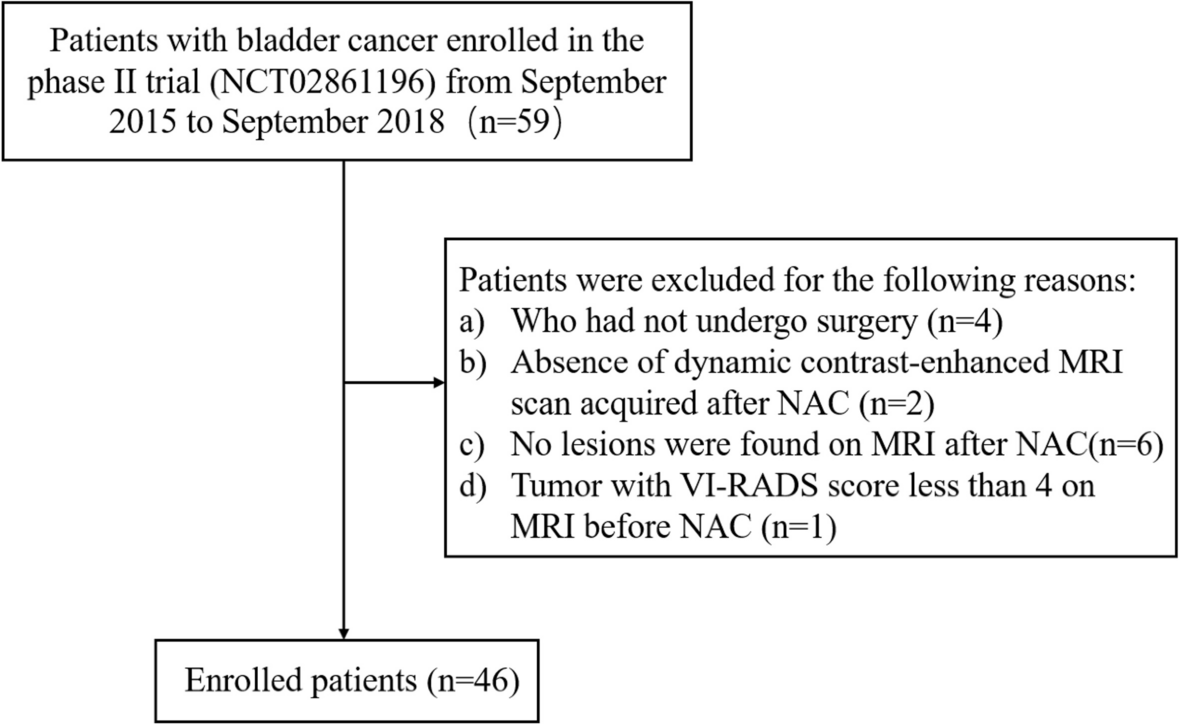
Study populationA total of 174 participants with unspecific abdominal pain who had undergone clinically indicated third-generation dual-source DECT and 3-Tesla MRI at the University Hospital Frankfurt (Frankfurt am Main, Hesse, Germany) between November 2014 and October 2022 were initially considered for study inclusion. To limit possible distortion of statistics between DECT and MRI, we included only data from patients with an examination interval of up to 14 days between the two examinations. Indications to perform an additional MRI scan to DECT included 1) the need for a better characterization of tumor tissue, e. g. the infiltration into adjacent structures, 2) short-term follow-up with concerns about ionizing radiation for another CT imaging, and 3) suboptimal CT findings with a high clinical suspicion of pancreatic cancer. Exclusion criteria were artifacts (n = 7) and previous local surgery (n = 24). The final study cohort consisted of 143 patients, of whom 83 received a final diagnosis of histologically proven pancreatic cancer (12 of 83 patients were prospectively enrolled for data validation purposes). Another 40 participants had normal pancreatic parenchyma and served as the comparative group, including individuals with gastritis (n = 16), gastroesophageal reflux disease (n = 11), constipation (n = 6), gastroenteritis (n = 5), or inflammatory bowel disease (n = 2). 20 participants were finally diagnosed with pancreatitis. For retrospective analysis, suitable patients were identified in the picture archiving and communication system (Centricity 4.2; GE Healthcare, Chicago, USA) by searching for the following terms: ‘pancreatic cancer’, ‘pancreatitis’, ‘normal pancreatic parenchyma’, ‘pancreatic adenocarcinoma’, and ‘pancreatic neuroendocrine tumor’. Exclusion criteria were previous tumor resection, imaging artifacts, stent material, or pancreatolithiasis. Figure 1 illustrates the selection process of participants in this study.
Fig. 1
Flowchart of patient inclusion
Standard of referenceThe final adjudicated diagnosis was based on the histological confirmation in all cases of pancreatic cancer, as well as on clinical and imaging findings at discharge. All data were extracted from medical reports and multidisciplinary tumor board meetings. Tumors were graded according to the 8th edition of TNM classification (clinical and pathological) [18]. The primary endpoint was all-cause mortality. Follow-up was performed by thoroughly checking outcome information including medical reports and external files from referring hospitals. Patient outcome was also collected by phone interviews and questionnaires.
Dual-energy CT protocolAll CT examinations were performed on a third-generation dual-source DECT scanner equipped with a Somatom Force unit (Siemens Healthineers, Forchheim, Bavaria, Germany). The examination parameters were as follows: tube A, 90 kVp and 220 mAs; tube B, Sn150 kVp [0.64 mm tin filter] and 138 mAs; collimation of 2 × 192 × 0.6 mm; rotation time of 0.5 s; pitch of 0.6. Real-time automatic tube current modulation was applied (CARE Dose 4D; Siemens Healthineers). Images were reconstructed with a slice thickness of 2 mm in 2 mm intervals using advanced modeled iterative reconstruction (ADMIRE, Siemens Healthineers) with a medium smooth reconstruction kernel (Br40). A nonionic intravenous contrast medium was administered (Imeron 400, Bracco, Milan, Italy) at a flow rate of 3 mL/second (dose of 1.2 mL/kg body weight).
All examinations consisted of a standardized triphasic pancreatic mass protocol, including a noncontrast, pancreatic arterial (PAP), and portal venous phase (PVP). Applying bolus triggering, PAP was acquired with a 5-s delay after aortic threshold enhancement of 100 HU. Given greater contrast ratios between tumor and adjacent parenchyma, PAP scans were used consistently for texture analysis.
Image segmentation and analysisTwo experienced radiologists (M.H.A. and V.K. with 6 and 4 years of radiomics experience, respectively) performed image segmentation and analysis. After the upload of CT datasets into 3D slicer software (3D slicer 4.6.2., Harvard University, Cambridge, USA), each segmentation was accomplished by a semi-automatic method for pancreatic structure assessment using the interactive segmentation algorithm GrowCut, as previously described [19,20,21]. After data upload, the first reliable 3D segmentation model of the pancreatic formation was obtained by adding a small subset of label points with the automated reconstruction of the remaining image. The algorithm iteratively labeled all points using a weighted similarity score comprising all pixels in the adjacent tissue. After successful segmentation and visual inspection, areas with artifacts or calcifications were manually removed. Case examples are illustrated in Figs. 2 and 3.
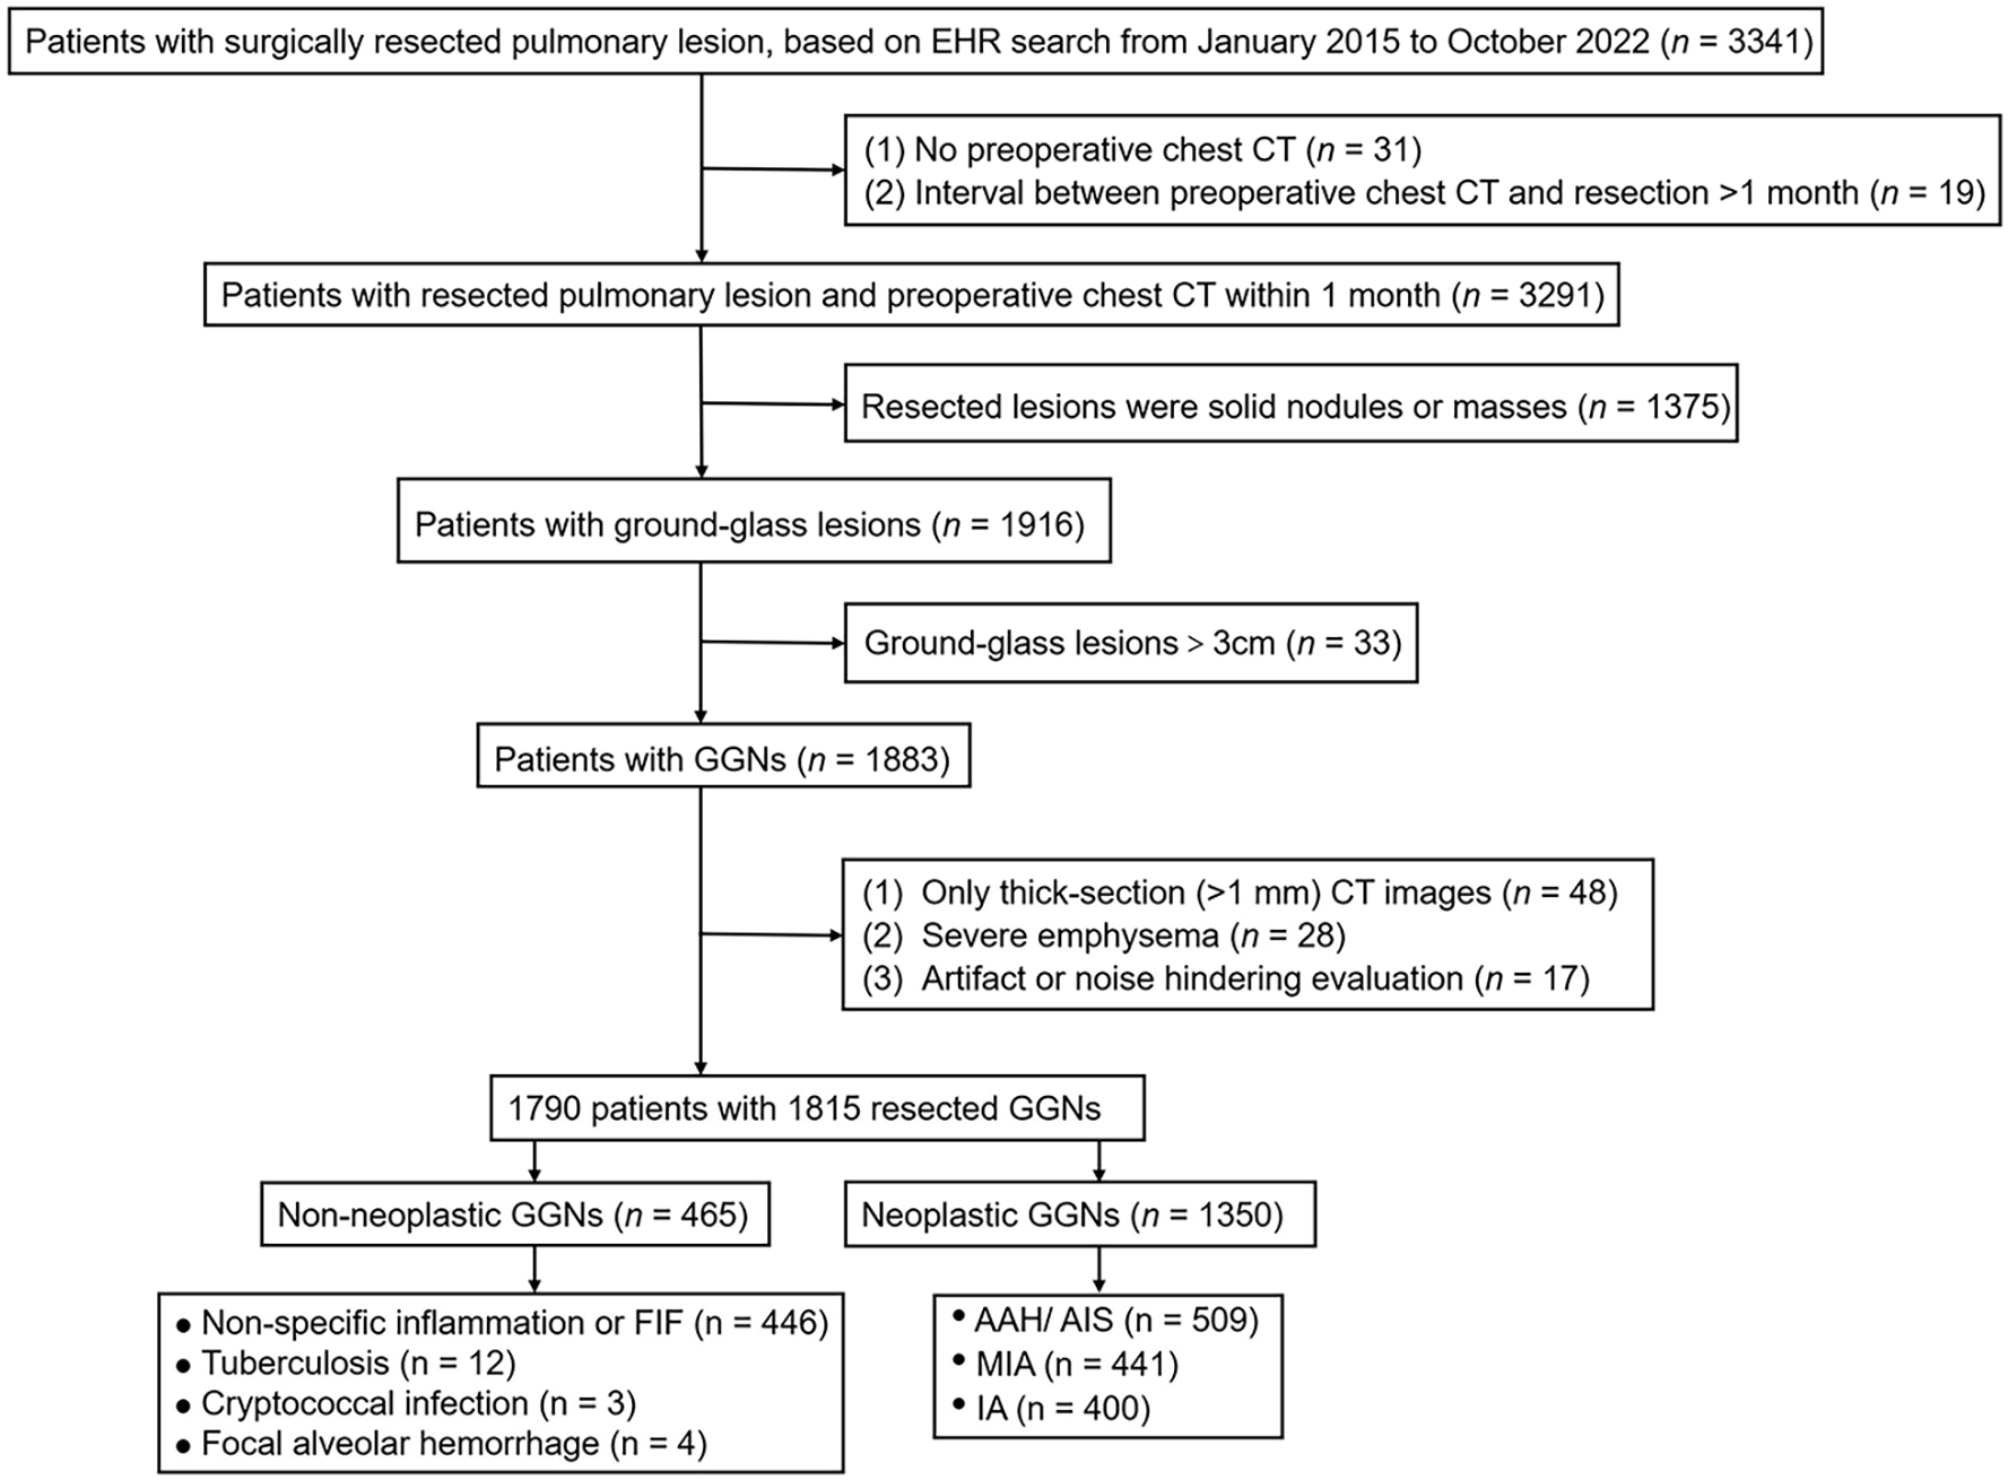
Fig. 2
Case of a 50-year-old female who was admitted to the emergency department with severe abdominal pain radiating to the back and a weight loss of 12 kg. Diffuse pain over the abdominal area was registered during the physical examination. After the detection of a space-occupying pancreatic mass lesion by ultrasound, dual-energy computed tomography was performed. Transversal, coronal, and sagittal planes of contrast-enhanced scans (A, C, E) showed a mass of the pancreatic body which was highly suspicious of cancer. Histopathological examination revealed a pancreatic ductal adenocarcinoma. The right column shows the tumor outlined with a semi-automatic delineation method in yellow (B, D, F). A three-dimensional illustration of the tumor is displayed at the center of the image (G)
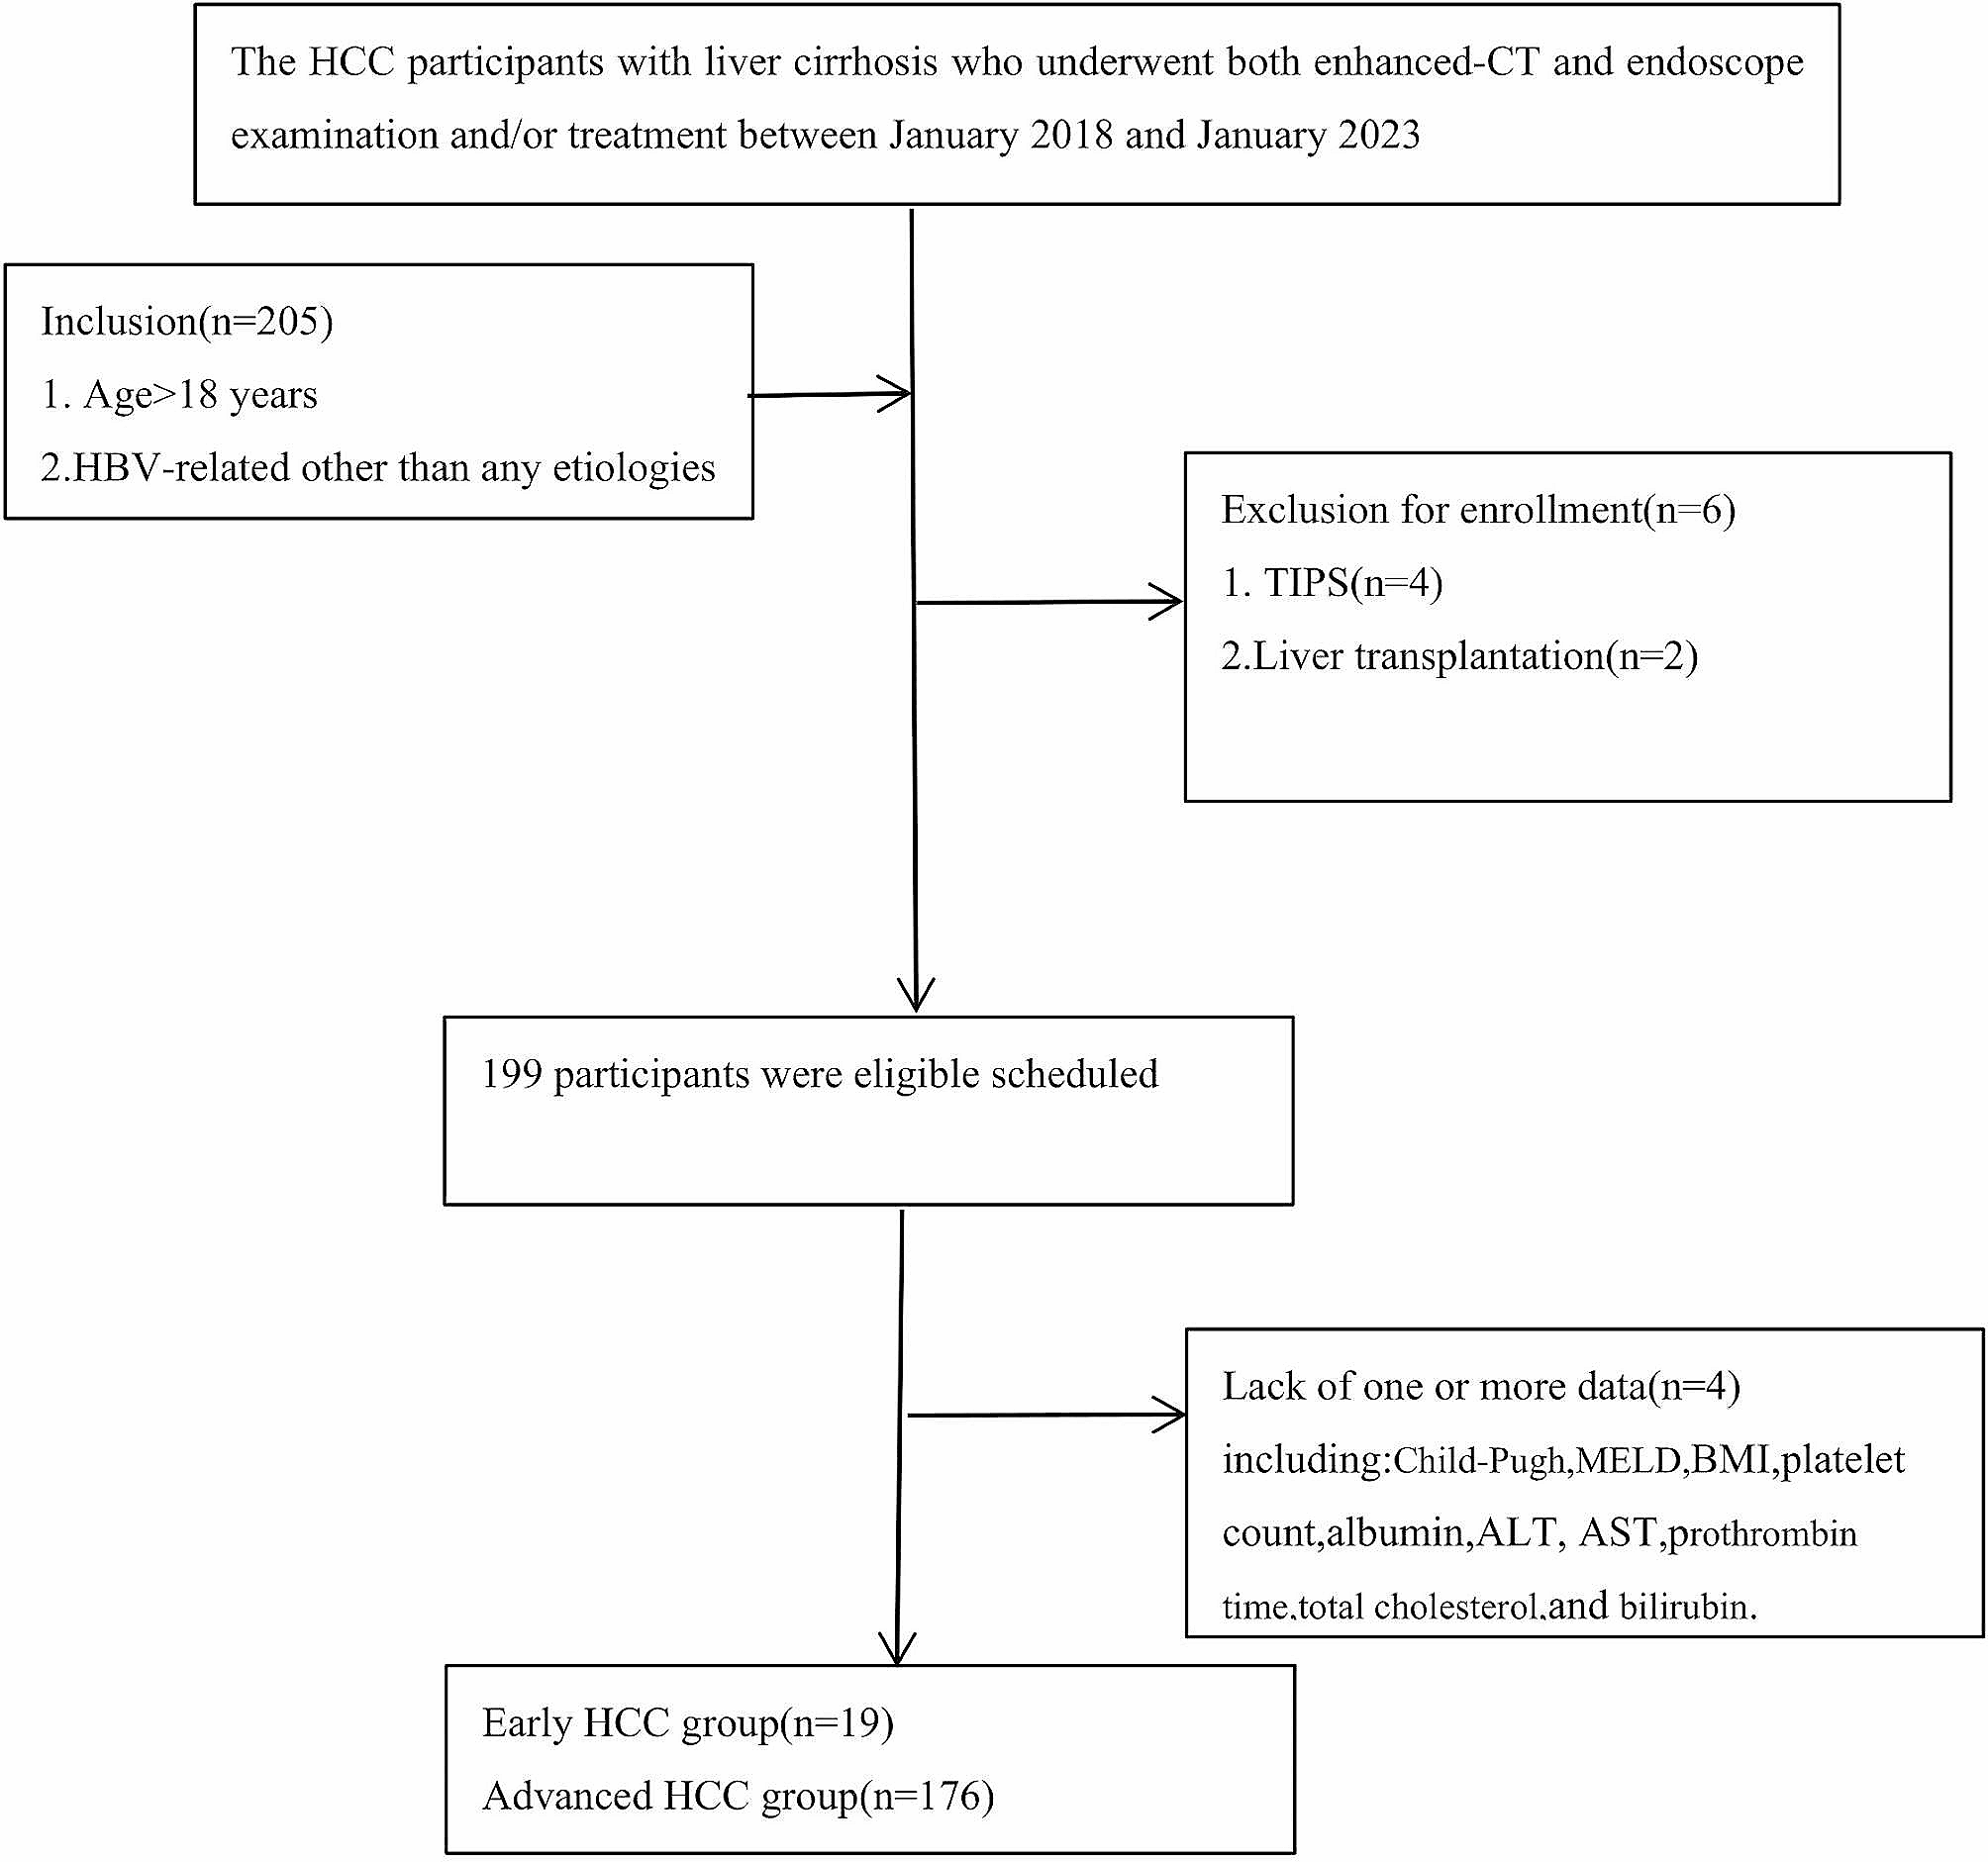
Fig. 3
Case example of a 55-year-old male suffering from beltlike abdominal pain with metabolic acidosis (pH 7.3), hypokalemia (2.8 mmol/l), weight loss, and diarrhea for the past three months. After induced infusion therapy to compensate for the electrolyte imbalance, dual-energy computed tomography was performed, showing a hypodense mass of approximately 3.3 × 3.4 × 6.6 cm located in the pancreatic tail with occasional calcifications and finally proven ductal adenocarcinoma (A, C, E). Additionally to tumor segmentation in different planes (B, D, F), the pancreatic mass is also shown in 3D (G)
Each segmentation was reviewed by one experienced radiologist (S.S.M., 6 years of experience in radiomics analysis). If the reviewer disagreed with the final result, the segmentation process was repeated under corrected conditions. All radiologists were blinded to clinical, laboratory, and histological data.
PyRadiomics extension package for 3D slicer software (Version 5.1.0–2022-05–20) was used to extract radiomics features from final segmentations, resulting in a total of 107 features per segmentation [22]. Extracted features could be classified into seven categories as follows: Gray-Level Dependence Matrix (GLDM), Gray-Level Co-Occurrence Matrix (GLCM), Grey-Level Run Length Matrix (GLRLM), Gray-Level Size Zone Matrix (GLSZM), Neighboring Gray Tone Difference Matrix (NGTDM), Shape, and First Order.
For DECT-IC and fat fraction assessment, three circular region of interests (ROIs) of 1 cm2 per patient were placed manually within malignant, inflamed, or normal pancreatic tissue, strictly excluding adjacent vessels, calcifications, fat, or cystic formations. Fat quantification was performed using three-material decomposition with fat, pancreatic tissue, and iodine as the basis triplet. A commercially available material decomposition algorithm (Syngo vB15, Siemens Healthineers) available for research was used for the quantification of iodine uptake and fat.
The hardware platform for image processing was a standard computer (Apple MacBook Pro 16 “, M1 Pro CPU, 32 GB RAM, macOS Monterey 12.3.1., Apple Inc., Cupertino, USA).
MRI scan protocolAll MR examinations were performed on a 3-Tesla MRI system (Magnetom Prisma, Siemens Healthineers) using a multichannel body surface coil. The protocol included a diffusion-weighted sequence with the following scan parameters: repetition time/echo time (msec), 6000/52; slice thickness, 4 mm; intersection gap, 4.8 mm; matrix, 280 × 248; flip angle, 90°. Apparent diffusion coefficients (ADC) were calculated with dedicated software (Syngo vB15, Siemens Healthineers) using b-values of 1000 s/mm2. Images were acquired in axial, coronal, and sagittal planes. For quantitative analysis of ADC maps, three circular ROIs of 1.5 cm2 were placed in suspected target lesions.
Quantitative assessment of radiomics featuresInitial analysis of datasets was performed by applying Euclidean distance matrices and low dimensional embedding with t-distributed stochastic neighbor embedding to investigate cluster distributions. All acquired features were randomly divided into training (60%) and test (40%) datasets, potentially resulting in significant variability between groups.
All analyses were performed using open-source packages in Python 3.9.13. and MedCalc (Version 20.123; Ostend, Belgium) [23]. The Quality Radiomics Score (1.0) yielded a value of 24 (https://radiomics.world/rqs) [24, 25].
Statistical analysisAnalyses were performed with MedCalc (Version 20.123). The normality of datasets was evaluated using the Kolmogorov–Smirnov test. Normally distributed values were illustrated as mean ± standard deviation (SD), otherwise as median with interquartile range (IQR). A P value < 0.05 was considered statistically significant.
Comparisons between categorical and continuous variables were performed using chi-square statistic tests, one-way ANOVA, or two-tailed Student’s t-test, where appropriate. The Cox proportional hazards model was used to determine independent factors of CT texture analysis and DWI on overall survival. Overall survival was defined as the time from imaging until either death from any cause or the date that the patient was last known to be alive. All participants were followed up from the time of initial diagnosis. Multivariate Cox proportional hazards models were created by adjusting significant univariate prognostic parameters for clinically important confounders, such as sex, age, and tumor size. Findings from the Cox proportional hazards models were reported as hazard ratios with corresponding 95% confidence intervals (CIs). Receiver operating characteristic (ROC) curve analysis was performed to compare the accuracy of survival models. Areas under the ROC curves (AUCs) were measured for performance assessment of each model in the evaluation of tissue discrimination and survival. The reproducibility of measurements was evaluated by calculating intra-class correlation coefficients (ICC) for each radiomics feature. In this context, values below 0.5 indicate poor reliability, between 0.5 and 0.75 moderate reliability, between 0.75 and 0.9 good reliability, and any value above 0.9 excellent reliability [26].
留言 (0)