Patient population
This study was a retrospective analysis of data. Participants were recruited from all patients referred for PSMA PET/CT as part of their clinical evaluation if they were deemed fit to lie still for 70 min during scanning. The study was approved by the local ethics committee in the Central Denmark Region (1-10-72-188-19).
D-WB PSMA data were obtained from 20 male patients with known prostate cancer. Ten patients were scanned with [68Ga]Ga-PSMA-11 and ten patients with [18F]PSMA-1007.
Data acquisition and image reconstruction
The study participants were scanned on a Siemens Biograph Vision 600 PET/CT scanner (Siemens Healthineers, Knoxville, USA) with a 26.2-cm axial field of view. A fully automated multiparametric PET/CT acquisition protocol (Multiparametric PET Suite AI, Siemens Healthineers, Knoxville, USA) was used.
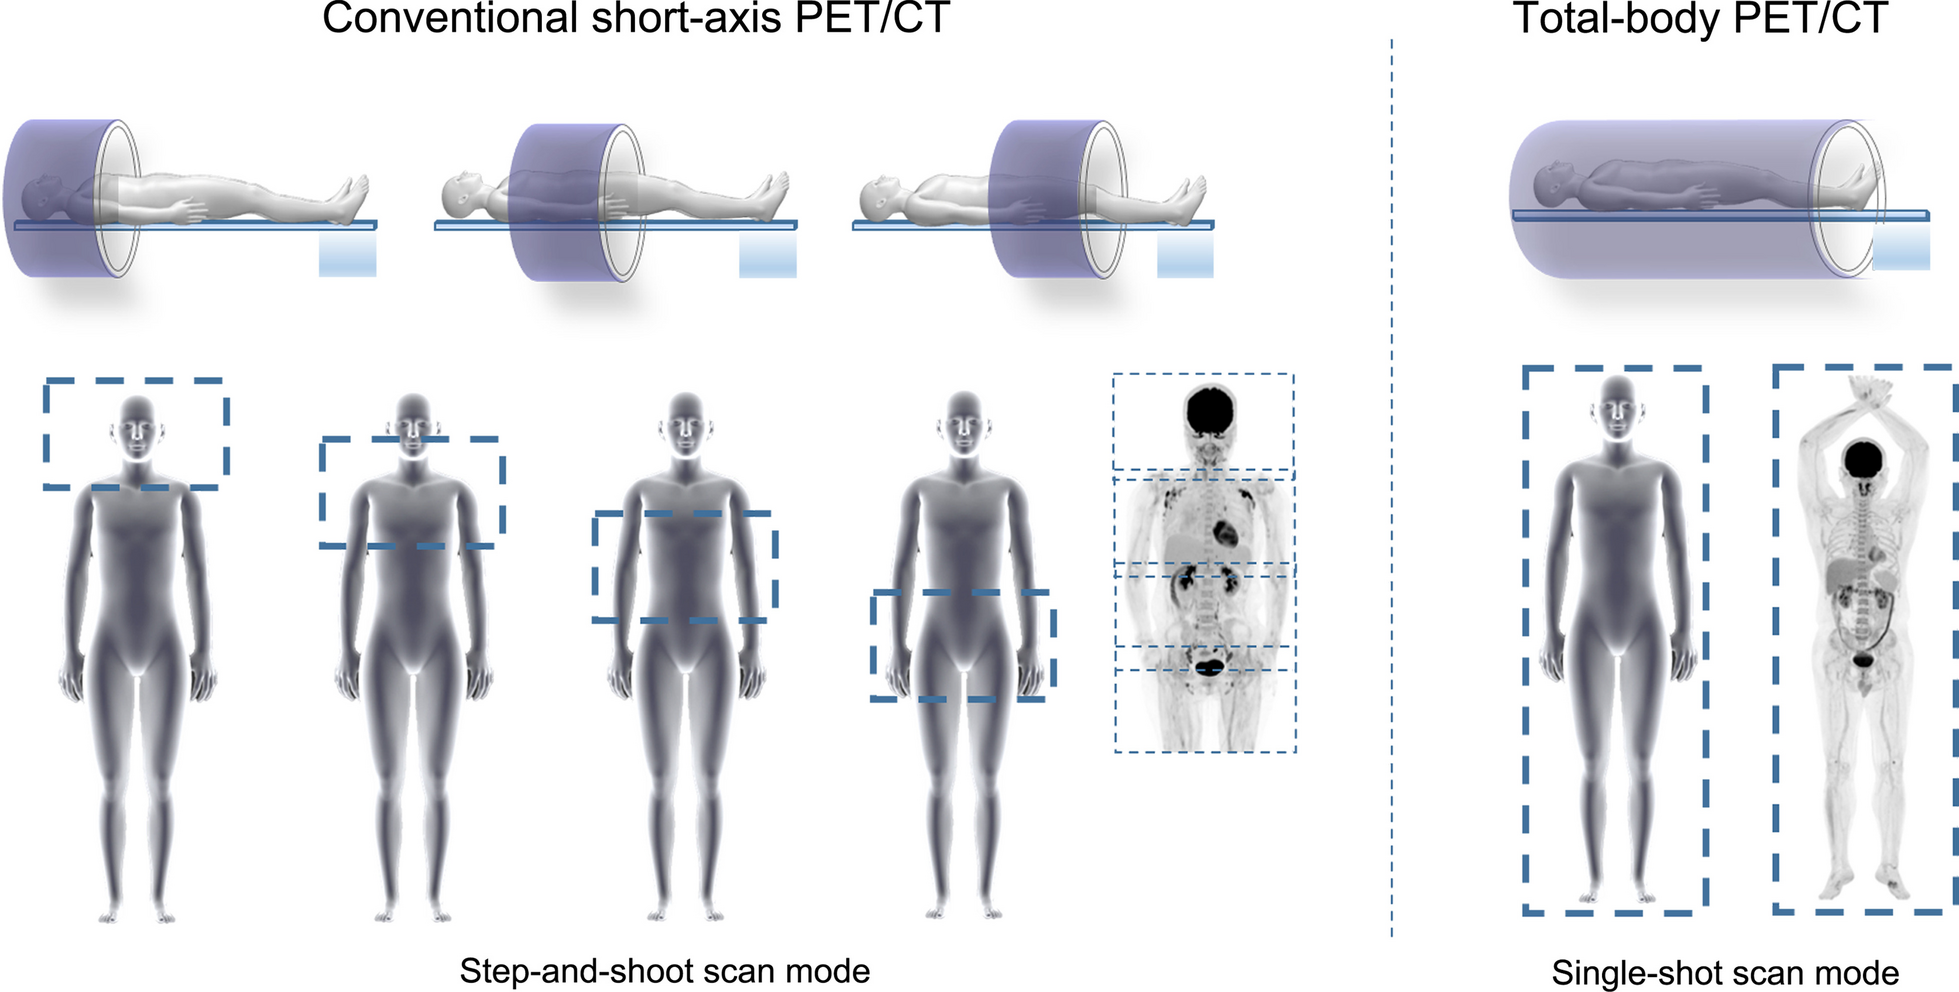
[68Ga]Ga-PSMA-11 cohort (N = 10): These subjects were scanned with a 76-min multiparametric PET acquisition protocol, started at the time of an injection of [68Ga]Ga-PSMA-11 (2 MBq/kg). The PET protocol consisted of 1) a 6-min dynamic scan with the bed fixed at the chest region, and 2) a 70-min dynamic WB PET scan consisting of seven continuous 10-min WB passes.
[18F]PSMA-1007 cohort (N = 10): A 70-min multiparametric PET acquisition protocol was started at the time of an injection of [18F]PSMA-1007 (2 MBq/kg). The PET protocol consisted of 1) a 6-min dynamic scan with the bed fixed at the chest region, and 2) a 64-min dynamic WB PET scan consisting of 16 continuous bed motion passes: 7 × 2-min WB passes followed by 9 × 5-min WB passes.
The dynamic image acquisition protocols were therefore not entirely identical. In practice, this meant that 40–70 min direct parametric reconstructions for [68Ga]Ga-PSMA-11 were performed on 3 10-min images, while for [18F]PSMA-1007 they were calculated from 6 5-min images. However, since all multiparametric images were based on 30-min D-WB PET data, we expect this variation of the frame length to have a minimal impact on image quality and noise of the multiparametric images (Ki and DV) [18].
For both tracers, multiparametric images (Ki and DV) were reconstructed using the data from 40-to-70-min post-injection and the image-derived input function (IDIF). This reconstruction protocol was performed using the direct Patlak reconstruction in the Multiparametric PET Suite AI software from Siemens Healthineers. A standard-of-care static SUV image was reconstructed using data from 60-to-70-min post injection. The PET reconstruction parameters for D-WB: For the 10-min SUV image, we used TrueX + time-of-flight, four iterations, five subsets, 440 × 440 matrix, 2-mm Gaussian filter, and relative scatter correction (reconstruction time 2.5 min). Parametric images of Ki and DV were generated using the direct Patlak reconstruction method with non-negativity constraints using list-mode data from multiple passes (40–70 min), TrueX + time-of-flight, eight iterations, five subsets, 30 nested loops, 440 × 440 matrix, 2-mm Gaussian filter, and relative scatter correction (reconstruction time 13.5 min). For image-based kinetic analyses, we also made a 0–6-min dynamic series of the chest region (12 × 5 s, 6 × 10 s, 8 × 30 s; reconstruction time 5 min), and a 6–70-min dynamic WB series (16 passes, reconstruction time 23 min), using the same reconstruction parameters as the static SUV image. This results in complete 0–70-min dynamic PET data coverage of the chest region.
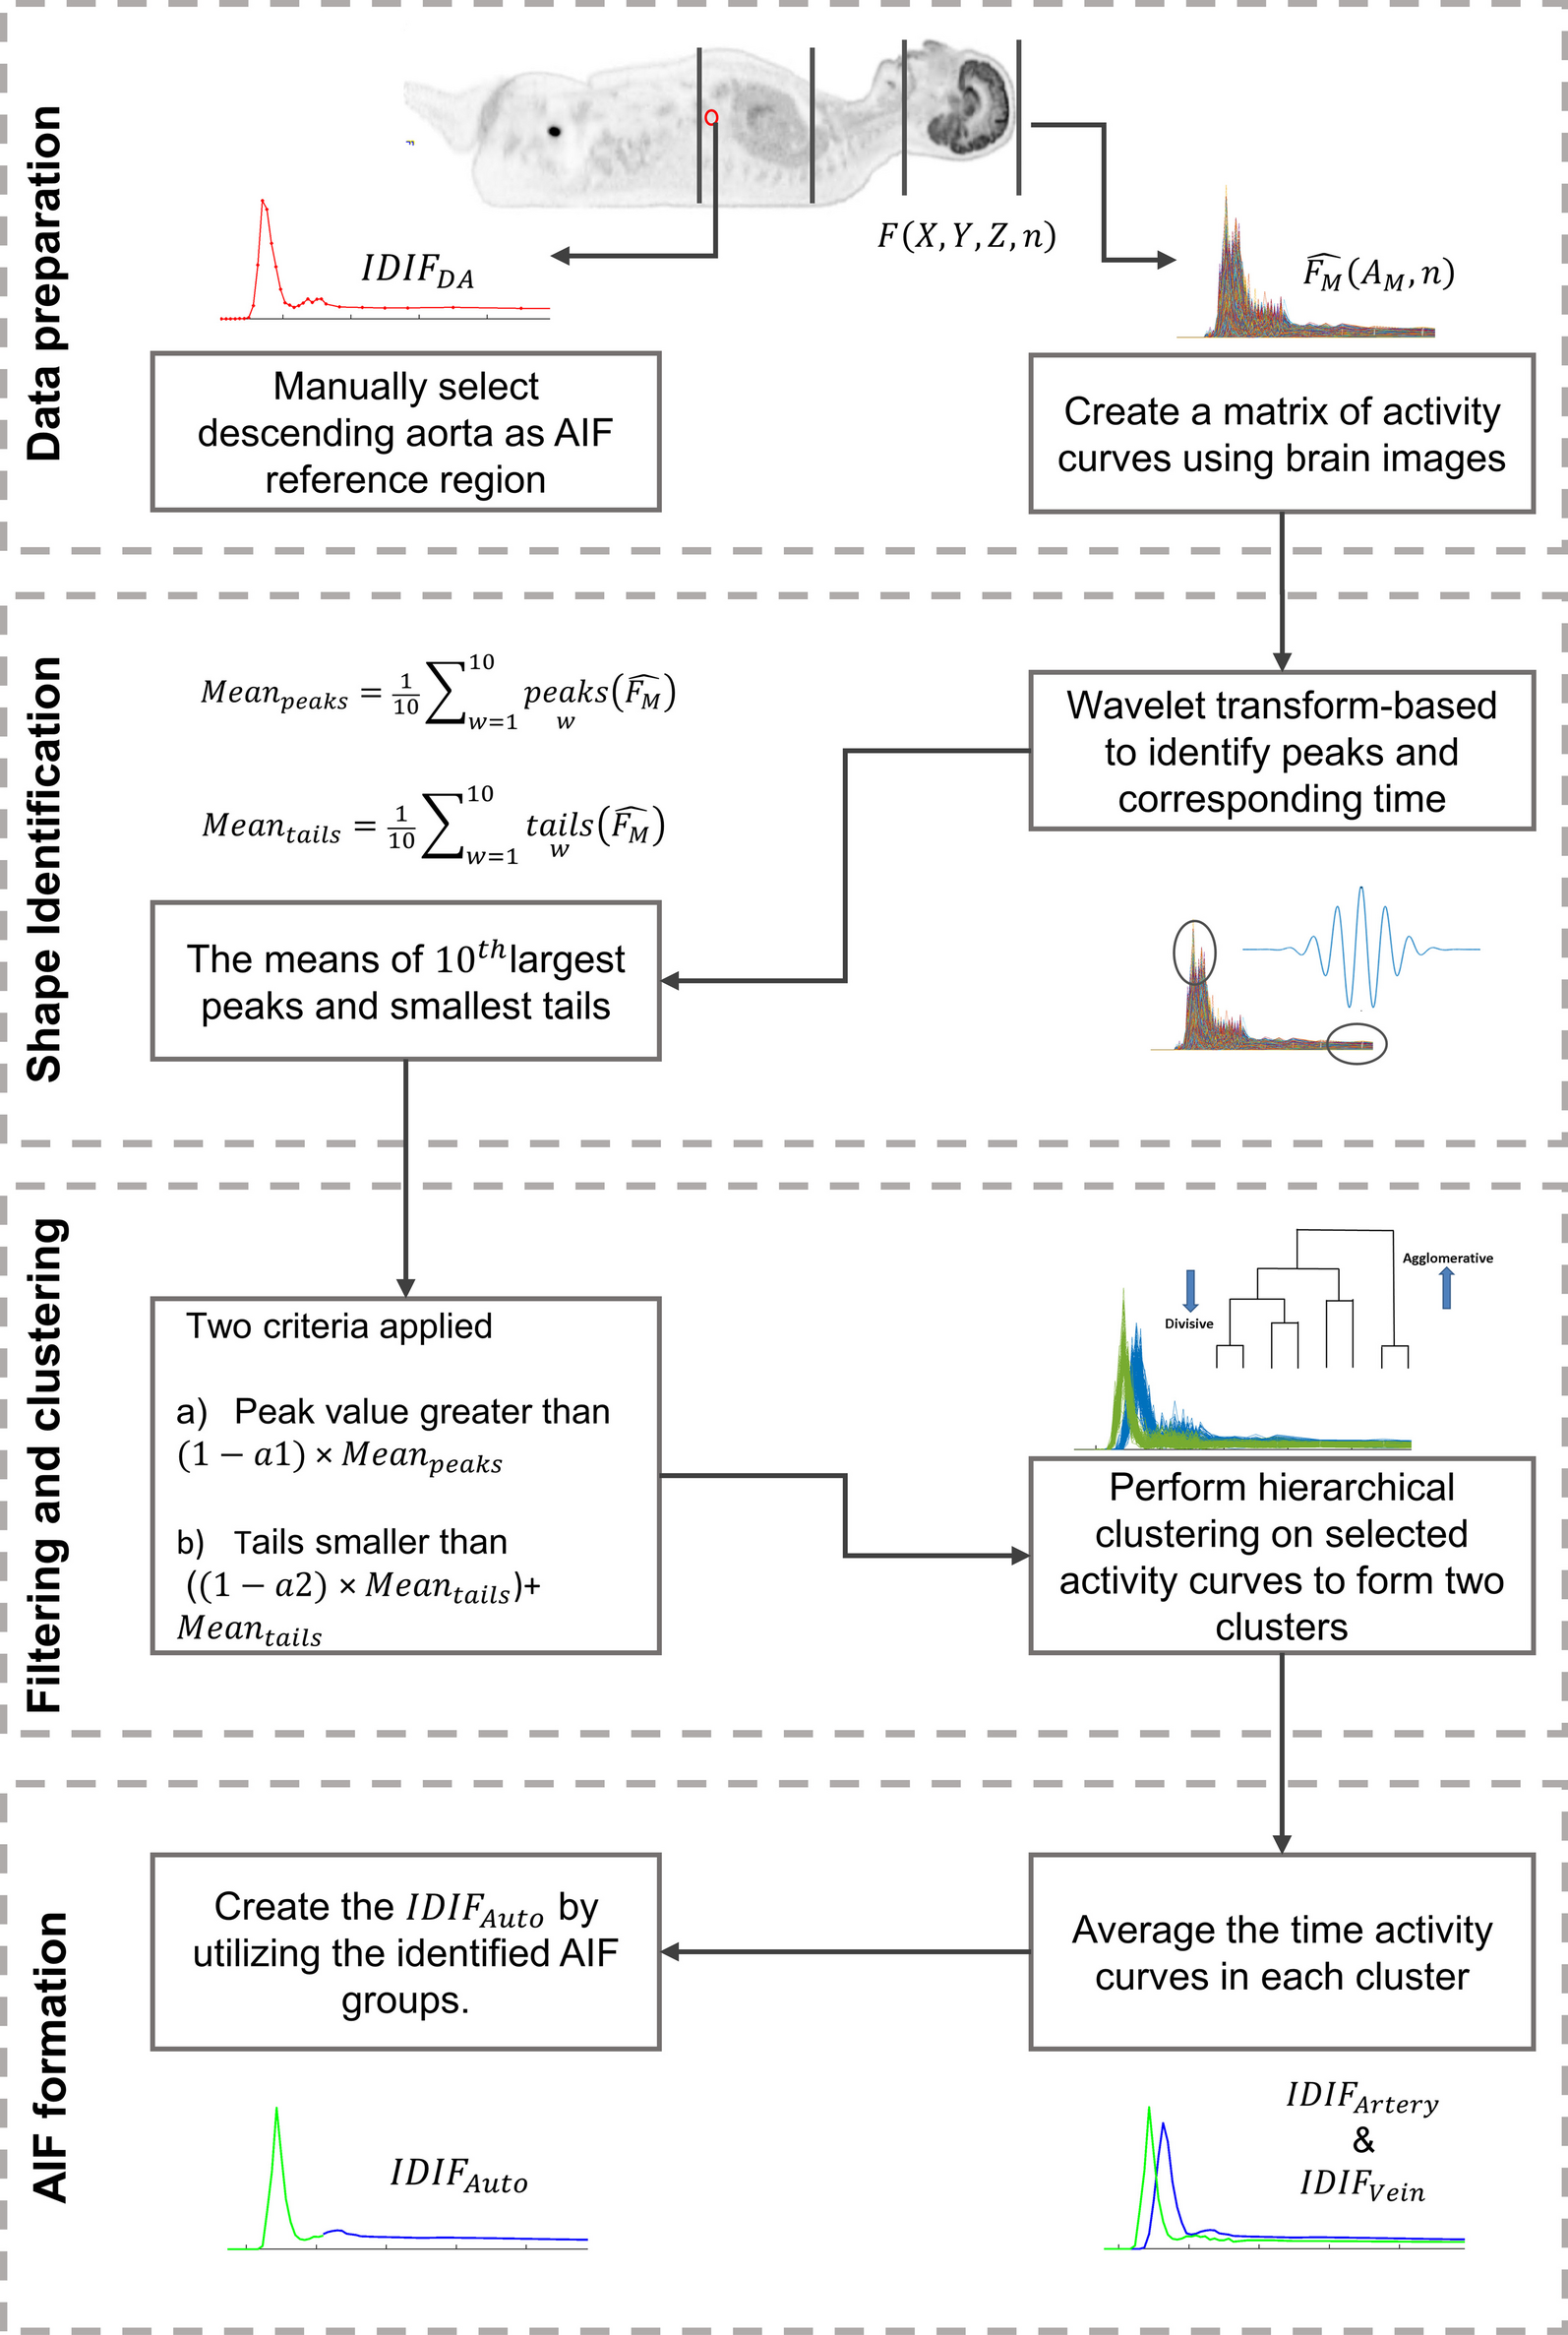
After image acquisition, the automated multiparametric scan protocol automatically identified the aorta on the low-dose WB CT scan a technology from Siemens Healthineers known as automated learning and parsing of human anatomy (ALPHA) [28] and placed a cylindric volume of interest (VOI) (1.6 mm3) on the descending aorta to extract the IDIF from the full dynamic PET series of the chest region. Such an IDIF is robust and can be used to replace an arterial blood input function for precise quantitative Patlak modelling [29].
Image analysis and VOI delineation
Multiparametric images were visually evaluated by two nuclear medicine physicians using Hermes Gold Client v.2.5.0 (Hermes Medical Solutions AB, Stockholm, Sweden). VOI delineation of the multiparametric images was performed using PMOD® 4.0 (PMOD Technologies Ltd, Zürich, Switzerland). Semiquantitative values of SUVmax and SUVmean were obtained from the conventional PET reconstructions, whereas Ki and DV values were extracted from the multiparametric images.
For each patient, VOIs were analysed from areas of tissue without evidence of pathology. Specifically, we performed delineation of an area of the liver, spleen, parotid gland, lacrimal gland, healthy bone, muscle, benign ganglia (with active PSMA signal) in the pelvis and thorax, and bladder. Areas with pathologically increased uptake of PSMA were identified and delineated using an isocontouring method of 55% of SUVmax in the VOI [30]. Thus, we outlined the primary tumour in the prostate, as well as lymph node and bone lesions. In patients with an uncountable number of active lesions, for example in disseminated skeletal disease, up to ten individual foci were chosen for delineation. Background regions were delineated in the vicinity of these target lesions, corresponding to an elongated ROI drawn in adjoining tissue in at least three consecutive slices. The individual methodology used to delineate these areas can be found in Additional file 1: Table S1, and an example of a lesion and background delineation can be found in Additional file 1: Fig. S1.
We used target-to-background ratio (TBR) as an objective metric for quantitative assessment of ‘lesion detectability’. Detectable lesions require a TBR > 1, and a higher TBR indicates better lesion detectability.
Comparison of multiparametric and image-based Ki and DV values
The estimates of kinetic parameters obtained through indirect image-based analysis can differ from those obtained by direct reconstruction of parametric images, with the latter exhibiting more favourable bias and noise characteristics, as demonstrated in reference [31]. The noise and bias in Ki images are influenced by factors such as the specific implementation of the optimization algorithm, the mathematical formulation of the Patlak model, and the utilization of non-negativity constraints [32, 33]. We therefore compared the kinetic parametric estimates using the two methods. The image-based parameters were calculated by linear Patlak analysis in PMOD® 4.0, using the general kinetic modelling tool (PKIN) with the lumped constant set to 1 and discarding fits with negative values. The direct reconstructed values were obtained using the Multiparametric PET Suite AI from Siemens Healthineers.
Kinetic analysis
70-min dynamic scan data from the fixed bed at the chest region was analysed using a two-tissue compartment model (2CM) and the 70-min IDIF using PMODs PKIN module. More specifically we analysed VOIs in the liver, spleen, healthy bone (thoracal vertebra), muscle (paravertebral) and any of the previously delineated PSMA avid lesions that were included in this limited scan field-of-view. Parameter estimates for a reversible (k4 > 0) and irreversible (k4 = 0) 2CM were obtained and compared with the parameters from the irreversible Patlak model [20] and the reversible Logan Model [34]. Akaike information criterion (AIC) [35] was used to select the CM that best fitted each tissue and for each tracer.
Statistical analysis
Statistical analyses were performed using GraphPad Prism 9.2.0. Statistical tests were used for group comparisons (paired/unpaired) and to assess whether data were normally distributed. Welch’s T test was performed for normal distributed data (liver, spleen, bone, and benign ganglia), while the Mann–Whitney test was performed for non-normal distributed data (prostate lesions, lymph node lesions, bone lesions, parotid gland, lacrimal gland, and muscle).
Pearson’s correlation analysis was performed for the relation between Ki and SUV values. P values of < 0.05 were considered significant. Continuous group data are presented as mean ± SD or median (range) as appropriate. Time-series are presented as mean ± SEM.


留言 (0)