Study design
We conducted a cross-sectional study in 19 malaria-endemic countries in sub-Sahara Africa (Benin, Burkina Faso, Burundi, Cameroon, Ghana, Guinea, Liberia, Madagascar, Malawi, Mali, Mozambique, Nigeria, Rwanda, Senegal, Sierra Leone, Tanzania, Togo, Uganda, and Zambia) using the Demographic Health Surveys (DHS) and the Malaria Indicators Surveys (MIS), both of which are repeated cross-sectional surveys (see detailed survey waves in Additional file 1: Table S1) [1]. We intended to include all DHS and MIS in a relatively tight time frame to facilitate cross-country comparison. We further restricted the study period to 2016–2018 to maximize the number of surveys included in this study.
Data sources
DHS and MIS are both nationally representative surveys that provide data on a wide range of demographic and health topics, including malaria treatment. The sample of each survey is selected using a stratified two-stage cluster design. In the first stage of selection, the primary sampling units (PSUs) are selected from the list of census enumeration areas with probability proportional to the size within each stratum. In the second stage, a fixed number of households are selected by equal probability systematic sampling in each PSU. Trained staff visit the selected household and collect information on the characteristics of the household as well as women and men of reproductive age in the household. Women also answer questions about their children under the age of five, providing important information on childhood illness, mortality, vaccination, and nutrition. As a subset of the DHS survey, MIS collects data on ownership of mosquito nets and the prevention and treatment of malaria during high transmission seasons.
Study population and sample size
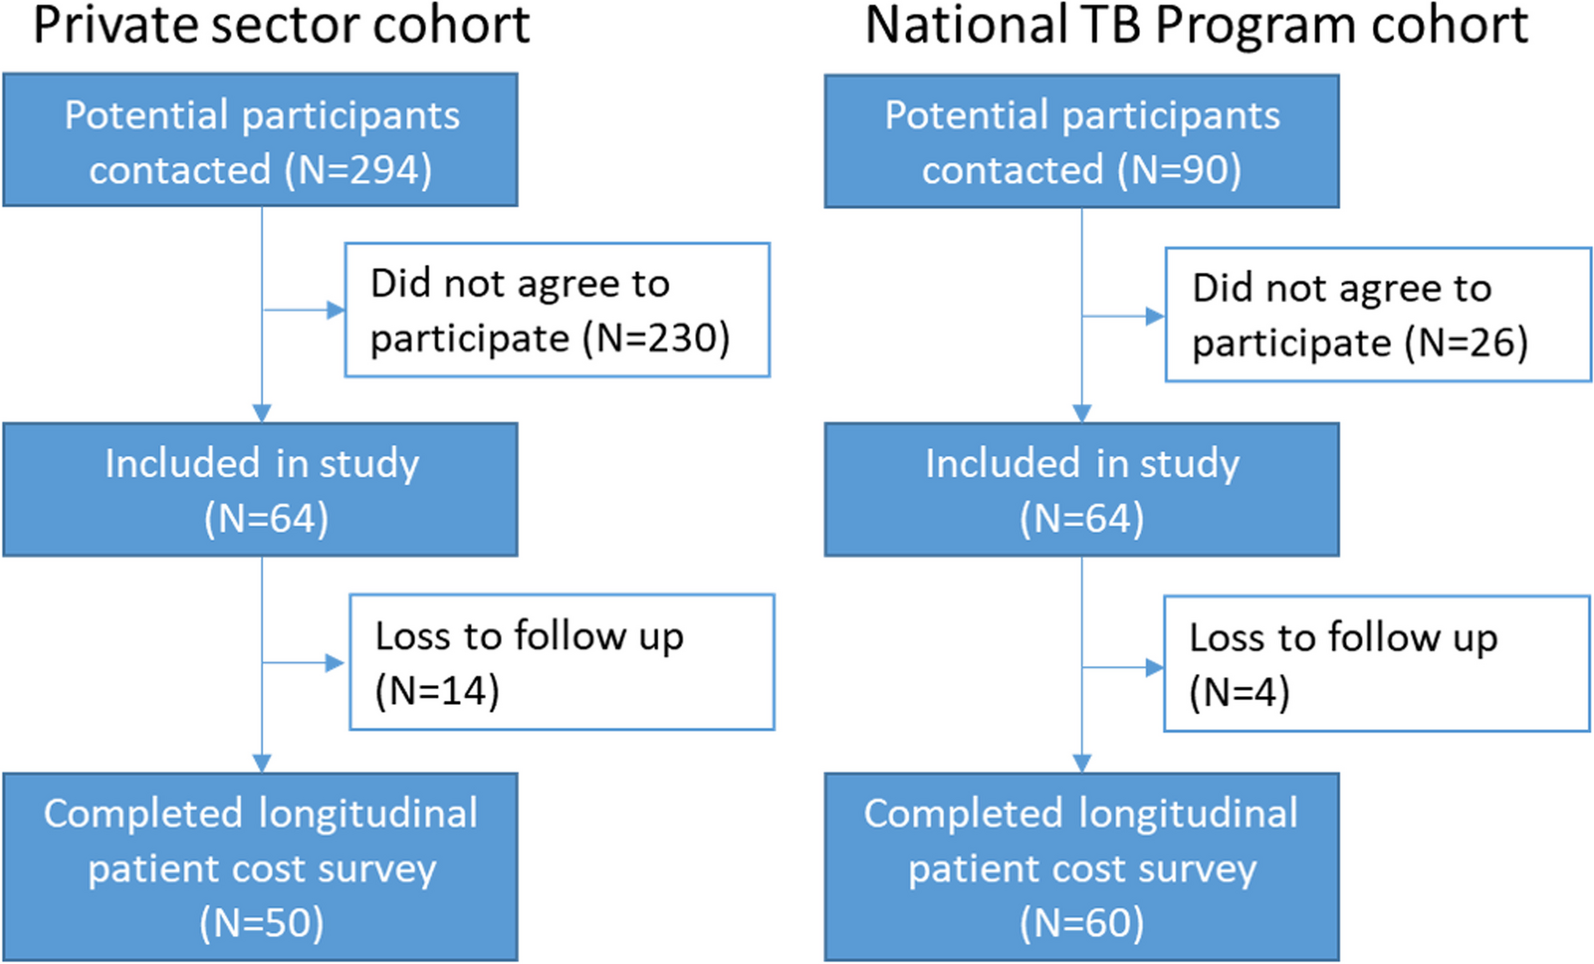
To analyze the influence of maternal and family factors, we limited the sample to under-five children who lived with their mother and were usual residents of the family. We gathered data on 38,567 under-five children who reported being febrile in the last two weeks before the surveys. Among them, 22,180 children sought care. The unweighted samples for all treatment cascades are presented in Additional file 1: Fig. S2.
Measurement of variablesOutcome measures
In malaria-endemic areas, malaria should be suspected in any patient presenting with a history of fever or temperature ≥ 37.5 ℃ with no other obvious cause, and suspected malaria should be confirmed with a parasitological test [4]. Accordingly, the first outcome indicated whether or not a febrile child was taken to a health facility which was defined as a public or private health facility except for a pharmacy. The second outcome indicated whether or not the child had blood tested for malaria parasites in any health facility. The first outcome was analyzed in all febrile children, while the second outcome was analyzed in children who sought care for the reported fever.
Explanatory variables
Based on the literature review and Anderson’s model of health service utilization, we included explanatory variables which might affect care-seeking behavior and the receipt of blood tests [25]. The following variables were included as they were available in both DHS and MIS: child’s sex, child’s age, mother’s age, mother and her partner’s highest education level, number of children in household, household wealth index, type of residence (urban/rural), type of health facilities to which the child was taken.
Among the explanatory variables mentioned above, the highest level of parental education and household wealth index were used to capture the child’s SES. Education level was classified into four categories: having no education, primary education (i.e., having attended primary school), secondary education (i.e., having attended secondary school), and higher education. Notably, as a composite measure of a household’s cumulative living standard, the wealth index was generated with principal components analysis using easy-to-collect data on a household’s ownership of selected assets, such as televisions and bicycles, materials used for housing construction, and types of water access and sanitation facilities. (For more detailed information, please see https://dhsprogram.com/Data/Guide-to-DHS-Statistics/index.cfm).
We categorized the types of health facilities into public hospitals, public primary health care (PHC) facilities, private hospitals, and private PHC facilities. Public hospitals indicated government hospitals. Public PHC facilities included government health centers, government health posts, mobile clinics, and community health workers that belonged to the public sector. Private hospitals indicated non-governmental hospitals. Private PHC facilities included private doctors, mobile clinics, and community health workers that belonged to the private sector.
Statistical analysis
All statistical analyses were conducted among complete cases, using Stata version 15.1 (StataCorp, College Station, Texas, USA). Considering the small amount of missing data, bias due to missing data is unlikely to affect the results substantially (see Additional file 1: Fig. S2). All the descriptive analyses and regression below were weighted by survey weights provided by the DHS and MIS to account for the complex survey design.
First, we examined the percentage of febrile children who sought care and the percentage of care seekers who received blood tests. We assessed the variation in these proportions at the national and sub-national levels.
Second, we investigated the association between SES and care-seeking behavior as well as the receipt of blood tests. For care-seeking behavior, multivariable logistic regression was used, controlling for child’s sex, child’s age, mother’s age, mother and her partner’s highest education level, number of children in household, household wealth index, type of residence, and transmission season (dry/rainy). For the receipt of blood tests, the type of health facilities was further adjusted. Fewer than 3% of children who were taken to two or more facilities were excluded here, because DHS and MIS didn’t indicate in which facility these children received/didn’t receive blood tests. In all regression models, country fixed effects and year fixed effects were controlled for in all models to account for variations in malaria incidence across countries and years. We did not include the interaction term of education level and wealth index, which was not statistically significant (results not shown). Notably, variables only available in DHS or MIS were not included, such as the mother’s marriage, employment, and accessibility of health facilities. To assess the potential impact of omitting these variables, we controlled for these variables with only DHS data in the sensitivity analyses.
Furthermore, stratified analysis was conducted according to the type of health facilities for the receipt of blood tests, to further examine whether the associations between SES and receipt of blood tests differ across facility types. 0.61% of children (who were taken to only one facility) were taken to facilities that didn’t belong to the public sector or private sector (recorded as “other” in DHS and MIS). These records were excluded from the stratified analysis. Post-estimation simulations were conducted to generate the predicted probabilities of receiving blood tests at each type of facilities with other covariates at means as well as their confidence intervals.


留言 (0)