
記住我


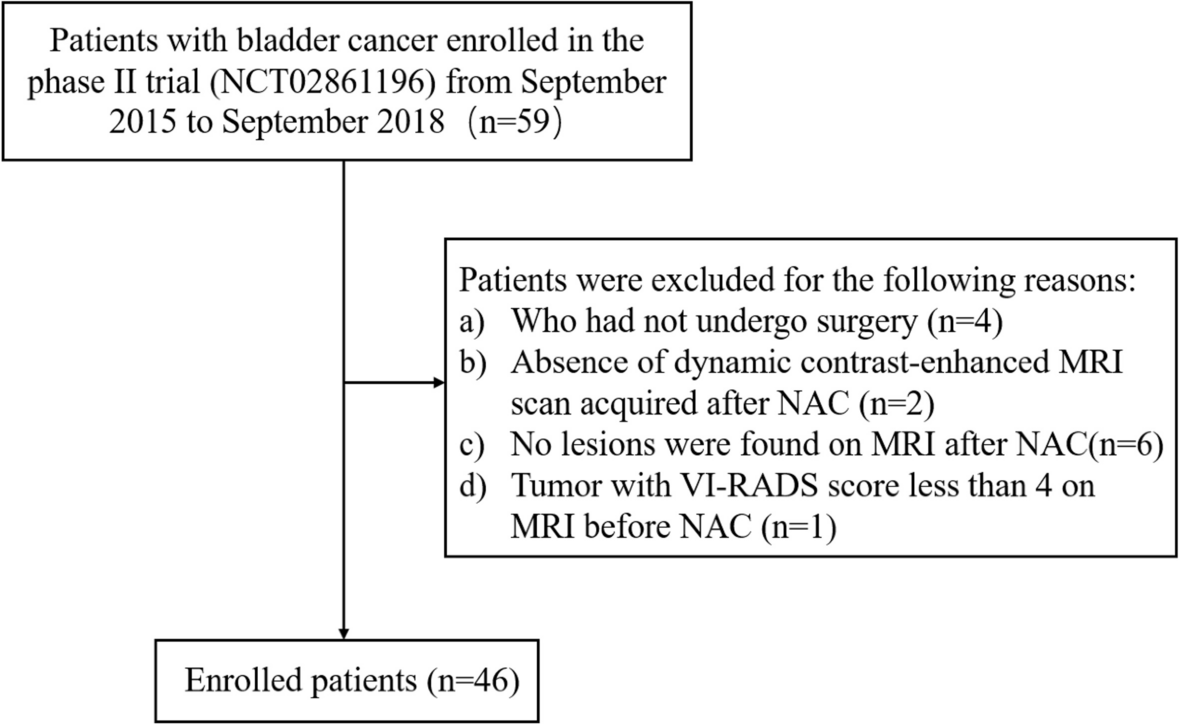


We retrieved data on all consecutive patients with oral tumor who underwent preoperative 18F-FDG PET/CT in Shanghai ninth people’s hospital and in Shanghai Universal Medical Imaging Diagnostic Center (from January 2018 to May 2022). The inclusion criteria were defined as follows: 1) 18F-FDG PET/CT was performed within two weeks before surgery. 2)Surgical resection of primary tumor and neck dissection. 3)The primary tumor was pathologically confirmed OSCC, and staged according to the latest(8th) Edition of the American Joint Committee on Cancer/Union for International Cancer Control(AJCC/UICC) TNM staging system [14], 4)Patients with cN0 neck, 5)Patients were followed up for at least 6 months after operation. Patients who had tumor relapse, previous treatment, or high blood glucose level (> 200 mg/dL) during the PET/CT scan were all excluded. According to the criteria, ninety-five patients imaged in Shanghai ninth people’s hospital were identified as the training cohort and another 46 patients scanned in Shanghai Universal Medical Imaging Diagnostic Center were selected as the validation cohort. All patients received surgical treatment and postoperative follow-up in Shanghai ninth people’s hospital. Details of patient selection were shown in Fig. 1.
Fig. 1
The workflow of patient selection
In the training cohort, 52 patients with malignancies of tongue, followed by gingival (nineteen patients), buccal mucosa (ten patients), floor of mouth (nine patients) and palate cancers(five patients). ND level on the affected side were as follows: I-II:I-III:I-IV:I-V = 7:33:9:46, and ten patients underwent contralateral ND(I:I-II:I-III:I-IV:I-V = 1:2:4:2:1). Nodal metastases were histologically confirmed in 38 patients (40.0%), eight of them were found to have bilateral nodal metastasis. In the validation cohort, sixteen patients with malignancies of buccal mucosa, followed by tongue (fourteen patients), gingival (nine patients) and floor of mouth (seven patients). ND level on the affected side were as follows: I-II:I-III:I-IV:I-V = 1:21:3:21, and eight patients underwent contralateral ND(I-II:I-III = 2:6). Nodal metastases were histologically confirmed in 14 patients (30.4%), one of them was found to have bilateral nodal metastasis. No distant metastasis was found in the 141 patients by preoperative evaluation.
Imaging techniqueAll patients were fasted at least 6 h before being injected with 18F-FDG. PET/CT scanning was performed on either Ingenuity TF (Philips Medical systems, Cleveland, USA) in Shanghai ninth people’s hospital or Biograph mCT (Siemens Healthcare, Erlangen, Germany) in Shanghai Universal Medical Imaging Diagnostic Center. PET/CT images were acquired from the base of the skull to the mid-thigh or foot approximately 60 min after the injection with 18F-FDG. The detailed acquisition parameters are given in Supplementary Material Table 1.
Metabolic variables of primary tumor and lymph nodeIn the training cohort, the volume of interest (VOI) of the primary OSCC tumors was automatically delineated with a threshold of 40% of maximum standardized uptake value(SUVmax) [15] on the Intellispace Portal workstation (Philips, Best, the Netherlands). Then, the VOIs were carefully reviewed by a nuclear medicine radiologist(F.X) with 15 years of experience, and the borders of the volume of interest(VOI) were adjusted manually to exclude adjacent physiological 18F-FDG-avid structures on PET images. SUVmax, SUVmean, metabolic tumor volume (MTV) and total lesion glycolysis (TLG = SUVmean × MTV) of primary tumors were calculated. The same radiologist visually reviewed PET/CT images of the ipsilateral and contralateral neck, the LN with the most intense uptake of 18F-FDG was carefully chosen (in case of no LN with higher SUVmax than background, the LN with the longest diameter on the affected side was chosen), and the nodal SUVmax were measured visually by placing regions of interest over the neck LNs. The short and long axis diameter of the LN was measured as well. Another nuclear medicine radiologist(L.P) with 10 years of experience performed the measurements on the syngo VB20P workstation (Siemens Healthcare, Erlangen, Germany) for the validation cohort in the same way.
Pathological variables of the primary tumorAll 141 patients had a detailed pathological diagnosis of the primary tumor in their hospital records. One oral pathologist(Y.H) checked the pathological findings of the primary tumor, including grade of tumor, surgical margin, PNI, pathological tumor size, depth of invasion, and lymphovascular invasion. Finally, according to the 8th edition of AJCC/UICC TNM staging system, the pathological T stage was determined by pathological tumor size and depth of invasion.
Standard reference for nodal metastasisThe histopathological diagnosis (immune-histochemical staining with cytokeratin and traditional hematoxylin and eosin staining) was the standard of reference for the ND side. Follow-up was taken as reference for the contralateral side without ND. Postoperative complications, primary site status and cervical nodal status were followed up every month for at least 6 months after operation.
Construction of prediction modelIn the training cohort, least absolute shrinkage and selection operator(LASSO) logistic regression algorithm, with penalty parameter tuning conducted by five-fold cross-validation, was applied to select nodal-status-related variables with nonzero coefficients. Multivariable forward stepwise logistic regression modeling was then performed to identify significant variables associated with nodal metastasis. A prediction model of nodal metastasis, with combination of significant variables, was established by using logistic regression modeling. To provide a more understandable outcome measure, a nomogram was then constructed by using the significant variables derived from the training cohort.
Validation of the model and clinical utilityCalibration curves were plotted via bootstrapping with 1000 resamples to assess the prediction model, accompanied by the Hosmer–Lemeshow goodness of fit test, a P-value of the Hosmer–Lemeshow test > 0.05 indicated a good fit. Predictive accuracy of the prediction model was validated using receiver-operating-characteristic (ROC) and quantified by the area under the curve (AUC) in the training cohort and validation cohort. Finally, Clinical utility of the nomogram was assessed by decision curve analysis.
Statistical analysesStatistical analyses were carried out using SPSS(version 17.0, SPSS Inc., Chicago, Illinois, USA), MedCal(version 19.6.1, MedCalc Software, Ostend, Belgium) and R software(version 4.2.0, http://www.r-project.org, R Foundation for Statistical Computing, Vienna, Austria). Data are presented as mean ± SD or median (followed by range) when the distribution of data was skewed. Qualitative parameters were analyzed using the Fisher’s exact test. The LASSO logistic regression algorithm was carried out by using the “glmnet” package. Nomogram and calibration curves were performed with the “rms” package. Decision curve analysis was generated using the “rmda” package. A two-tailed test with P < 0.05 represented a statistically significant difference.
留言 (0)