
記住我
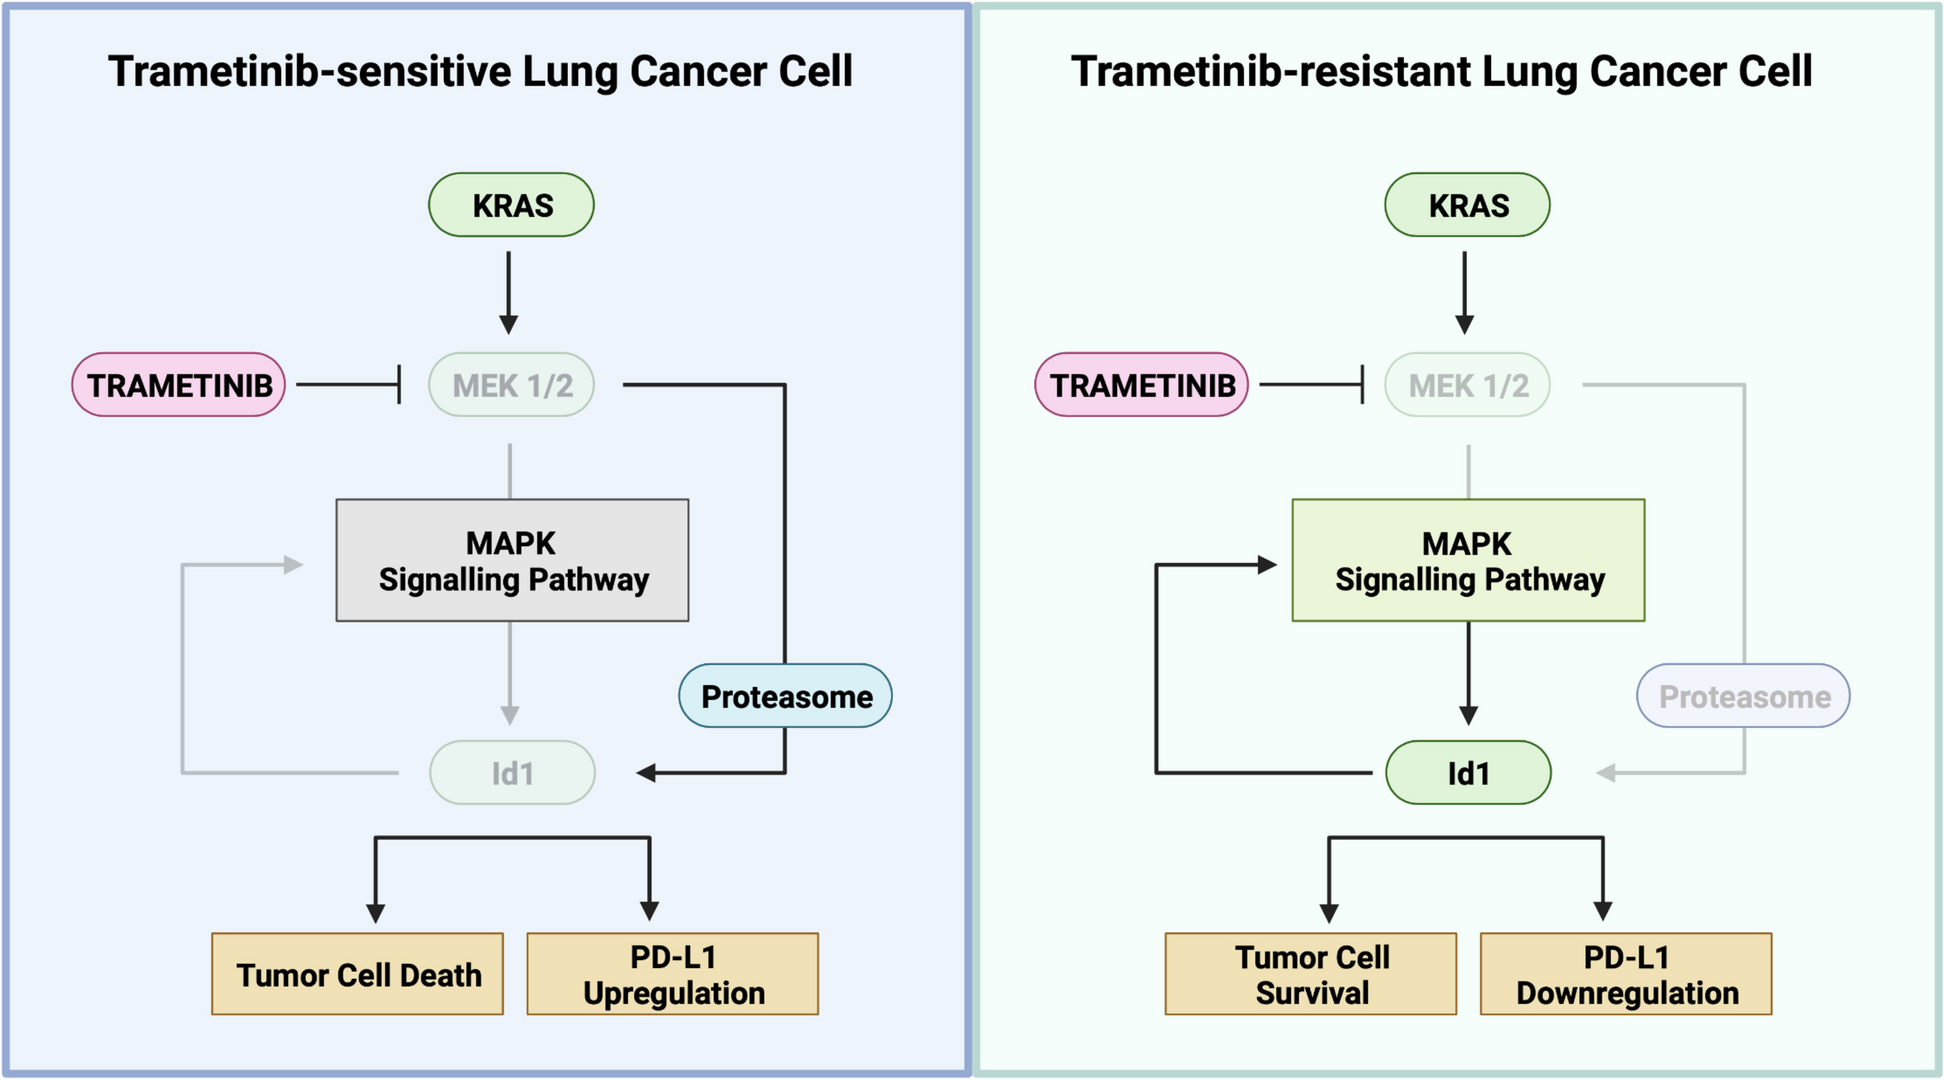
We used the CDK9 inhibitor AZD4573, the clinical congener of AZ5576, as the latter demonstrated pre-clinical efficacy in our earlier studies [2]. In vitro treatment of DLBCL cell lines (U-2932, VAL, OCI-LY3) with AZD4573 led to a time-dependent reduction in phosphorylation of RNAPIISer2 (CDK9 target site) but not at Ser5, consistent with previous reports asserting that AZD4573 selectively inhibits CDK9 (Fig. 1A) [7, 8]. This was accompanied by downmodulation of Mcl-1 and MYC protein levels. AZD4573 potently suppressed proliferation and induced apoptosis in both activated B-cell like (ABC)- and germinal center B-cell like (GCB) DLBCL cell lines (IC50 ~ 3–30 nM; Fig. 1B-D). U-2932 and OCI-LY3/LY19 cells were less susceptible to the anti-proliferative effect of CDK9i, and OCI-LY3 cells were resistant to apoptosis, similar to results obtained using AZ5576 [2]. Conversely, the cell lines NU-DUL-1, SU-DHL-6, SU-DHL-16, and VAL showed remarkable sensitivity both via proliferation and apoptosis. AZD4573 appeared more potent than standard chemotherapy drugs in DLBCL cell lines (Supplemental Fig. 1). Thus, CDK9 inhibition with AZD4573 exhibited pre-clinical efficacy in DLBCL cell lines in vitro.
Fig. 1
AZD4573 shows preclinical efficacy in DLBCL. A Cells were treated with 30 nM AZD4573 as indicated. Whole cell lysates were subjected to immunoblotting. Values for phosphorylated RNAPII are expressed numerically below the blots as a ratio of phosphorylated pRNAPII to total RNAPII, while RNAPII, MYC and MCL1 are expressed as a ratio of protein to Actin. B-C Proliferation was assessed in 9 DLBCL cell lines using a colorimetric tetrazolium-based assay, following 48-h treatment. Data is shown as mean ± SEM of three independent experiments, and a table of calculated IC50 values. IC50 was calculated using GraphPad Prism 9 software set to variable slope (four parameters). D Apoptosis was tested in 7 DLBCL cell lines treated with AZD4573, measured by flow cytometry at 24 h using Annexin-V staining. Data is shown as mean ± SEM of three independent experiments. *p < 0.05 and **p < 0.01 vs. untreated control
Oncogene recovery follows CDK9iTo understand how AZD4573 impacts key gene expression to contribute to growth inhibition, we characterized changes to protein levels in DLBCL cell lines upon treatment with AZD4573 for 3 h. This early timepoint was chosen to minimize possible off-target effects that may occur at later timepoints. Protein abundance was quantified using liquid chromatography tandem mass spectrometry (LC–MS) in VAL cells, which are highly sensitive to CDK9i, and the relatively resistant OCI-LY3 cells (Fig. 2A; Supplemental Table 2). Data are available via ProteomeXchange with identifier PXD035858.
Fig. 2
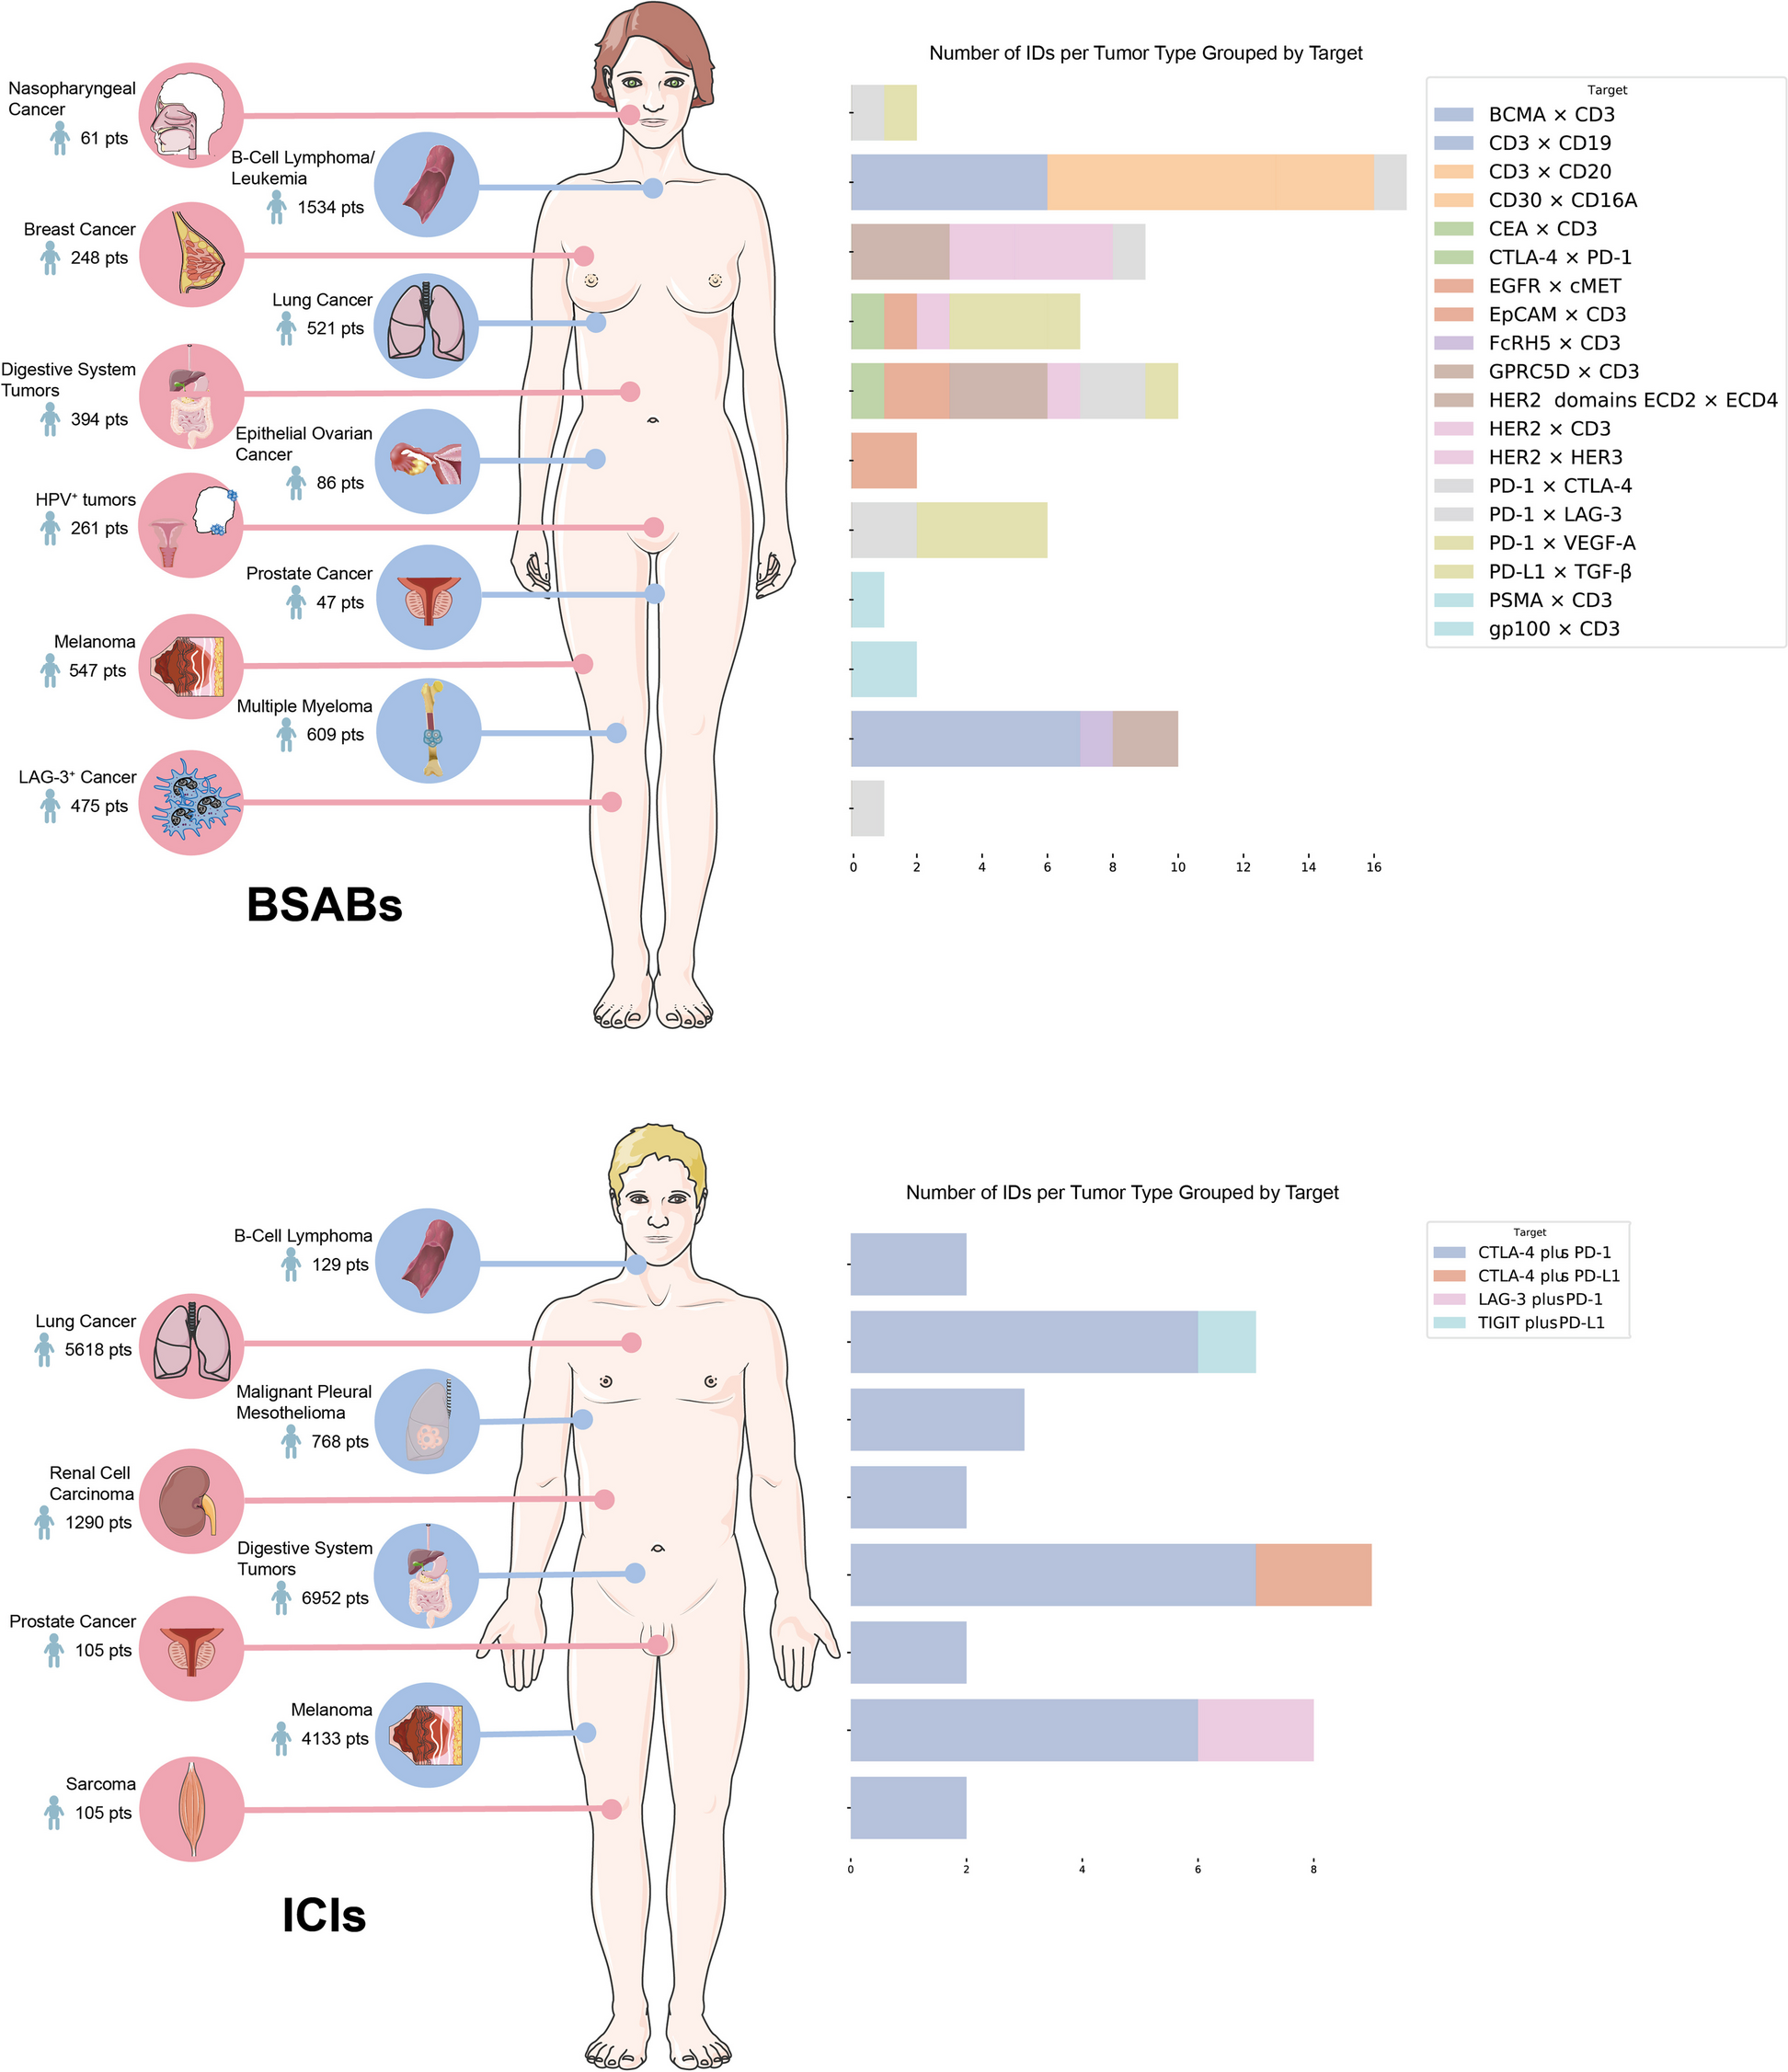
CDK9i transiently suppresses expression of oncoproteins. A OCI-LY3 and VAL cells treated with 30 nM AZD4573 or vehicle control for 3 h and subjected to proteomic analysis. Heatmap of all detected proteins is shown. Data are represented as z scores calculated from normalized protein abundance. B Volcano plot of all differentially expressed proteins common to both cell lines (|FC| ≥|1.5| treatment versus control; p ≤ 0.05). The identities of select proteins are shown. C Cell lines were treated with AZD4573 (30 nM) for 0, 3 and 8 h prior to harvest. After 8 h exposure, the compound was either washed out (w) or not (c = continuous exposure) and harvested after 24 h. Whole cell lysates were subjected to immunoblotting. D Top enriched and depleted pathways from IPA analysis of proteomics data from AZD4573-treated VAL and OCI-LY3 cells. Data is presented as a dot plot ranked by pathway Z-score, with size representing the number of genes and color indicating the -Log10 of the significance. E VAL (blue) and OCI-LY3 (red) cell were treated with AZD4573 for 0, 3 and 8 h prior to harvest. After 8 h exposure, the compound was washed out and cells were harvested after 24 h. mRNA expression of select genes was quantified by RT-PCR. Data is shown as mRNA fold change in cells treated with AZD4573 versus time-matched cells treated with DMSO. Bars represent mean ± SEM of three independent experiments. Note that plots for the gene PIM3 were separated from the other genes due to the higher y-axis scale. *p < 0.05 and **p < 0.01, AZD4573 vs. time-matched DMSO control
Seventy-five and one hundred thirteen proteins were differentially expressed following AZD4573 treatment in OCI-LY3 and VAL cells, respectively (|fold change (FC)| ≥|1.5|; p ≤ 0.05). We identified 83 decreased- and 10 increased-abundance proteins common to both cell lines (Fig. 2B). In addition to Mcl-1, a recognized CDK9 inhibitor target, treatment with AZD4573 resulted in decreased abundance of several proto-oncoproteins, including MYC, JunB, and Pim-3. Immunoblotting confirmed rapid downmodulation of these proteins (Fig. 2C). STRING analysis of proteins that were significantly decreased following treatment formed four main functional annotation groups: “Negative regulation of CDK activity”; “Positive regulation of RNA metabolic processes”; “maturation of lsu-rrna” and “Transcription export complex…”, consistent with the expected effect of AZD4573 on RNA transcription (Supplemental Fig. 2A, Supplemental Table 3).
Cells treated with AZD4573 exhibited enrichment of the phosphoinotiside-3 kinase (PI3K) and senescence pathways, including loss of the TP53-degrading E3 ligase MDM2 (Fig. 2D; Supplemental Fig. 2B, Supplemental Table 4). We have previously shown that loss of TP53 and the pro-apoptotic BH3-only protein BAX confers resistance to pharmacologic BH3-mimetics which target Bcl-2 and Mcl-1 in lymphoid and myeloid malignancies [9, 10]. Here we used CRISPR-mediated knockout of BAX to demonstrate that its loss similarly conferred partial resistance to AZD4573 (Supplemental Fig. 3). It is likely that TP53/BAX network mediates the therapeutic effect of CDK9i due to its well-described effect on Mcl-1.
Fig. 3
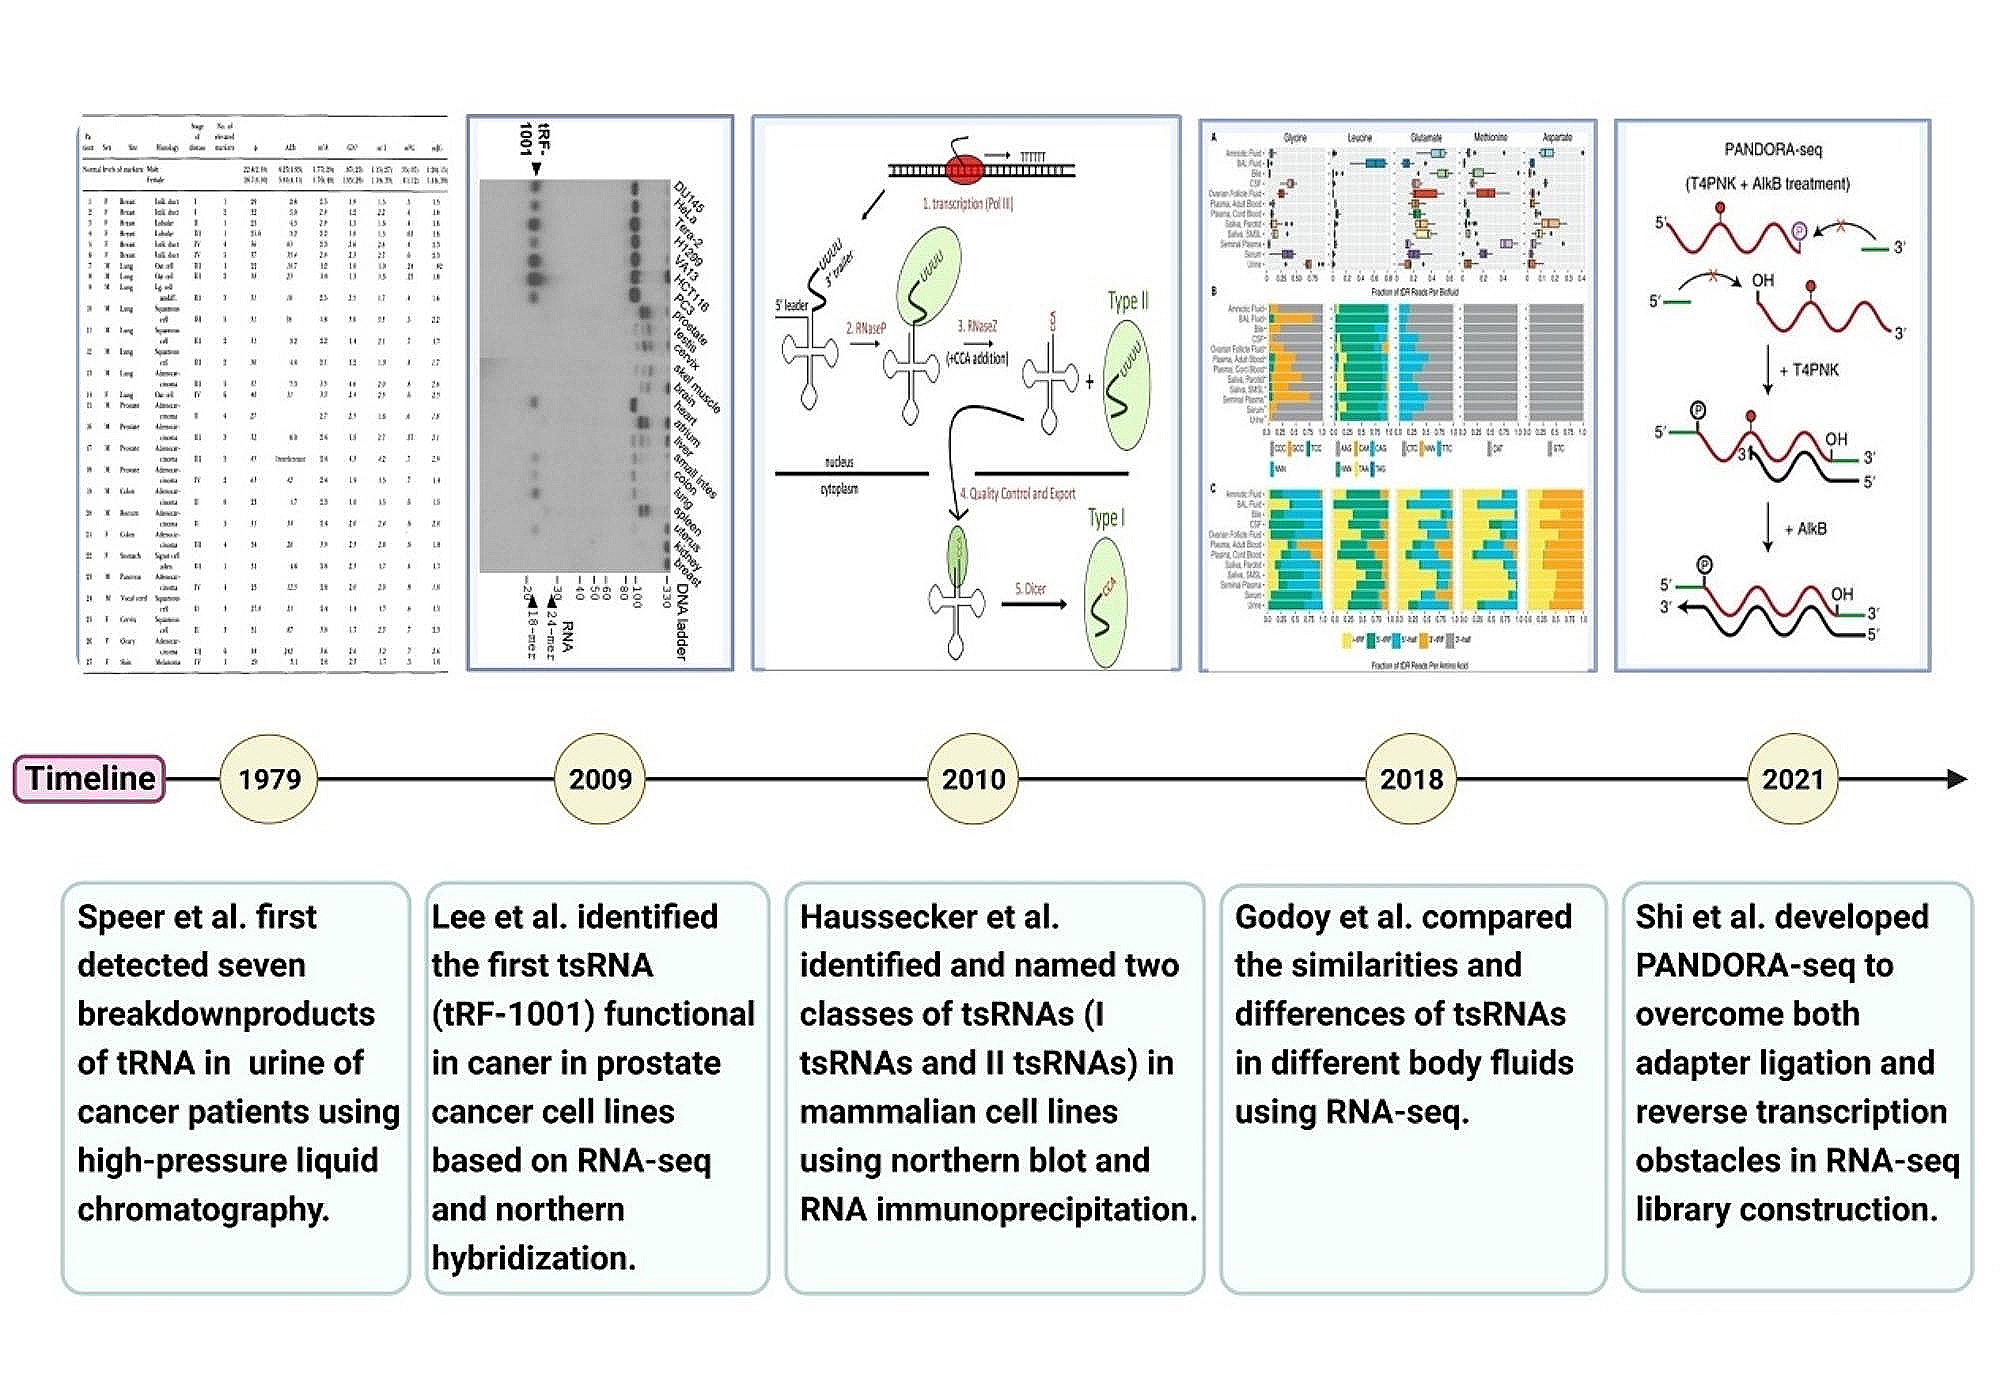
CDK9 inhibition reprograms the promoter and enhancer landscape. OCI-LY3 and VAL cells were treated with AZD4573 (30 nM) for 0, 3 and 8 h prior to harvest. After 8 h exposure, the compound was washed out and cells were harvested after 24 h. Samples were analyzed using ATAC-seq and ChIP-seq. A Differential ATAC-seq peaks were calculated using DESeq2 software (|FC| ≥|1.5|; padj ≤ 0.05). Significantly gained and lost peaks are considered regions of increased and decreased chromatin accessibility, respectively. B Table of top enriched motifs in regions of decreased chromatin accessibility in ATAC-seq. Table includes position weight matrices of nucleotide sequences comprising motifs identified using gene-based HOMER motif analysis. C Metagene analysis of normalized H3K4me3 and H3K27ac ChIP-seq signal intensity plots for all human UCSC genes ± 3 kb of the transcription start site. Gene tracks are shown highlighting the PIM3 locus. D Representative hockey stick plot of super enhancers in Val and OCI-LY3 cell lines. Enhancers were identified and ranked based on H3K27ac ChIP-seq read density as a percentage of total signal, and labeled with the nearest gene. Enhancer ranking was carried out using the ROSE2 algorithm with default parameters. The number of super enhancers per sample is shown in black. SE-associated genes are depicted as red dots. Ranks of 5 top SE-associated oncogenes are included in parenthesis. E Heatmap depicting Z-score of genes with differential SEs in VAL cells at 24 versus 0 h of treatment with AZD4573, performed in duplicate
Considering the relatively short half-life of AZD4573 in vivo, we treated cells for 8 h followed by washout. Washed cells incubated overnight then were harvested at 24 h from initial treatment. We analyzed the fate of the initially downmodulated proteins over time. Despite the initial downmodulation of MYC, continued exposure to AZD4573 did not result in complete loss of MYC protein levels (Fig. 2C). Furthermore, we observed recovery of Pim3 expression in VAL and U-2932 cells at 8 h despite ongoing CDK9i. Meanwhile, recovery of protein expression occurred by 24 h after washout of the compound (Fig. 2C). To further explore this, we leveraged the previously published RNA-Seq analysis of OCI-LY3 and VAL cells treated with the CDK9-inhibitor AZ5576 [2]. As previously noted, 3-h exposure to 300 nM AZ5576 (IC50 in DLBCL cell lines) induced global transcriptional repression, including depletion of PIM3 and JUNB transcripts (Supplemental Fig. 4A). Following the initial transcriptional nadir, certain genes began to exhibit transcriptional recovery despite ongoing CDK9i. We arbitrarily designated “recovery genes” as genes with over 10 counts per million (CPM) at baseline which were downregulated at three hours (Log2FC < 0.0) and recovered expression to levels above baseline by 6 h (Log2FC > 0.5). A total of 35 and 28 recovery genes were identified in OCI-LY3 and VAL cells, respectively, of which 9 were common to both (Supplemental Fig. 4B). These included genes contributing to lymphomagenesis (MYC, BCL2L1, IRF8, and CXCR4) along with tumor suppressor genes CDKN1A (p21) and the pro-apoptotic BH3-only BBC3 (PUMA). Of note, MCL1 did not undergo transcriptional recovery. MYC recovery was also observed by immunoblotting in OCI-LY19 cells treated with AZ5576 as early as at 4 and 6 h, but not in the sensitive SU-DHL-4 or VAL cells (Supplemental Fig. 4C). RNAPIIS2 phosphorylation was abrogated despite the recovery in MYC protein levels, suggesting that transcriptional recovery was not due to a return of CDK9 function.
Fig. 4
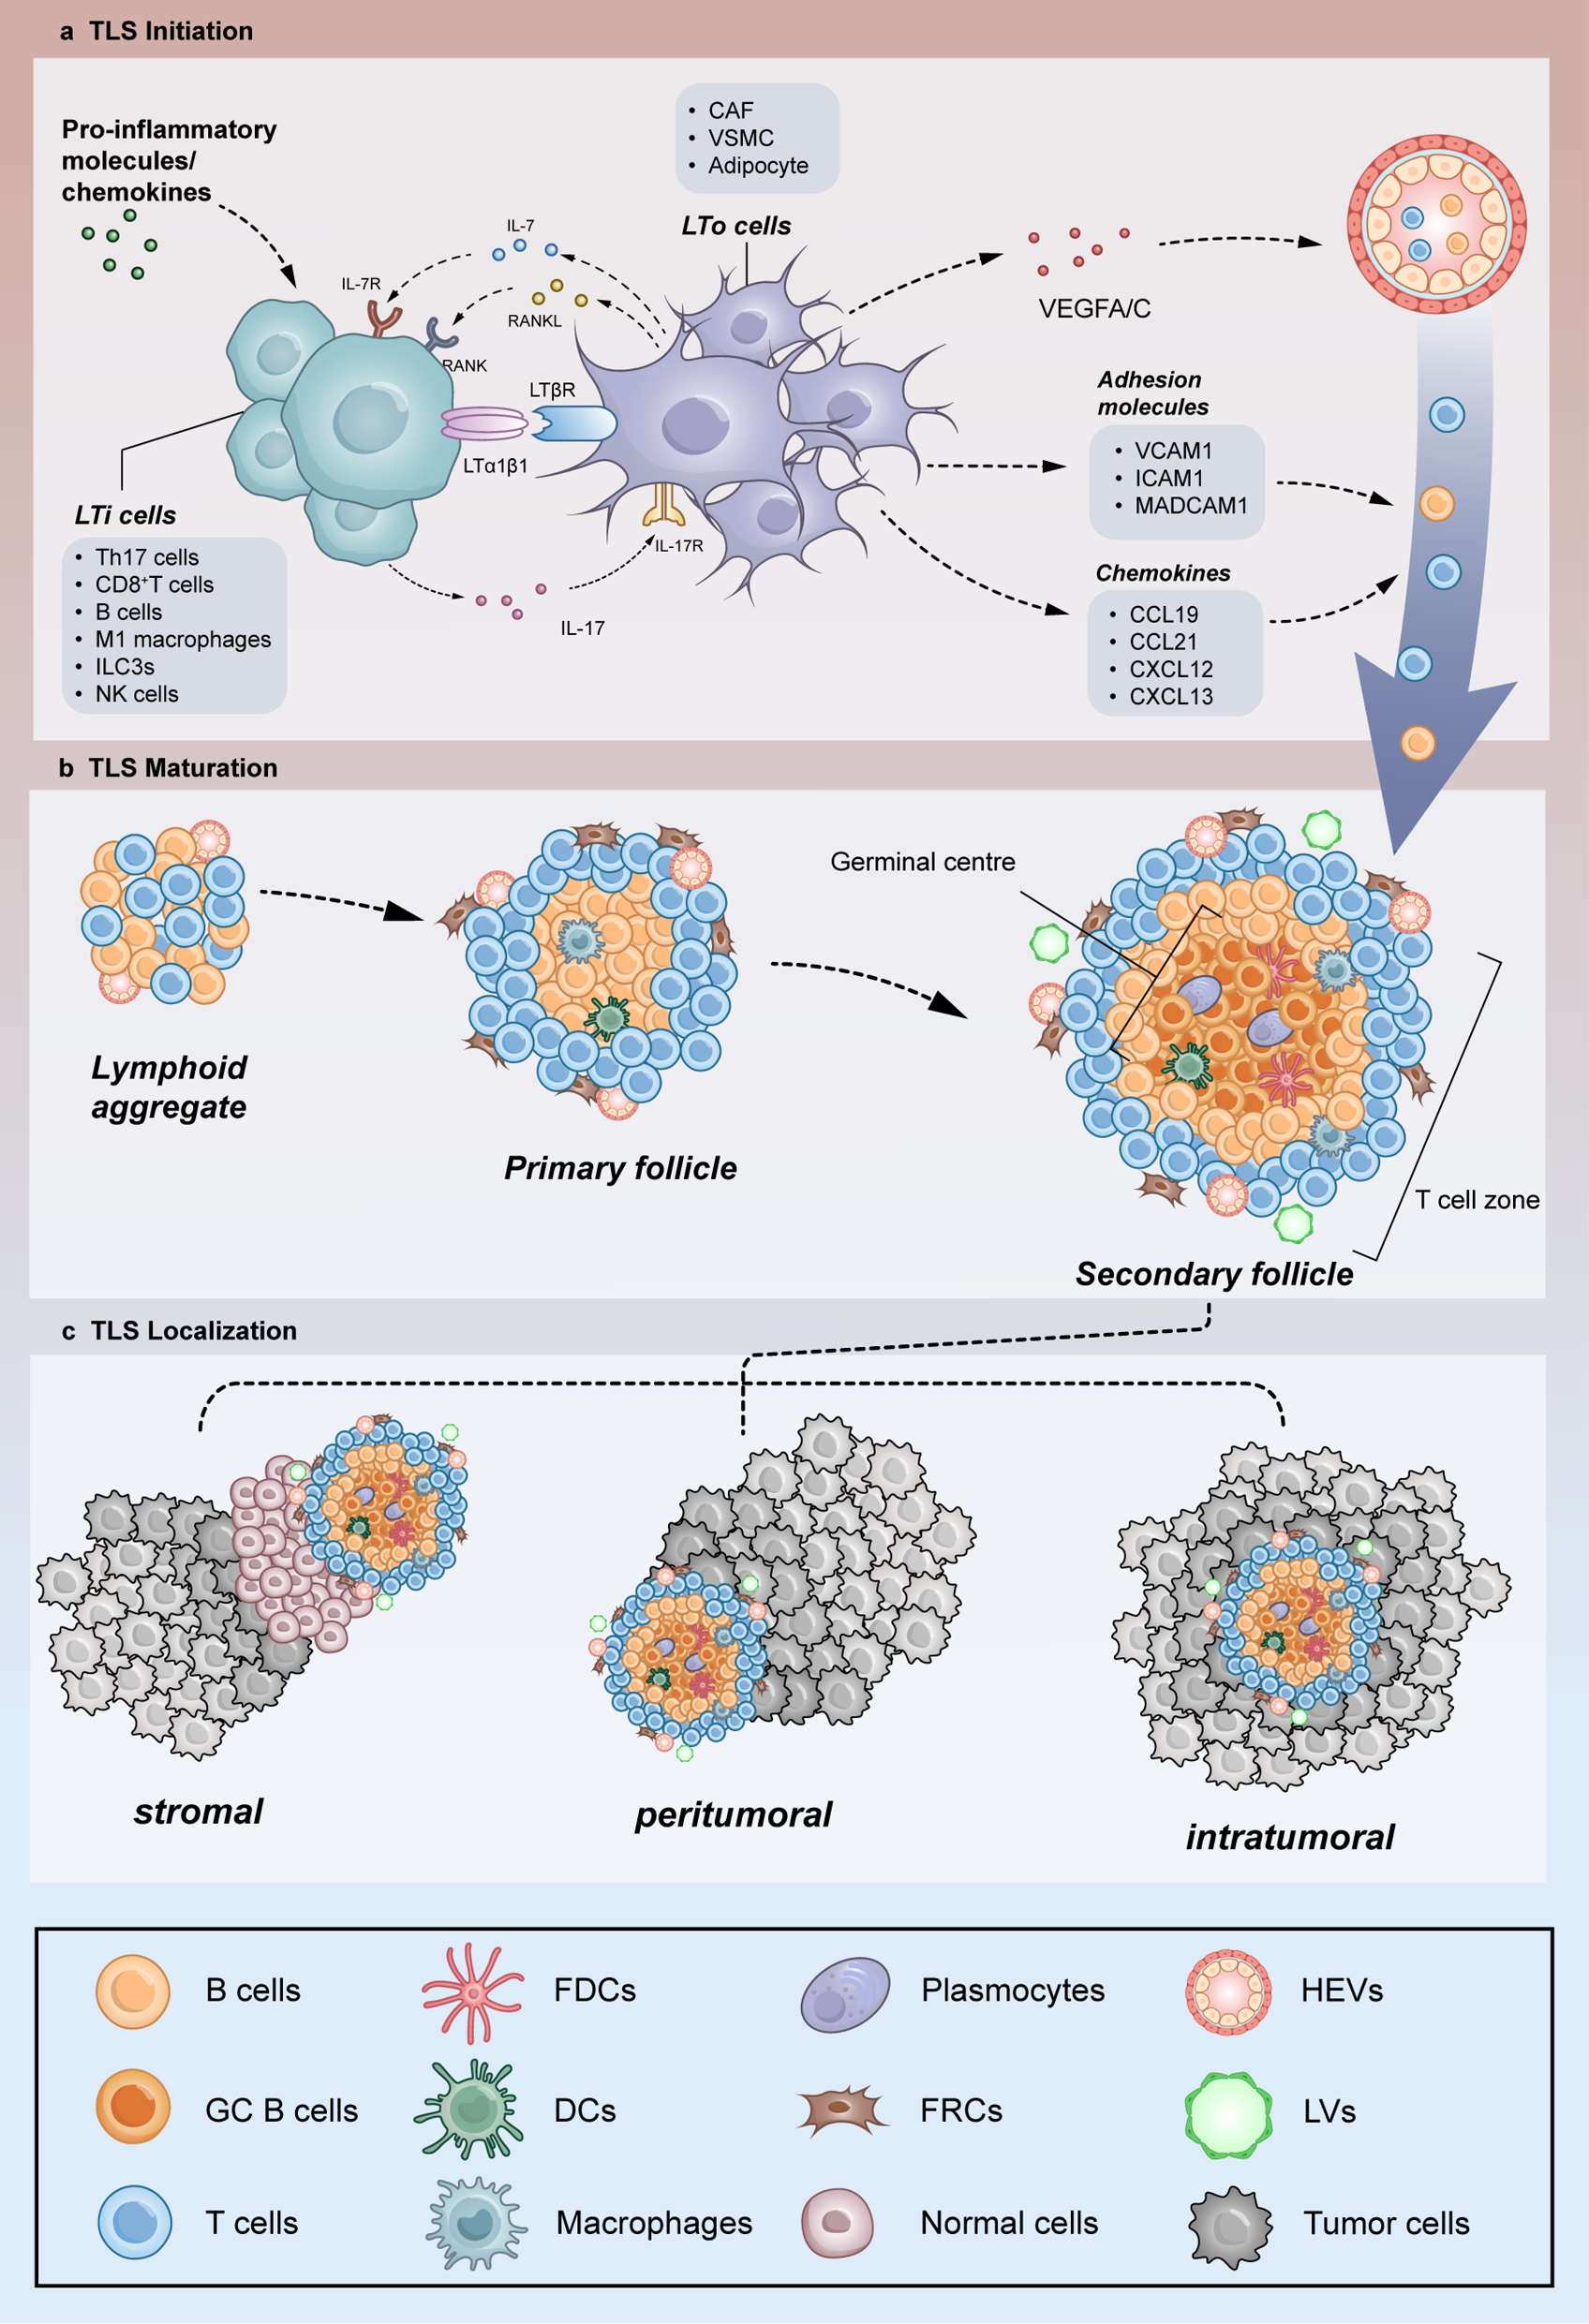
BRD4 enhances transcriptional recovery. A OCI-LY3 cells were treated with AZD4573 for 0, 3 and 8 h prior to harvest. After 8 h exposure, the compound was washed off and cells were harvested after 24 h. Samples were analyzed by ChIP-seq for BRD4 and RBP1. Data is shown as normalized ChIP-seq signal intensity plots for all human UCSC genes ± 2 kb, as well as snapshots of select gene tracks. B DLBCL cell lines were treated with AZD4573 (3 nM) and the BET-bromodomain inhibitor JQ1 (50 nM) as single agents or in combination for 48 h. Proliferation was analyzed using a colorimetric tetrazolium-based assay. Data is shown as mean ± SEM of three independent experiments. *p < 0.05 and **p < 0.01 vs. untreated control unless otherwise notated. C Gene expression fold change of select genes following treatment with AZD4573 at 30 nM, JQ1 at 1 µM, or a combination of the two in VAL and OCI-LY3 cell lines, determined by RT-PCR. Cells were treated for 0, 3 and 8 h prior to harvest. After 8 h exposure, the compound was either washed out (w) or not (c = continuous exposure) and cells were harvested after 24 h. Data is shown as mean ± SEM of three independent experiments. *p < 0.05 and **p < 0.01 vs. time-matched DMSO control
To examine how transcription of these oncogenes behaved under CDK9i with AZD4573, we performed qPCR. AZD4573 potently suppressed transcription of MYC, BCL2L1, IRF8, and CXCR4 as well as MCL1, for up to 8 h, while transcript levels of the 18 s housekeeping gene remained stable (Fig. 2E, Supplemental Fig. 4D). Most transcripts recovered following washout, while MYC and BCL2L1 were upregulated 1.35–2 fold above baseline, and PIM3 was upregulated 5–10 fold (Fig. 2E).
Thus, CDK9i induces rapid changes in the transcriptome and proteome with initial loss of multiple oncogenic transcripts and proteins, followed by transcriptional recovery of certain genes including MYC and PIM3.
CDK9i modulates promoter and enhancer architectureSince epigenetic changes play a significant role in regulation of gene expression, we studied the epigenetic landscape to better understand the mechanisms of transcriptional deregulation following CDK9i. Several factors regulate chromatin accessibility, including posttranslational histone modifications, topological organization of nucleosomes, and positioning of chromatin binding factors. To determine whether changes to the epigenome underly transcriptional deregulation following CDK9i, we first used ATAC-Seq to broadly evaluate the epigenetic landscape following CDK9i. We observed 5,331 and 20,381 differentially accessible regions in VAL cells following 3 and 8 h of AZD4573 treatment, and 3,529 and 7,830 in OCI-LY3 cells, respectively (Fig. 3A, Supplemental Table 5). We observed relatively equal numbers of genomic regions with increased and decreased accessibility. Within regions of decreased chromatin accessibility, we found enrichment of the binding motifs for CCCTC-Binding Factor (CTCF) and its paralogue, CCCTC-Binding Factor Like (BORIS; Fig. 3B, Supplemental Fig. 5A). CTCF establishes the boundaries of topologically associated domains which govern enhancer-promoter communication, and acute CTCF depletion has been shown to alter enhancer-promoter looping [11, 12].
Fig. 5
The Mediator complex regulates response to CDK9i. Genome-wide loss of function CRISPR library screening was carried out in U-2932 and SU-DHL-10 cell lines as described in the methods. Data was analyzed using the MaGeCK pipeline. A Volcano plot of library screen data in SU-DHL-10 and U-2932 cells. Dots represent the log2(mid fold change) vs. –log10(mid p-value) of all sgRNA for one gene in CDK9i-treated cells versus control. Genes with a fold change significance of p < 0.1 are depicted in blue and select genes are highlighted in red and identified with a label. B-C Gene set enrichment analysis of the library screening was carried out with WebGestalt software. B Enrichment plots from U-2932 cells using the Cellular Component gene ontology. C Significantly enriched gene sets in SU-DHL-10 and U2932 cells are shown as bar graphs using the Cellular Component gene ontology. D MED12 knockout was established in U-2932 and VAL cells using RNP electroporation as described in the methods. Whole cell lysates were subjected to immunoblotting. Cells were treated with AZD4573 or vehicle control at the indicated concentrations for 48 h. Proliferation was quantified using a colorimetric tetrazolium-based assay. Mean ± SEM is shown. *p < 0.05 and **p < 0.01 vs. NT control. A table of IC50 values is included to the right
Next, we investigated how CDK9i modulates enhancer/promoter architecture. ChIP-Seq for the activating histone marks H3K4me3 and H3K27ac was conducted in DLBCL cells treated with AZD4573 for 8 h, then it was washed out and cells were harvested after 24 h. H3K4me3 is exclusively present at promoters and facilitates binding of RNAPII [13], while H3K27ac is enriched at both enhancers and promoters of actively transcribed genes [14]. While we observed no immediate effect on either marker following short-term treatment with AZD4573 (3 h), H3K4me3 signal enrichment across promoters decreased after 8 h, and this decrease was sustained at 24 h despite washout (Fig. 3C). Promoter H3K27ac signal was similarly lost in VAL cells, but not in OCI-LY3. Despite loss of H3K4me3, epigenetic accessibility at the PIM3 and JUNB promoters increased at 8 h in both tested cell lines, suggesting an alternative promoter activation (Fig. 3C, Supplemental Fig. 5B).
We next characterized the effect of CDK9i on super-enhancer (SE) architecture. SE’s are cis-regulatory elements with asymmetrically high enrichment of H3K27ac, BRD4, and the Mediator complex [15, 16]. SE’s regulate diverse genes contributing to lymphoma pathobiology. Enhancers were ranked by H3K27ac signal density and amplitude, followed by assignment of the closest gene. We observed 905 SEs in VAL cells, accounting for 4.7% of all identified enhancers, and 973 SEs in OCI-LY3 cells, 5.4% of identified enhancers (Fig. 3D). Top ranking SE-associated genes included DTX1 and PLCG2, both known to contribute to lymphomagenesis [17, 18].
DLBCL cells exhibited sustained SE reprogramming at the 24 h timepoint (8 h followed by drug washout), with 85 and 20 gained and 92 and 29 lost SEs in VAL and OCI-LY3 cells, respectively (Fig. 3E, Supplemental Table 6). Interestingly, we found that 29% of the previously identified “recovery genes” had SE association in either one or both tested cell lines (e.g. IRF8, PIM1, BCL2L1, CXCR4) [19]. Additionally, both cell lines lost a SE proximal to the PIK3AP1 gene, which encodes a protein that links B-cell receptor signaling with the PI3K/AKT signaling pathway.
In sum, CDK9i induced broad changes to chromatin accessibility, suppressed promoter activation and led to sustained SE reprograming.
CDK9 inhibition increases binding of BRD4 to chromatinTranscriptional recovery of MYC has been observed by others in HeLa and BJ-TERT cells following treatment with “i-CDK9” or pan-CDK inhibitor flavopiridol and was attributed to a BRD4-dependent mechanism [20, 21]. The BET bromodomain-containing protein BRD4 is a positive regulator of SE-associated genes that binds to hyper-acetylated histones in order to recruit CDK9 [22]. We observed an increase in total BRD4 protein level in DLBCL cells following CDK9i (Supplemental Fig. 6A). To map localization on the genome, ChIP-Seq for BRD4 and RNAPII was carried out. Cells were treated with AZD4573 for 8 h followed by washout. Both BRD4 and RNAPII signals were rapidly enriched at promoter regions following CDK9i, observed as early as 3 h and sustained for up to 24 h despite the washout (Fig. 4A). This enrichment was variable from gene to gene, with PIM3 showing a more prominent accumulation of RNAPII. Notably, RNAPII exhibited decreased occupancy along gene bodies for the 8 h treatment, indicative of RNAPII promoter proximal pausing. RNAPII enrichment on gene bodies increased following drug washout, suggestive of transcriptional de-repression. Consistent with earlier data generated in HeLa and BJ-TERT cells, this was accompanied by increased complexing between BRD4 and RNAPII (Supplemental Fig. 6B) [20]. Importantly, we found that concurrent continuous targeting of BRD4 and CDK9 significantly attenuated proliferation of DLBCL cells compared to either experimental compound alone (Fig. 4B).
Fig. 6
Combination strategies to overcome resistance to CDK9i. A DLBCL cell lines were treated with the CDK9 inhibitor AZD4573 and/or the PIM family inhibitor AZD1208, or the PIM1 inhibitor SGI1776, as single agents or in combination at the indicated doses for 48 h. Proliferation was analyzed using a colorimetric tetrazolium-based assay. Data is shown as mean ± SEM of three independent experiments. *p < 0.05 and **p < 0.01 vs. untreated control unless otherwise notated. B Primary MCL cells were co-cultured with CD40 ligand expressing stroma for 24 h then were treated with AZD4573, AZD1208, or SGI1776 as single agents or in combination for 48 h. Apoptosis was determined by flow cytometry using Annexin-V-FITC staining. Data is from three patient samples. *p < 0.05 and **p < 0.01. C DLBCL cell lines were treated with the CDK9 inhibitor AZD4573 (3 nM) and/or the PI3K inhibitor AZD8835 (100 nM) as single agents or in combination for 48 h. Proliferation was analyzed using a colorimetric tetrazolium-based assay. Data is shown as mean ± SEM of three independent experiments. *p < 0.05 and **p < 0.01 vs. untreated control unless otherwise notated. D Primary MCL cells were co-cultured with CD40 ligand expressing stroma for 24 h then were treated with the CDK9 inhibitor AZD4573 or the PI3K inhibitor AZD8835 as single agents or in combination for 48 h. Apoptosis was determined by flow cytometry using Annexin-V-FITC staining. Data is from five patient samples. *p < 0.05 and **p < 0.01. E–F Mice were inoculated with OCI-LY3 cells as described in the methods. Once tumor volume reached 100 mm3, mice began treatment with AZD4573 (15 mg/kg; IP; once weekly), copanlisib (15 mg/kg; IP; twice weekly), a combination of both, or vehicle control. E Tumor growth starting from the first day of engraftment is shown. Data is represented as mean ± SEM of 10 tumors. *p < 0.05 and **p < 0.01, combo treatment versus control. F Kaplan–Meier survival curve is shown, significance determined by Log-rank test
Next, we aimed to determine whether BRD4 was necessary for transcription of the “recovery genes”. Concurrent continuous exposure to AZD4573 and BET bromodomain inhibitor JQ1 fully abrogated MYC, BCL2L1, and IRF8 mRNA transcription in DLBCL cells (Fig. 4C). However, washout of both compounds resulted in a fourfold upregulation of MYC transcription, thus exceeding the degree of MYC recovery following AZD4573 alone.
In sum, while inhibition of CDK9 does induce binding of BRD4 to chromatin it is unlikely that BRD4 alone is responsible for the transcriptional recovery of oncogenes, because recovery is still observed when both CDK9 and BRD4 are targeted.
Disruption of the mediator complex sensitizes cells to CDK9iWe next sought to determine genes and pathways governing the long-term cellular response to CDK9i. To that end, we conducted a genome-wide loss of function CRISPR-cas9 library screening assay. SU-DHL-10 and U-2932 cells were utilized due to their intermediate sensitivity to CDK9i, making them amenable to prolonged exposure to AZD4573. Cas9-expressing cells were transduced with a single guide RNA (sgRNA) library targeting 18,010 genes averaging 5 sgRNAs for every gene. Cells began treatment with 10 nM AZD4573 and the dose was escalated up to 30 nM over the course of 10 days. sgRNAs of the AZD4573-tolerant surviving populations were sequenced. We identified 8,472 depleted and 7,086 enriched sgRNAs in AZD4573-tolerant SU-DHL-10 cells, and 184 and 55 in U-2932 cells, respectively (Fig. 5A, Supplemental Table 7).
MED4 and AKT1, as well as CCNYL1 and MED14, were among the top depleted sgRNAs in SU-DHL-10 and U-2932 cells, respectively, indicating that knockout of these genes sensitized cells to CDK9i (Fig. 5A, Supplemental Fig. 7A). Interestingly, INTS6 sgRNA was enriched in cells which survived AZD4573, similar to a previously published genome-wide CRISPR-screen which identified that INTS6 knockout conferred resistance to CDK9i [23]. Enrichment analysis revealed that loss of the ribosome, spliceosome, mitochondrial matrix, nucleoid, and the Mediator complex sensitized DLBCL cells to CDK9i (Fig. 5B-C, Supplemental Fig. 7B; Supplemental Table 8).
Furthermore, MED12 sgRNA was significantly depleted in both cell lines treated with AZD4573 (Fig. 5A). MED4/12/14 are subunits of the Mediator complex, which is comprised of 4 main modules: the head, middle tail, and the CDK8 kinase module, which regulates the Mediator’s interaction with RNAPII [24]. The Mediator complex localizes to enhancers and links cellular signaling with the recruitment of transcriptional machinery at promoters [24]. We used sgRNA knockout to validate the relevance of Mediator complex subunits to CDK9i susceptibility. While knockout of MED14 and MED26 failed due to technical challenges (data not shown), targeted knockout of the MED12 subunit, a component of the CDK8 kinase module, enhanced cell sensitivity to CDK9i (Fig. 5D). Meanwhile, treatment with AZD4573 did not alter the Mediator complex subunits’ total protein levels (Supplemental Fig. 7C).
Thus, the CRISPR-Cas9 library screen assay suggests that the Mediator complex modulates sensitivity to CDK9i.
Strategies to overcome resistance to CDK9iDLBCL has a high degree of inter- and intra-tumor heterogeneity, dictated by factors such as cell of origin and stromal microenvironment, which results in diverse disease biology and clinical course [25]. This guided us to use our findings to investigate the currently targetable genes implicated in our proteomics experiments and the CRISPR-screen to seek out potential combination strategies with AZD4573. Given the recovery of PIM kinase mRNA and protein following CDK9i, we hypothesized that DLBCL cells would be vulnerable to targeting of PIM family kinases in this setting. The PIM family proto-oncogenes encode Ser/Thr kinases upstream of MYC, BCL2L1, and CXCR4 and are commonly overexpressed in B-cell hematologic malignancies, most notably PIM1 [26]. We thus investigated a pan-PIM family kinase inhibition (AZD1208) as well as targeted PIM1 inhibition (SGI1776). Pharmacologic inhibition of PIM kinases (AZD1208 or SGI1776) complemented AZD4573 in a panel of 4 DLBCL cell lines (Fig. 6A). We next tested this combination ex vivo. To mimic the lymph node microenvironment, we used previously established co-cultures of primary MCL cells with CD40L-expressing stroma [9]. The combination of CDK9 and PIM kinase inhibitors induced apoptosis in primary MCL cells to a greater extent than either drug alone (Fig. 6B).
We further tested the anti-tumor efficacy of combined CDK9/PIM1 inhibition in vivo. NSG mice were xenografted with OCI-LY3 cells. Once tumors reached 100 mm3, mice began treatment with AZD4573 (15 mg/kg; IP; once weekly), the PIM1 inhibitor AZD1208 (30 mg/kg; oral gavage; twice weekly), or a combination of AZD4573/AZD1208. AZD1208 was dosed 24 h after AZD4573, with the aim of suppressing PIM kinase recovery. In vivo drug combination slowed DLBCL tumor progression and extended survival compared to control with no apparent toxicity, albeit the difference was not significant compared to either compound alone in this model (Supplemental Fig. 8A-C).
Finally, we sought to investigate AKT, which was implicated in resistance to CDK9i in our CRISPR-cas9 library screen. PI3K-AKT is the most frequently activated pathway in human malignancies, and plays a central role in cellular metabolism, survival and proliferation, as well as regulation of histone methylation via EZH2 and KDM5A [27,28,29,30]. Combined treatment with AZD4573 and the PI3Kα inhibitor AZD8835 attenuated proliferation of DLBCL cells in vitro to a greater extent than either compound alone (Fig. 6C).
Pro-survival signaling emanating from the stromal microenvironment activates the PI3K-ATK axis and thereby rescues malignant cells from drug-induced apoptosis [31, 32]. Thus, we quantified apoptosis of MCL cells in a stromal co-culture described above. Concurrent targeting of CDK9 and PI3K augmented apoptosis under these conditions (Fig. 6D).
Lastly, we tested the anti-tumor efficacy of combined targeting of CDK9/PI3K in vivo, using the mouse model described above. Here mice received treatment with AZD4573 (15 mg/kg; IP; once weekly), the PI3Kαδ inhibitor copanlisib (15 mg/kg; IP; twice weekly), or a combination of both. Copanlisib was dosed 24 h after AZD4573, with the aim of suppressing transcriptional recovery of oncogenes which may be regulated by PI3K. Combined treatment with copanlisib and AZD4573 synergistically slowed tumor growth and extended survival compared to either drug alone (Fig. 6E-F). This combination treatment was not associated with weight loss in mice (Supplemental Fig. 8D).
In sum, informed by our mechanistic findings, here we identified novel strategies to overcome resistance to CDK9i in DLBCL.
留言 (0)