
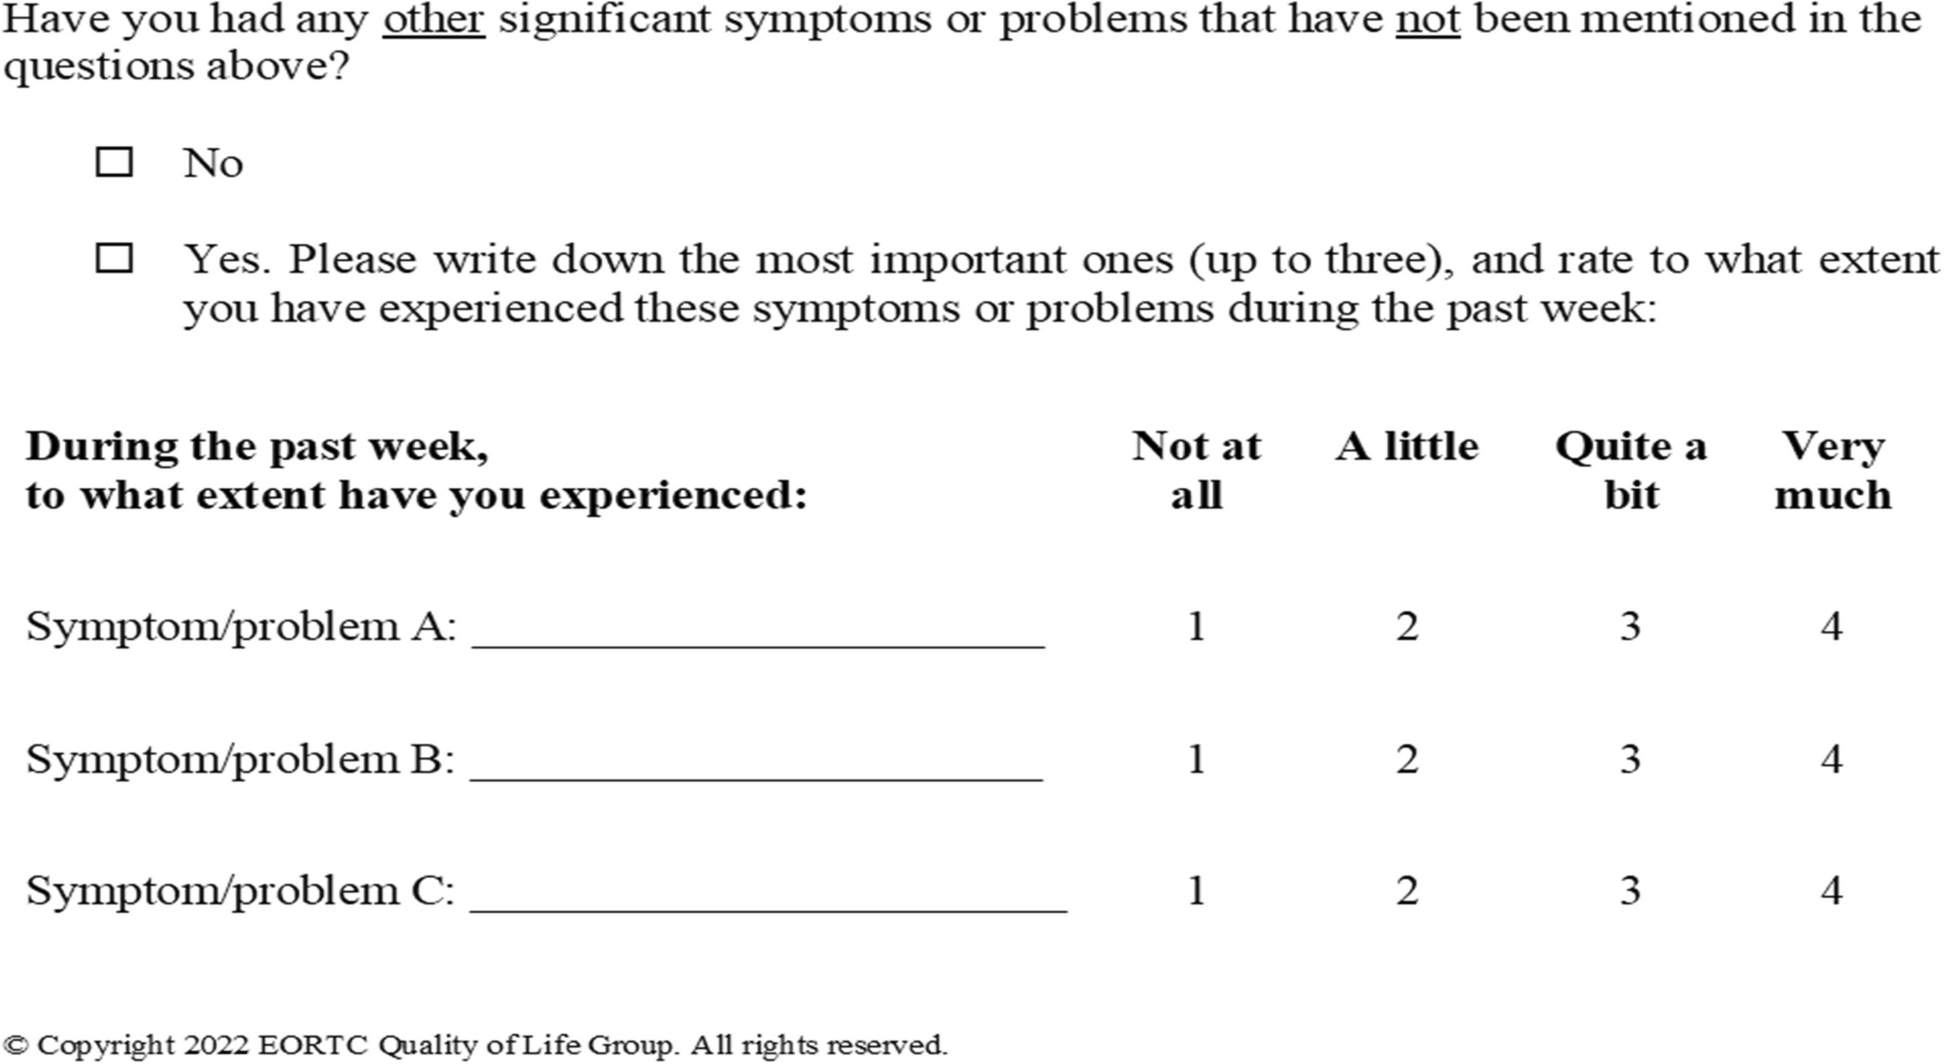
記住我
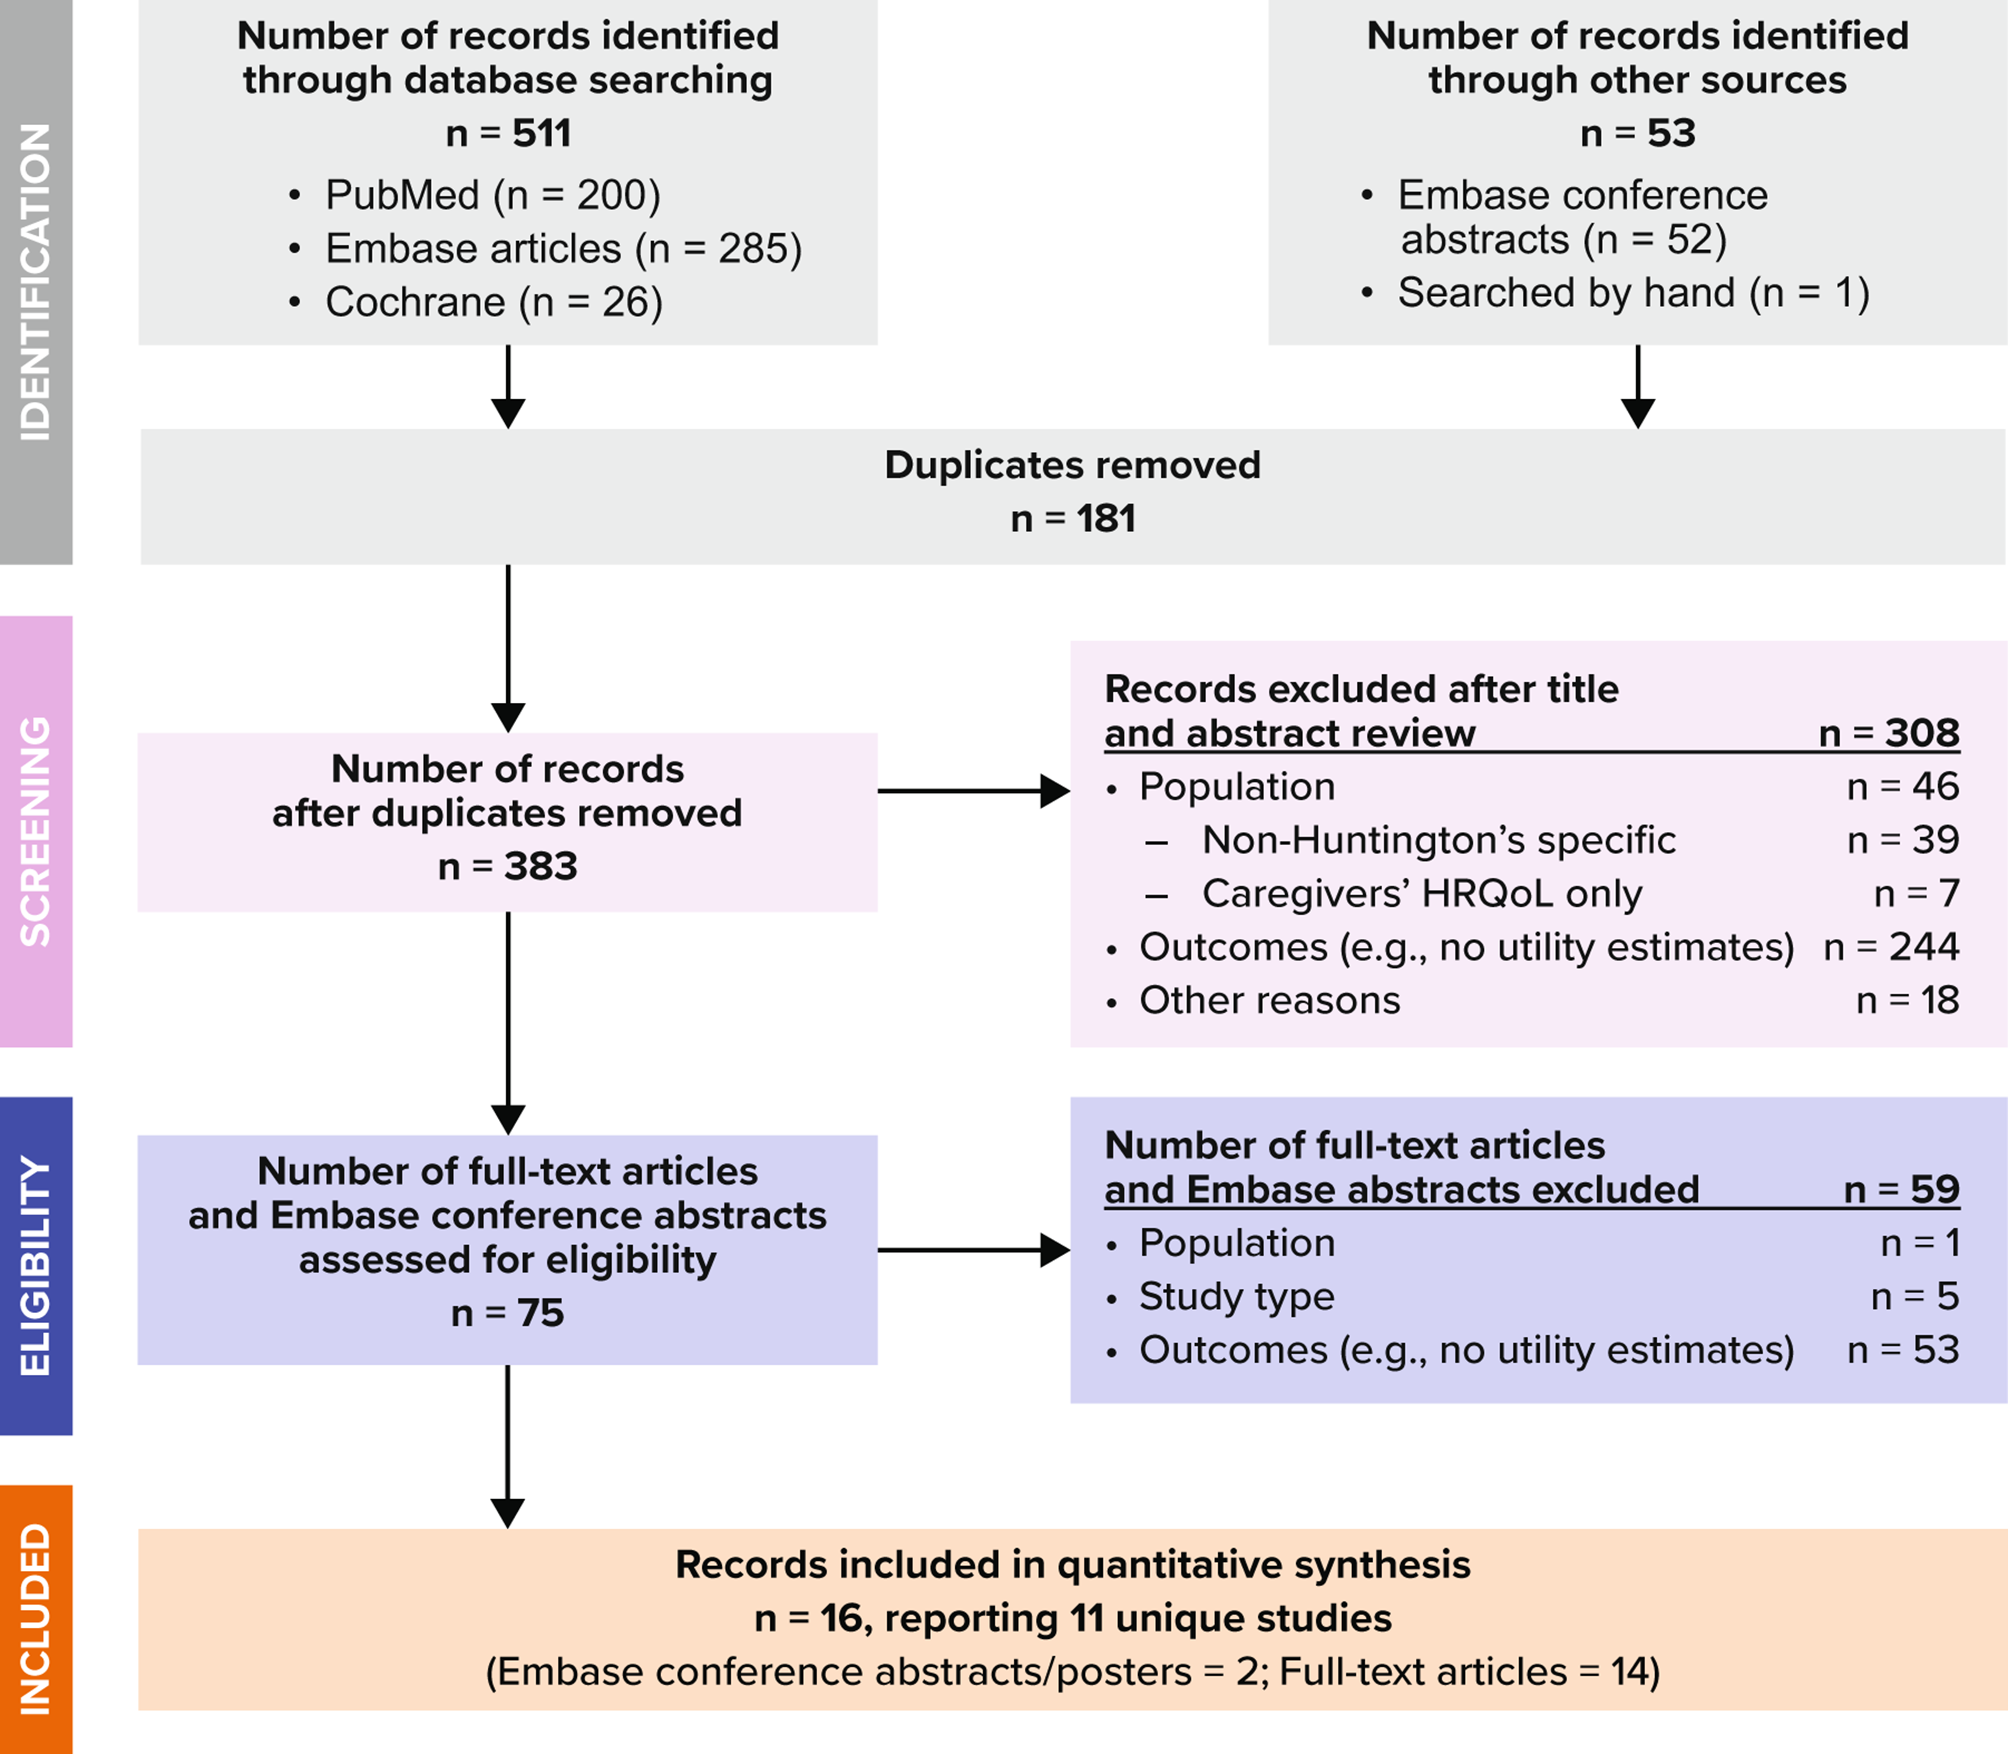
Five-hundred and ninety-eight participants took part in the study, roughly equally distributed among obstetricians (N = 198), maternity nurses (N = 200) and midwives (N = 200). Evaluation of Mahalanobis distances revealed the presence of 15 multivariate outliers in the dataset and these participants were consequently excluded from further analysis (final dataset N = 588, obstetricians N = 192 (33%), maternity nurses N = 197 (34%), midwives N = 199 (34%). The means, standard deviations, skew, and kurtosis of each PIMMHS item are shown in Table 1 below. Skew and kurtosis characteristics for each item indicate a univariate normal distribution (skew < 3, kurtosis < 10). The mean and standard deviations of the PIMMHS total score and PIMMHS-Emotion and PIMMHS-Training sub-scales were 16.78 (3.92), 9.42 (2.80) and 7.36 (1.61) respectively.
Table 1 Individual item and distributional characteristics of the professional issues in maternal mental health scale (PIMMHS)Group comparisonsOne-way between groups analysis of variance (ANOVA) revealed highly statistically significant differences on PIMMHS total and PIMMHS-training sub-scale scores based on professional affiliation as the grouping variable (Table 2.). Post-hoc Bonferroni-adjusted comparisons revealed statistically significant differences between maternity nurses and obstetricians (p < 0.05) and between midwives and obstetricians (p < 0.05) with the nurses and midwives having higher PIMMHS total and PIMMHS-Training sub-scale scores.
Table 2 One-way between-subjects ANOVA of PIMMHS sub-scale and total scores as a function of group typeConstruct validity358 cases were used for the CFA of the Chinese Version of Perinatal Illness Perceptions Scale (PIPS-C), 135 cases for the Chinese Version of Perinatal Mental Health Awareness (PMHA-C), and 105 cases for the Chinese Version of professional issues in maternal mental health scale (PIMMHS-C).
A roadmap was drawn according to the 3-factor model of the original PIPS-C scale and the constructed model was tested using the maximum likelihood method. Model correction was applied to the initial model based on the MI (Modification Indices). 3 residuals Cov (e2, e3), Cov (e4, e5), and Cov (e9, e15) were set as free parameters to improve the model fit. The modified model fit indices were χ2/df = 3.241, RMSEA = 0.079, CFI = 0.901, IFI = 0.902 and RMR = 0.017. The modified model is shown in Fig. 2a and the model fit results are presented in Table 3.A 3-factor a priori model following the original PMHA-C scale was used as the latent variable to plot the pathway and the constructed model was tested using the maximum likelihood method. Model correction was applied to the initial model based on the MI (Modification Indices). 3 residuals Cov (e3, e6), Cov (e5, e8), and Cov (e6, e9) were set as free parameters to improve the model fit. The modified model fit indices were χ2/df = 2.289, RMSEA = 0.098, CFI = 0.964, IFI = 0.965 and RMR = 0.018. The modified model is shown in Fig. 2b and the model fit results are shown in Table 3.
Fig. 2

Results of the confirmatory factor analysis for the modified a PIPS-C (n = 358), b PMHA-C (n = 135), c PIMMHS-C (n = 105)
Table 3 Confirmatory factor analysis modelsA 2-factor a priori model following the original PIMMHS-C scale was used as the latent variable to plot the pathway and the constructed model was tested using the maximum likelihood method. Model correction was applied to the initial model based on the MI (Modification Indices). 3 residuals Cov (e1, e6), Cov (e1, e4), and Cov (e2, e3) were set as free parameters to improve the model fit. The modified model fit indices were χ2/df = 3.135, RMSEA = 0.143, CFI = 0.956, IFI = 0.957 and RMR = 0.038. The modified model is shown in Fig. 2c and the model fit results are shown in Table 3.
Divergent validityCorrelations between PIMMHS total and sub-scale scores and the MHLC ‘Doctors’ sub-scale are summarised in Table 4. Against prediction, correlations between the PIMMHS total score and PIMMHS-Training sub-scale were noted to be statistically significant (p < 0.05).
Table 4 Pearson’s r correlation coefficients between PIMMHS sub-scale and total score and the MHLC ‘Doctors’ sub-scale (divergent validity) and PMHA-SAD subscale (convergent validity)Convergent validitySignificant positive correlations were observed between all PIMMHS total and sub-scale scores and the PMHA-SAD sub-scale (PIMMHS total, r < 0.33, p < 0.001; PIMMHS-Emotion sub-scale, r = 0.22, p < 0.001, PIMMHS-Training sub-scale, r = 0.42, p < 0.001).
Known-groups discriminant validityStatistically significant differences were observed for both PIMMHS sub-scales and the.
PIMMHS total score as a function of the median-split PIPS-Causes sub-scale classification.
(Table 5). Cohen’s d revealed effect sizes to be small for all between-groups comparisons.
Table 5 Medium-split group categorisation on the PIPS-Causes sub-scaleInternal consistencyCronbach’s alpha of the PIMMHS total scale, PIMMHS-Emotion and PIMMHS-Training sub-scales were 0.852, 0.784 and 0.682 respectively (Table 6).
Table 6 Reliability test results (n = 598)
留言 (0)